The Geometry of Fraud Detection

Fraud detection is about finding data points that are outside the normal range of probability, often called outliers. In this blog, I look at some simple statistical ways to find outliers and also try to visualize what an outlier would look like if we were to use virtual area or virtual volume as geometric representations to find outliers. An understanding of these fundamental statistical concepts will lead to better fraud detection.
Probability
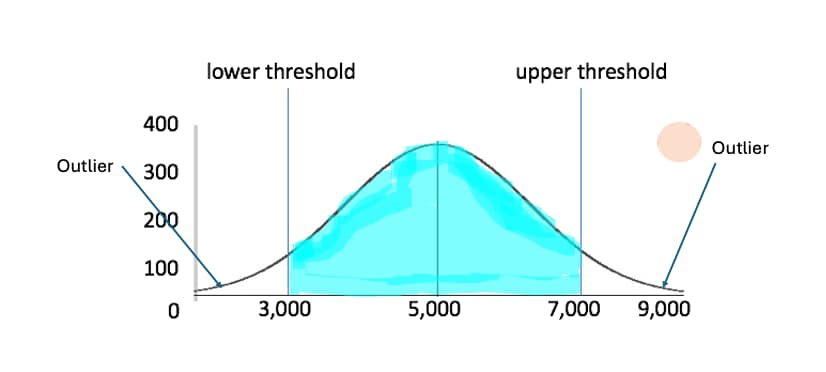
Let’s look at some simple mathematical concepts about the basics of outliers before discussing the main points for this article. The most basic question to ask about an outlier is what is the probability that it will occur? Let’s take a look at a near normal distribution using a sample bell curve.
Note: Credit for the area under the bell curve graph goes to Josh Starmer of StatQuest.

The idea is that the middle of the bell curve represents the mean of all events, while the downward curve away from the middle represents various standard deviations away from the mean. The area under the curve is the probability that an event will occur. Notice as we move away from the colorful area, there is less of a probability the event occurs. These are outliers as their probability for occuring is a small percentage compared to the higher percentage in the colorful area. If this bell curve represents possible values for fraud detection, it is the outliers that are most likely flagged as possible fraud.
Percentiles
We can build upon the outlier use case and use percentiles to look for indicators of fraud. In Splunk, one can use the eventstats command to find the 90th percentile for any numerical variable for all events. In theory, if the variable’s value is in the 90th percentile, then it is an outlier. If there are two variables of interest, both within the 90th percentile of their respective dataset, then the chances of declaring the event as fraudulent increases. For example, suppose we have transaction data containing total amounts transferred and the frequency of the number of transfers done within a day. If a customer is within 90th percentile of both the total amount transferred and their frequency is also over the 90th percentile, then this looks like suspicious behavior and it should be flagged as such. In SPL, this would look like the following.
index=transactions sourcetype=transfers | eventstats perc90(Amount) as percAmount perc90(Frequency) as percFrequency|where Amount>percAmount and Frequency>percFrequency |eval RiskScore_HighFreqAmount=30 | table Customer Amount Frequency percAmount percFrequency RiskScore_HighFreqAmount

An arbitrary risk score is added to the end to send to a risk index for further processing. For the purposes of this example the risk score is arbitrary, but your risk score in real life is based on your own usage and normalization techniques according to what suits your use case. In this example, all customers who are over the 90th percentile for amount and frequency are flagged. Because the amount can be magnitudes larger than the frequency value, we can use the log function to bring the amount value within the same magnitude as the frequency. There are other ways to do this such as using a StandardScaler function in machine learning, but we will keep it simple by using log here.
index=transactions sourcetype=transfers | eval Amount=log(Amount)|eventstats perc90(Amount) as percAmount perc90(Frequency) as percFrequency|where Amount>percAmount and Frequency>percFrequency |eval RiskScore_HighFreqAmount=30 | table Customer Amount Frequency percAmount percFrequency RiskScore_HighFreqAmount

Now, the Amount field is at a more reasonable magnitude, but the results are the same. Let us move on to what could be a better way to look for an outlier.
Compute the Area
We know the area of the rectangle is length times width. What if we view our two variables as measurements and the multiplication of the two produces a virtual area? In this case, we multiply the log(Amount) by the Frequency. This produces the virtual area and we can use the lowest possible 90th percentiles to find the lowest possible area such that the two numbers multiplied stay within the virtual area, in which case this is still considered an outlier. Let’s continue this with our example to get the minimum area that uses the 90th percentile of both variables.
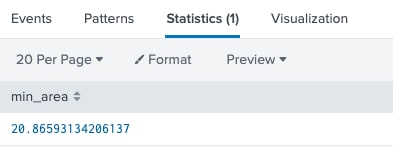
index=transactions sourcetype=transfers |eval Amount=log(Amount)|eventstats perc90(Amount) as percAmount perc90(Frequency) as percFrequency|where Amount>percAmount and Frequency>percFrequency |eval area = Amount * Frequency|stats min(area) as min_area

With this in mind, can we assume that any combination of Frequency * Amount that is greater than 20.87 can be considered suspicious, because our training dataset told us this involved numbers from each variable in the 90th percentile? If so, then, we no longer need to use 90th percentiles to find possible fraud. We can now say that any virtual area less than 20.87 will be dismissed, but if any combination of Frequency * Amount is greater than that number, it will lead to a risk score. This heuristic is different from the previous one, but it allows for an easier calculation such that an extreme value in just one variable will not skew the results. Our new search will be as follows.
index=transactions sourcetype=transfers | eval Amount=log(Amount)|eval area=Amount * Frequency|where area > 20.87|eval RiskScore_HighFreqAmount=30 | table Customer Amount Frequency area RiskScore_HighFreqAmount|sort - area

The first thing to notice is that the search is simpler. It’s based on any measurement greater than the virtual area is considered suspicious. The next thing to notice is one more customer (English) was listed here as their original measurements were not both above the 90th percentile, but the combination of the two variables is enough to go over our threshold.
Why bother to do this? Think about the case where one variable is almost at the highest percentile while the other variable is at the 89th percentile. If we were simply comparing to see if both variables were above the 90th percentile, which in this case they are not, we would miss the potential outlier. However, the multiplication of both variables easily surpasses our boundaries for a risk indicator. This allows us to be more flexible in discovering possible fraud as one variable may be close to a threshold, while another easily surpasses it.
Visually, any rectangular shape can be used to compute the logical area to see if it is above a threshold.

Any combination that increases the area beyond our threshold will be given a risk score.
Using Cubic Volumes
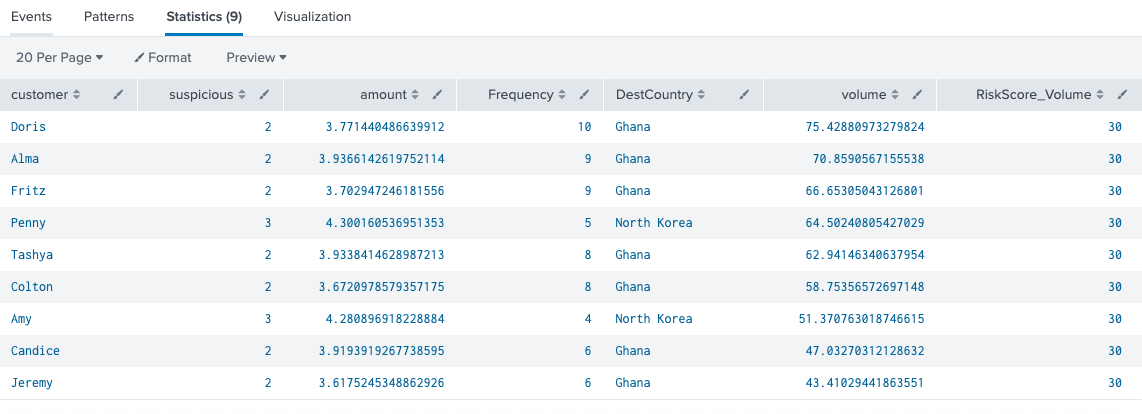
What if we used three variables instead of two? We’ll use wire transfer data in the next example and add a suspicious country score. All countries will get an initial score of 1 and if they are suspicious, they will get a score of 2. A really suspicious country will get a score of 3. Our formula will now be amount * Frequency * suspicious. This will compute a virtual cubic volume. If the virtual cubic volume is over a predefined threshold, this entity should get a risk score just like we did before. In the next SPL example, we artificially provide a suspicious risk rating using a case statement for each Country in the dataset with a default rating of 1. (The assignment of 1, 2, and 3 could have been done in any way preferred by the writer of the SPL as this example is just for illustration.)
index=transactions sourcetype=wire_transfer |eval amount=log(amount) | iplocation destIP|rename Country as DestCountry|eval suspicious = case(DestCountry=="United States", 1, DestCountry=="Ghana", 2, DestCountry=="North Korea", 3, 1=1, 0) |eval volume=amount * Frequency * suspicious| where volume > 40| eval RiskScore_Volume=30| table customer, suspicious, amount, Frequency, DestCountry, volume, RiskScore_Volume |sort - volume

The new things in this search are the use of iplocation to find the country name of the destination IP address, the use of the case function to assign scores to countries, and finally using a virtual volume to look for suspicious behavior. In deployment, instead of using a case function, it is better to use a lookup to determine the risk rating as there are over 200 countries in the world. The use of 40 is an arbitrary predetermined threshold of fraud. We could have used the percentile method from above to show all events that had where Frequency>p_Frequency and suspicious>=p_suspicious and amount>p_amount to help compute the threshold, but my dataset was not aligned to the point where events had all 3 variables in the highest percentiles at the same time. That is why I arbitrarily chose 40 as the threshold after examining some of the highest values of these variables. This threshold should be fine tuned over time with more training data. One could argue that using three variables instead of two can lead to less false positives, if a proper threshold is used. Visually, this method can be shown with these sample cubes.

We can take this one step further and use the multiplication of four variables instead of three as long as we have faith in that 4th variable to accurately find the probability of fraud. Although, this can not be visualized due to our limitations of three dimensional space, mathematically, any number of dimensions can be used. Frankly, I think the more dimensions that are used after four makes it difficult to tell if any one variable is influencing the results without having to resort to machine learning to figure out the correlation of each variable to all the others.
Since multiple variables are being used to create a number that can be compared to a predetermined threshold, the question then comes up, are risk scores even needed and can a judgment of possible fraud be made on the spot? This depends on the efficacy of each variable for predicting fraud. A large training set of real world tested data should be used to see at which point false positives or false negatives come into play too often. The best thing to do is continue to use risk scores with each result to add to a risk index for further summation to accurately predict fraud. After understanding what works and does not work, after a few weeks of testing with real data, risk scores may be abandoned for some use cases where we are certain it is fraud as a judgment of fraud can be made immediately by the multiplication of variables. For instance, if someone is withdrawing thousands of dollars from two different ATMs at the same time, we can be certain this is fraud. The usage of multiplying high percentile variables as indicators of fraud is an implicit way to calculate risk. In the traditional way, each variable would be part of the rule and the rule would be given a risk score because of the outlier value of the variable. Then, all of the entity’s risk scores would be summarized to compare to a threshold to determine fraud. In contrast, this virtual geometric area or volume method described here is doing the same thing by implicitly using the outlier values of variables to ascertain risks all at once making the approach simpler.
Conclusion
Fraud is based on outliers as they show a low probability of occurring. If multiple variables show a very high percentile of occurring at the same time, which should not happen in normal situations, then this could be an indication of fraud. Another way to calculate this is to multiply each influencing variable in the dataset by each other to form a N dimensional shape. This will allow an extremely high value of a variable to manifest itself in the resulting multiplication as its high value influences the final result. To not let any one variable’s high magnitude affect the final outcome, consider using the log function to reduce the magnitude of a high magnitude variable to the same magnitudes as other variables. If the encompassing value of the N dimensional shape is over a threshold value, then consider this event an outlier as the entity (customer in our case) is a candidate for fraud. A risk score can then be added to this set of actions. In certain high probability fraud use cases, we can abandon risk scores entirely if we are reasonably sure the N variables that are used to create the encompassing shape are enough to predict fraud and their high percentiles always lead to positive fraud detection. This should cautiously be done with the use case in mind after testing against real world data that has already been known to be fraudulent or non-fraudulent. However, to be conservative, it may make sense to use the logical geometric area or volume of multiple high percentile variables as indicators of risk rather than definite indicators of fraud as we should have a plethora of tested use cases for positive fraud indicators before making absolute decisions.
Related Articles
About Splunk
The world’s leading organizations rely on Splunk, a Cisco company, to continuously strengthen digital resilience with our unified security and observability platform, powered by industry-leading AI.
Our customers trust Splunk’s award-winning security and observability solutions to secure and improve the reliability of their complex digital environments, at any scale.


