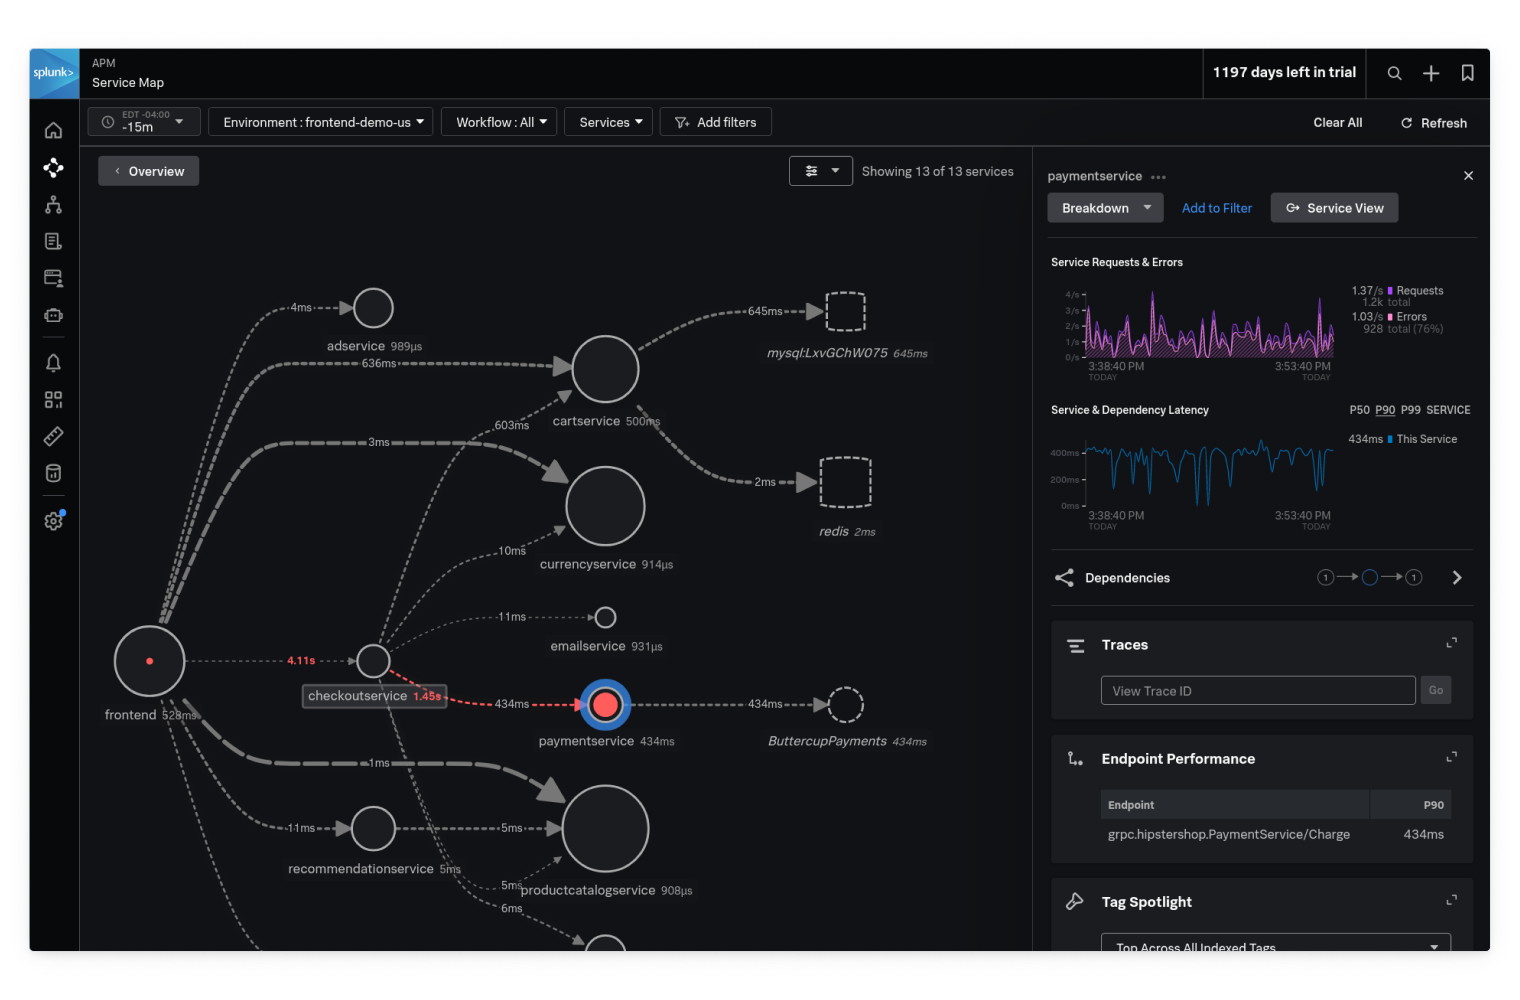
GenAI-powered experience
Find issues even faster, get expert guidance for troubleshooting, and improve your productivity with AI Assistant.
AI infrastructure and AI agent monitoring
Monitor the performance, quality, security, and cost of your AI application stack, from agents and large language models (LLMs) to the underlying infrastructure.
Application performance monitoring
Spot any issue that impacts your business and accelerate MTTR by combining all of the related data in intuitive visuals.
Database monitoring
Pinpoint and resolve slow queries, correlate application performance issues, and get AI-powered recommendations to accelerate fixes.
Full context infrastructure monitoring
Improve hybrid cloud performance with instant visibility and real-time alerts.
Digital experience monitoring
Gain insights into frontend performance and deliver seamless user experiences with Splunk Real User Monitoring and Synthetic Monitoring.
Deeper log context
Start investigating application and infrastructure logs already stored in Splunk Platform in minutes for the "why?" behind software behavior.
Features
Get to root causes faster for less time in war rooms
Experience the power of Splunk Observability Cloud, the full-stack, OpenTelemetry-native platform for deep visibility across environments.
OpenTelemetry-native
Own and control your data, avoid vendor lock-in, and instrument only once on a common standard as you build new applications.
AI powered analytics and guidance
AI/ML-driven features like Service Maps and Trace Analytics provide directed guidance that helps you resolve issues faster.
No data sampling
Eliminate blind spots by collecting and analyzing 100% of your data with Splunk’s NoSample™ tracing.
All your logs in context from Splunk Platform
Automatically correlate petabyte-scale log analytics with real-time metrics and traces to get to accurate root causes earlier and easier.
Troubleshoot based on business impact
Integrate business context workflows and tags with telemetry data to prioritize troubleshooting based on the actual impact to your business.
Take control of your data and costs
The ability to aggregate, filter, and transform your data means you can keep all your metrics while only paying for what you need.

Are you a current Observability Cloud customer looking for learning resources?


CUSTOMER STORY

Rent the Runway is More Resilient With Splunk
Since we’ve upped our usage and adoption of Splunk, we haven’t had an outage and the last critical incident was resolved in less than 15 minutes.


