Observability Meets Security: Build a Baseline To Climb the PEAK

When we hunt in new environments and datasets, it is critical to build an understanding of what they contain, and how we can leverage them for future hunts. For this purpose, we recommend the PEAK Threat Hunting Framework's baseline hunting process.
Observability (O11y) tools provide a great source of information about how services interact with clients and each other, especially cloud-native and containerised services where the traditional log sources and the instances-that-live-for-years pattern is (thankfully) becoming less prevalent.
In this post we will look at how to apply the baseline hunting process to some common O11y data sources and show how the OpenTelemetry standard offers easier data analysis. For an introduction to the baseline hunting process, see David Bianco’s post, "Baseline Hunting with the PEAK Framework."
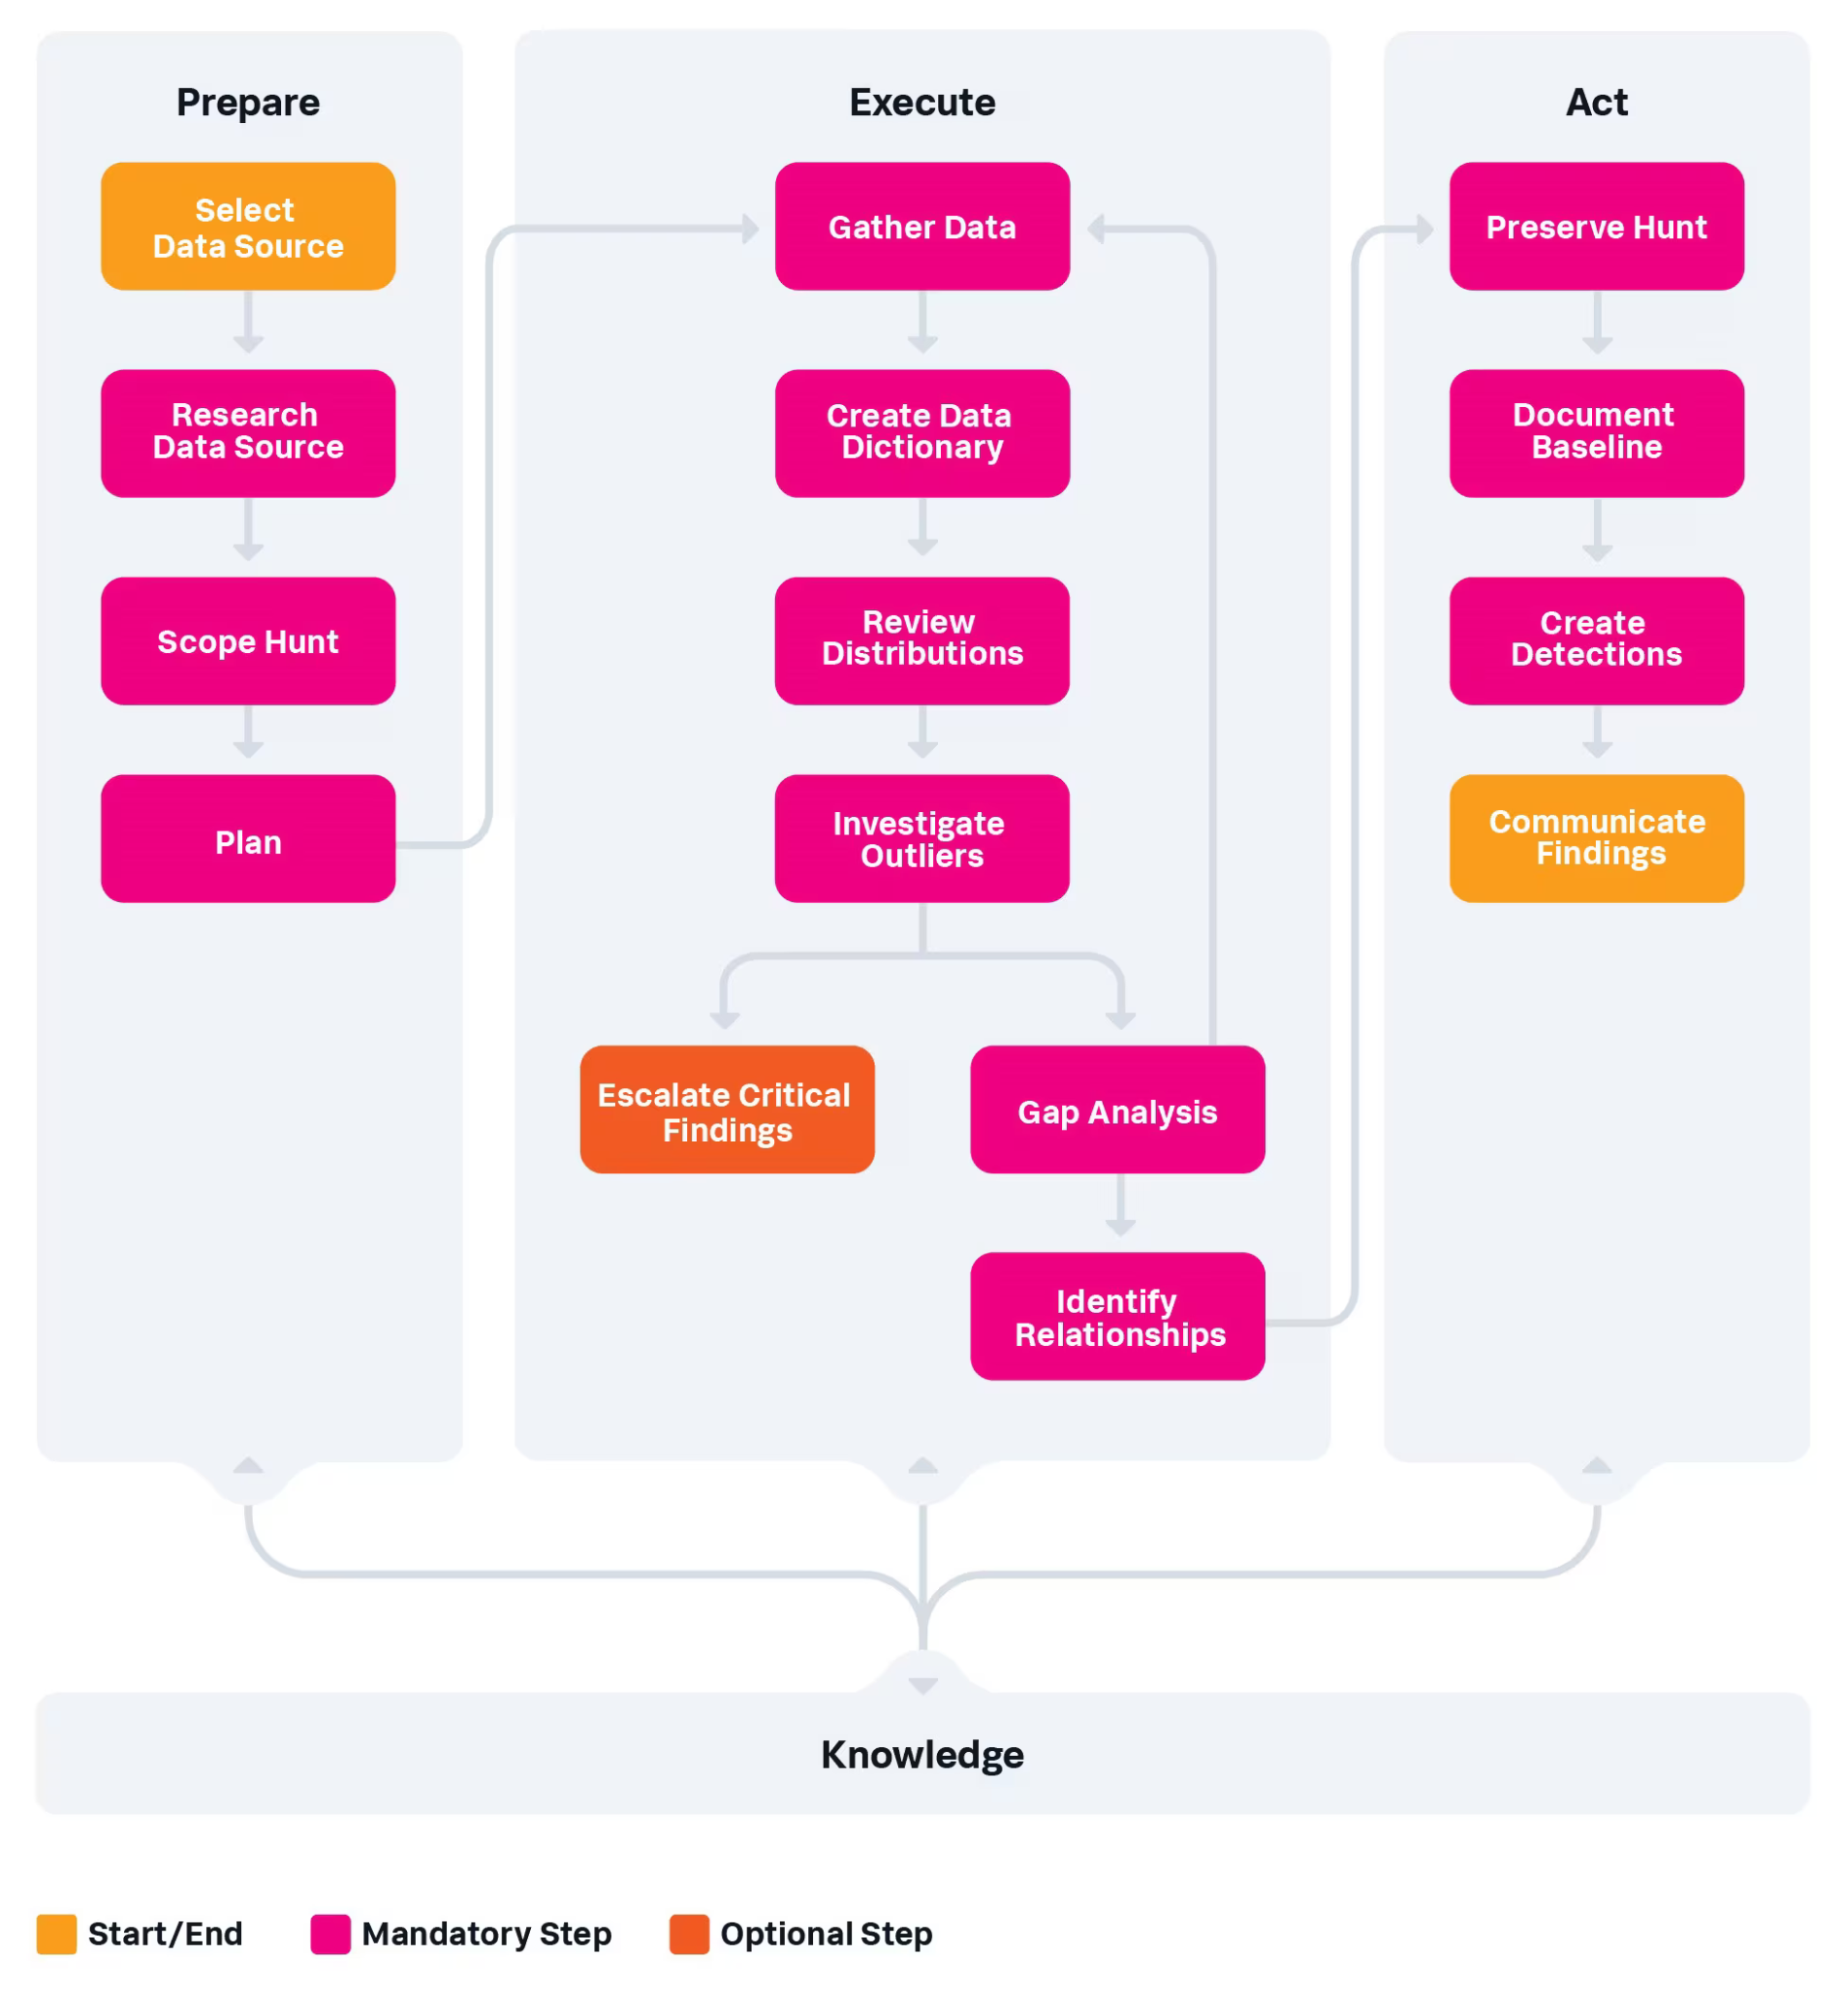
Here is the flowchart for baseline hunting, for those who aren’t familiar. The process begins with the “Prepare” stage, followed by “Execute,” then “Act with Knowledge,” hence the PEAK acronym.

Baseline Hunting Flow Chart
Select a Data Source
This step is the easiest. We’re going to dig into the Observability data in our environment! Skipping ahead a step to “Scope the Hunt” in the “Prepare” stage, we’re going to focus on a single service in a single environment. Mainly because that is what I can take screenshots of, but also because it is good to focus on one thing at a time.

Oh look, another dataset! #adhd #squirrel
Research Data Source
This is where the OpenTelemetry standard shines; there are standards (“semantic conventions”) for field/attribute naming and typing, giving us a clear indication of what should be available and how to identify it.
As you repeat the baselining process over different services, you can refer to previous baselines and reuse your collection methods, speeding up the process.
Straight out of the gate the OpenTelemetry standard provides attributes identifying:
- Downstream Services (Databases, APIs)
- URL endpoints ( “/”, “/auth/login”)
- HTTP methods (GET, POST, DELETE)
- Business workflows (Checkout, Login, Logout, New Account)
- Request counts (they’re likely cyclical, depending on your user base)
- Response times
- Failure rates and error types
- TLS details like ciphers and certificates from both the client and server end
- User-specific tags like geographical location or account/service class
Document any existing monitoring or detection measures implemented for that data, as well as the individuals or teams responsible for the systems or applications creating the data. This should be easy as the folks who set up the O11y integrations will (hopefully!) be monitoring the application.
Plan the Hunt
Using what you learned from your research, outline the tools, techniques, and resources you'll need to baseline your data source(s). Consider that the goal here is to get a complete and detailed understanding of your chosen data source, e.g., its fields, values, patterns, distributions, etc.
- How exactly will you gather the data you need?
- Which analytic techniques will you use to assess what you’re searching for?
- If you have a hunt team (as opposed to an individual hunter), who is doing what part(s) of the hunt?
Making a good plan helps to ensure the “Execute” stage goes smoothly, so it is worth spending a little time here.
Gather Data
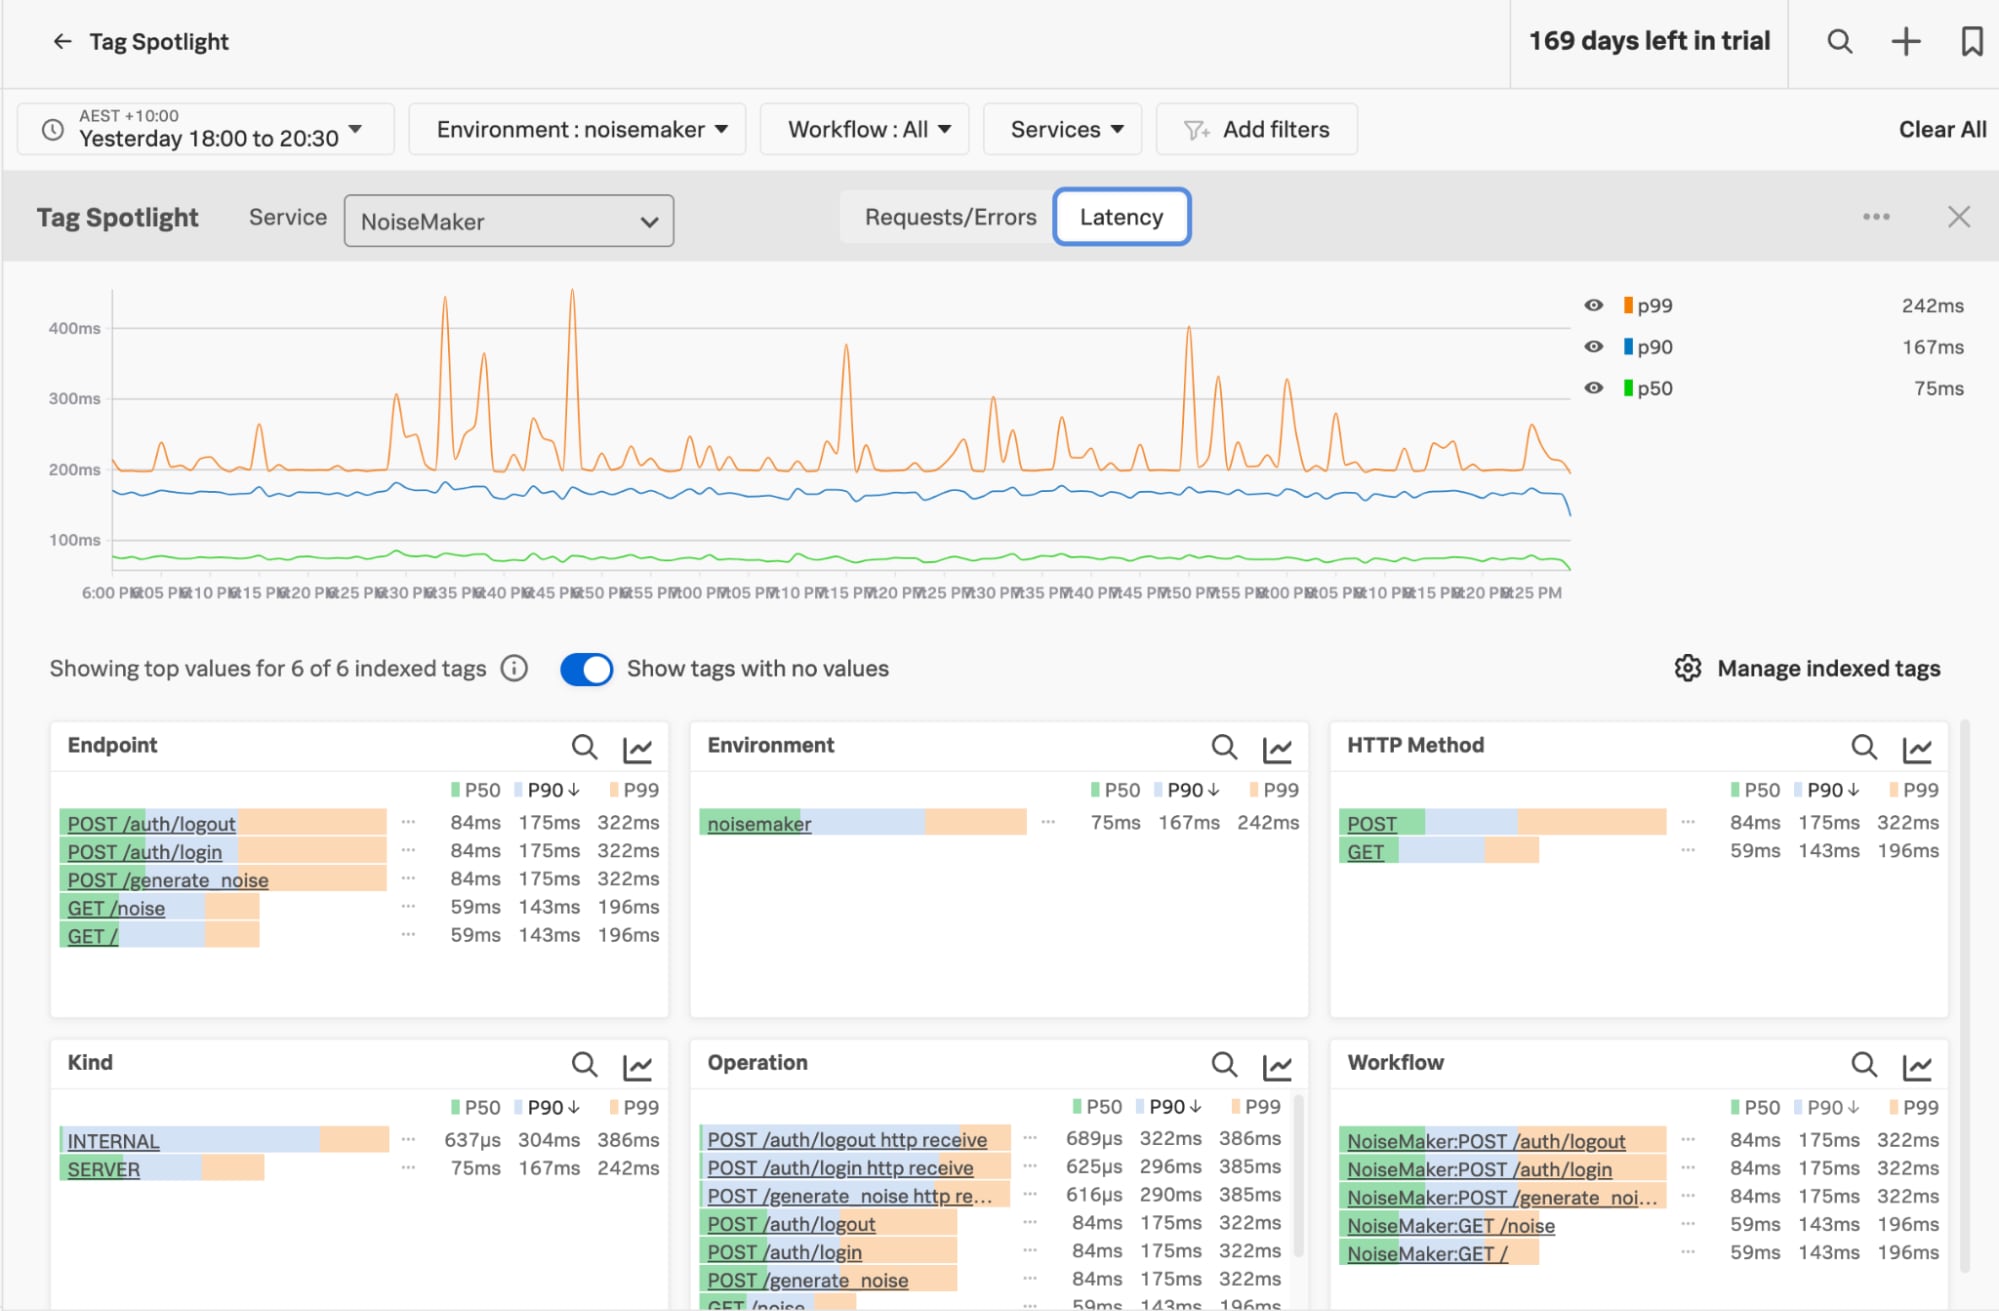
The Tag Spotlight view is a great start for breaking down data by the most common tags/values and showing where we have data, allowing us to dig in further as we need.
This is the view for a single service in a single environment, but you can expand the context to show everything across your organisation, or filter based on attributes as fine-grained as a single URL endpoint and HTTP method. The information is based on the attributes included in your telemetry data, and thanks to the OpenTelemetry standards, they’re consistent across services.
At the moment we’re looking at the latency statistics for the service, where P50, P90 and P99 annotations are the percentiles for each measurement. A latency of 75ms P50 means at least 50% of events happened in equal to, or under 75ms; our P99 is 242ms, so 99% of connections happened in =<242ms. There are outliers that could be related to load or other factors, but they allow for an overall understanding of how the system performs.

The overall view of our service in the Tag Spotlight
When we filter by just the POST events to the login endpoint and look at requests vs errors, we find 3.5 million events with no errors. Nice, but rather unlikely!

Errors for POSTs to the /auth/login workflow.
When we want to collect everything, the “endpoints” view lists all of the identified endpoints of this service. If there are URLs like “/view/product/{product_id}”, where the “product_id” is a variable value, they are rolled up into a set that you can dig into if need be.
Response timings and error rates are part of the usual operational monitoring of these kinds of services, and they are easy to identify; there are a cornucopia of alerting and monitoring capabilities in the detectors and service level objectives (SLOs) part of Splunk Observability Cloud.

The “Endpoints” view for our NoiseMaker service, showing URLs, HTTP methods and related statistics.
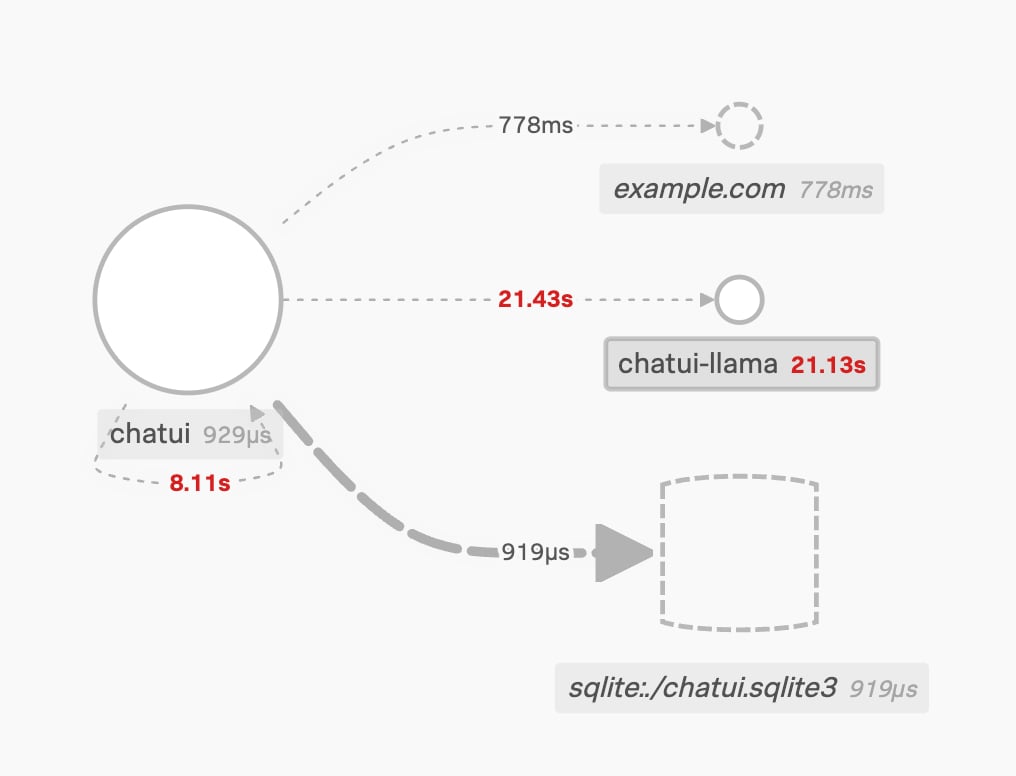
Downstream and external services can be identified in the service maps. In this case, the “chatui” service depends on:
- An SQLite database,
- Another service called “chaui-llama”, which we have telemetry from (solid circle)
- An external service “example.com”, which is inferred from our service telemetry
We probably want to understand why our service is contacting that service on “example.com” just to be sure! Mark it down for investigation (or possibly dig into it now, if it looks bad 🐿️). Look out for another blog in this series on how to find out where the connection is coming from, where we look at using application traces for security.

The service view. A database, a llama and example.com walk into a bar…
If infrastructure monitoring is configured, you’ll also find out what servers, container platforms, cloud environments and other services are involved.
The “gathering data” phase can take some time as there are plenty of places to cover, but that is why we’re here!
Data Dictionary
This is where you document the data you you have and what it looks like; the framework identifies four key points to include:
- Field names: The names or identifiers of the fields
- Description: A brief definition of each field and what they are used for
- Data types: What type of data each field contains (see below)
- Field values: How to interpret the values in each field. In other words, what do they mean?
Thankfully, a lot of this data is repeated across different services, especially if systems adhere to the OpenTelemetry standards - the benefit of unified standards!
Review Distributions
In this step, you’ll use descriptive statistics to summarise the values typically found in each of the key fields in your data dictionary. For example, you might compute:
- The average and/or median of numeric values
- The top most common categorical values
- The number of unique values found in that field (AKA the cardinality)
In this phase, you’re beginning to define “normal” behaviour, or at least what is happening at the moment. It is possible that the environment is already under attack or compromised, so don’t assume that “normal” for now is A-OK!
Again, things like service level views or tag views will show you the detail you need and distributions over varying timeframes.

The request rate is (mostly) stable.
Investigate Outliers
After identifying outliers, you’ll want to investigate each one to determine whether they represent security issues or are just benign oddities. It is advisable to seek out correlations or connections between various events or anomalies to uncover any underlying trends or potential security risks.
Gap Analysis
As with most projects involving data, especially new data you’ve never looked at before, things rarely go entirely smoothly. Gap analysis is where you identify challenges you ran into while hunting and, when possible, take action to either resolve or work around them.
Sometimes there is additional information that would be helpful to capture. If you need specific attributes like the user’s internal ID, this is something typically trivial to add, which helps both operations (“why is this user’s login flow broken?”) and security (“why is this user breaking the login flow?!”) in their tasks. There is even a standard naming, as part of the Enduser Attributes registry.
This step also includes validating and documenting whether all valuable fields and values are parsed and extracted correctly.
Identify Relationships
So far, we have looked at the data on a field-by-field basis, but it is important to understand that any non-trivial dataset is also likely to exhibit relationships between the values in different fields. These relationships can hold critical insights, often providing much more context about the event than you can get just by examining individual data points. A classic example is the count of user logins and how they relate to the time of day, with an increase expected during the start of the typical work shift.
Preserve the Hunt
Don't let your hard work disappear. Save your hunt data, including the tools and methods you used, so you can look back at it later or share it with other hunters. Many hunt teams use wiki pages to keep track of each hunt by:
- Adding links to the data and documenting how you collected it
- Outlining how they analysed it
- Summarising the important results
Often, hunters look back at previous hunts when they face similar situations in the future. Do yourself a favour and make sure to document your hunting process. Your future self and teammates will thank you.
Document Baseline
Your baseline consists of the data dictionary, statistical descriptions, and field relationships. Even if you took good notes during the "Execute" stage, it is important to turn those notes into a document that others can understand. Good baseline documentation can be a foundation for helping discover or create other hunts, like hypothesis-driven or model-assisted efforts!
Almost any large dataset will have suspicious-looking but benign anomalies. Don't forget to include a list of these known-benign outliers! Documenting outliers you already identified and investigated during the “investigate outliers” phase will save time during future hunts and incident investigations.
(Make the most of each investigation with these postmortem best practices.)
Create Detections
Since you now have some idea about what “normal” looks like in your data, and you probably also have a little experience investigating some of the outliers, you may be able to distil all of this into some automated detections. Examine each of your key fields or common relationships you identified between fields to see if there are certain values or thresholds that would indicate malicious behaviour. If so, consider creating rules to automatically generate alerts for these situations.
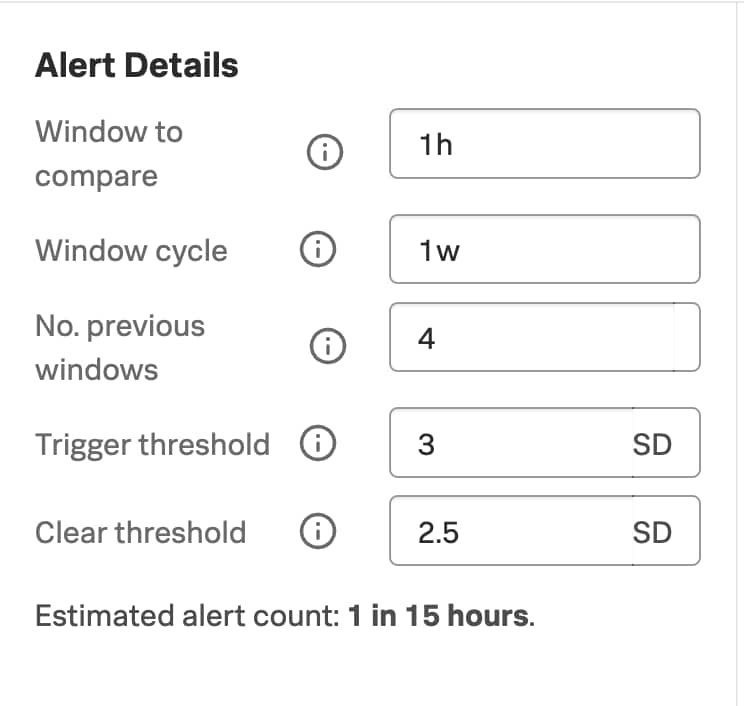
As an example, you could configure an Application Performance Monitoring (APM) detector that triggers when the request rate for the login endpoint goes three standard deviations outside the “normal”. Splunk Observability Cloud already builds the baselines for these metrics, allowing you to leverage simple thresholds to start with.

Configuration options for the APM detector.
In this case, we’re telling the APM detector to look at every hour and compare it to the same time over the last four weeks; if the results are more than three times the standard deviation, tell us. Three times the standard deviation is a fairly standard starting point for an “outlier” test, as it catches far-outliers in a normal distribution. As with all alerts, this needs periodic review and tuning, but it is a good starting point.

An example of configuring the monitor while a spike is happening.
Another option for alerting leverages the automatically generated service maps. Because we know all of the “current” downstream services the app uses during normal operations, if we see something that is not in that list, we can add a threat object to increase the risk score for risk-based alerting purposes.
Simply alerting on any abnormal behaviour is likely to cause a flood of low-quality alerts; the trick with alerting is to identify outliers that are most likely to signal malicious behaviour and work with your Operations teams, as they’ve likely got a lot of these alerts configured already or know how to tune for noise.
Also, even if anomalies aren’t good candidates for automated alerting, they may still be useful as reports or dashboard items that an analyst can manually review on a regular basis or even as a starting point for future hunts.
Communicate Findings
As with all types of hunts, baselines are most impactful only when you share them with relevant stakeholders to improve the overall security posture. In addition to sharing with the owners of the system you baselined, you’ll want to be sure that your SOC analysts, incident responders, and detection engineers are aware that the baseline exists and that they have easy access to it.
If your security team keeps a documentation wiki or other knowledge repository, that would be a great place to collect all of your baselines. You might also consider linking to the baselines from the playbooks that your SOC analysts use to triage alerts.
Conclusion
We’ve demonstrated how to build (or start to build) a baseline of your services, and gained insight into what is happening in your environment. Observability tools are a fantastic source of information for threat hunting, and the field name standardisation that OpenTelemetry introduces makes everyone’s lives easier.
I hope you’ve learnt something new, and that you collaborate with your friends in Operations Land to mine this rich data source for goodies!
As always, security at Splunk is a team effort. Credit to authors and collaborators: James Hodgkinson, David Bianco, Dr. Ryan Fetterman, Melanie Macari, Matthew Moore.
Related Articles
About Splunk
The world’s leading organizations rely on Splunk, a Cisco company, to continuously strengthen digital resilience with our unified security and observability platform, powered by industry-leading AI.
Our customers trust Splunk’s award-winning security and observability solutions to secure and improve the reliability of their complex digital environments, at any scale.


