Clara-fication: Data Onboarding Best Practices
Platform Clara MerrimanI think we can all agree that data is key when it comes to making decisions. As such, it would seem equally important to follow a set of standards when ingesting data into Splunk. These standards would ensure that logs are formatted properly and there is documentation available to understand details about the source data. While every company and use case is different, I’d like to share some of the standards and best practices the Splunk Security Center of Excellence follows. While no one needs to adopt any or all of these, I hope it serves as a guide to improve current data ingestion processes.
Consultations and Metadata
Before you can even begin to bring in data, it’s important to understand details about the data and what it is going to be used for. Internally at Splunk, the Security Center of Excellence requires a form to be filled out for every new data onboarding request. We will not triage a ticket until we have all of the necessary information.
Here are some of the questions we ask and why we ask them:

-
Information about the data
- What application/service/appliance is generating the data?
- What hosts are generating the data?
- What is the path to the data on the host?
- What format is the data in?
We ask the above questions to learn about the source of the data. - Please attach data samples to the JIRA ticket.
- What methods are available for sending the data to Splunk?
- Are any Splunk Technology Add-ons available?
We ask about methods to help determine the best way to bring data in. Much of this depends on data transformations and scalability. - Does any sensitive data need to be scrubbed prior to indexing?
- Does the data contain any PII or other potentially sensitive data? If yes, please describe.
- What Data Classification is this data?
- Who can have access to the data?
We need to know the above information to ensure we handle the data and data access properly.
-
Data storage
-
Is there an existing index this data should be sent to or is a new index requested or required?
-
For how long must this data be retained?
-
What is the earliest date from which the data should be ingested?
-
How often should data come into Splunk from the source?
All of this information is important, but can change at the discretion of the Splunk administrators, based on existing policies or needs. Many teams or companies will have standard naming conventions for indexes, default retentions, rules for when a new index should be created, etc. There are also possibilities to bring in data earlier than the onboarding date, as some add-ons have a start date and can bring in historical data.
Our team will create new indexes when one of five conditions are met:- Different access is needed for data. This might happen if some data has more sensitive information, such as medical or financial details.
- Different retention is needed for data. By default, our Splunk stack retains data for 13 months, but holds archived data for much longer, depending on requirements.
- Data is unrelated to existing indexes. Our team creates indexes based on tools, but other companies may create indexes based on projects, teams, or other criteria.
- Different environment types, such as staging versus production. We do this because production data would have a higher priority to fix if it were in outage, and by having it in its own index, we are easily able to alert on it.
- Exceedingly large bucket sizes causing search latency. With shorter retention times, this is less likely to happen, however it is possible if the data coming in is quite large or verbose.
-
-
Additional information
-
What is the use case(s) for this data? What do you intend to do with the data?
-
Who is the Data Owner?
-
The Data Owner ensures their data is correctly classified and handled in accordance with internal policies. In our environment, the data owners are also responsible for approving and maintaining access for individuals.
-
Who is the subject matter expert on this data?
-
Does this data need to be monitored in case of an outage?
- Who needs to be notified if there is an outage on this data source?
- At what level should data be monitored? For instance, index, sourcetype, source, or host.
- What method should be used to send the alert? This might include things like Email, Splunk On-Call, or a messaging platform.
-
What is the impact and urgency if a data outage occurs?
-
-
How we triage tickets
- When a ticket is filed, the questionnaire is reviewed to ensure that all necessary information has been provided.
- Each data onboarding request ticket has automation applied to add acceptance criteria, both in the description of the ticket as well as in a form with checkboxes that each requirement was met, as well as a comment to the requestor to fill out the questionnaire informing us of all of the details of the request.
- If anything is missing on the questionnaire, we will reach out to the requestor to provide that information.
- If necessary, we will meet with the requestor to understand the request better, instead of communicating solely through text. Sometimes, a meeting is better and more efficient.
- Once it has been determined that all information has been provided and that this is a use case we support, we triage the ticket and an engineer will pick it up.
- Our team has documentation related to data onboarding policies, processes, and procedures. These documents outline what is and is not supported by our team.
- When a ticket is filed, the questionnaire is reviewed to ensure that all necessary information has been provided.
Process
When the request has been approved to work, we always start by sending data to our development environment. This helps ensure our production indexer cluster only contains validated data. Every aspect of the data ingestion will be tested and approved in the development environment before being promoted to production.
Things to Test While Configuring Data Ingestion
One thing all data ingestion teams should know is the Great 8. The Great 8 refers to configurations every data source should have defined. All of these configurations play a crucial role in parsing data. Defining these settings with specific rules, instead of generic and default rules, should result in improved performance.
These configurations will be set in props.conf and are known as the following:
-
SHOULD_LINEMERGE
- This setting controls how Splunk processes multiline events. When set to true (the default), Splunk combines multiple lines into a single event until a breaking rule is met, such as
BREAK_ONLY_BEFORE. Setting this to true provides flexibility but may negatively impact performance. When set to false, each line is treated as a separate event, based onLINE_BREAKER.
- This setting controls how Splunk processes multiline events. When set to true (the default), Splunk combines multiple lines into a single event until a breaking rule is met, such as
-
LINE_BREAKER
- This uses a regular expression to break data up into individual events. The default is every new line will be a new event (
([\r\n]+)), however this setting is very flexible. - Using
LINE_BREAKERwithSHOULD_LINEMERGE = falsecan combine multiline events efficiently.
- This uses a regular expression to break data up into individual events. The default is every new line will be a new event (
-
EVENT_BREAKER_ENABLE
- This setting only applies to universal forwarders. It should be used to indicate that events should be distributed evenly across the indexer cluster. This is especially helpful with large data. The default for this setting is false, however true is commonly used with an appropriate
EVENT_BREAKER.
- This setting only applies to universal forwarders. It should be used to indicate that events should be distributed evenly across the indexer cluster. This is especially helpful with large data. The default for this setting is false, however true is commonly used with an appropriate
-
EVENT_BREAKER
- Another setting based on regular expressions! Also strictly for use on universal forwarders when
EVENT_BREAKER_ENABLEis true, this setting defines how to break an event up when sending to the indexers. Using capture groups, the first group marks the end of the event, thus allowing the forwarder to distribute to another indexer, if needed, at the start of the next event. Typically, this setting will matchLINE_BREAKER.
- Another setting based on regular expressions! Also strictly for use on universal forwarders when
-
TRUNCATE
- This is the maximum length, in bytes, that an event is allowed to be. If an event goes over this length, the additional text is cut off. The default value is 10000, which is a reasonably safe value. It is generally safe to set this to a higher value, if needed, as some data may have much longer events, such as stack traces. Setting this to 0, however, is not normally advised, since it would pass an unlimited amount of text through each event. If this setting is being increased often, it could indicate poor data quality and may benefit from breaking the data into smaller events. Extremely large events may increase the risk of browser issues or Splunk not displaying the results. As a note, if
SHOULD_LINEMERGEis set to false and multi-line events are coming through into one Splunk event, the truncation limit will apply to the entire event, not each line within the event. This makes it much easier to hit the truncation limit.
- This is the maximum length, in bytes, that an event is allowed to be. If an event goes over this length, the additional text is cut off. The default value is 10000, which is a reasonably safe value. It is generally safe to set this to a higher value, if needed, as some data may have much longer events, such as stack traces. Setting this to 0, however, is not normally advised, since it would pass an unlimited amount of text through each event. If this setting is being increased often, it could indicate poor data quality and may benefit from breaking the data into smaller events. Extremely large events may increase the risk of browser issues or Splunk not displaying the results. As a note, if
-
TIME_PREFIX
- Also using regular expressions, this setting is used to find any text preceding a timestamp the data should use for
_time. This defaults to an empty string and the first timestamp found will be extracted.
- Also using regular expressions, this setting is used to find any text preceding a timestamp the data should use for
-
MAX_TIMESTAMP_LOOKAHEAD
- A numerical setting that indicates how many characters the extracted timestamp is. If
TIME_PREFIXis not set, this will be the number of characters from the beginning of the line. IfTIME_PREFIXis set, it is the number of characters from the end of the matching regular expression. This defaults to 128 characters.
- A numerical setting that indicates how many characters the extracted timestamp is. If
-
TIME_FORMAT
- If the data has time in human-readable format, use this setting to define the format using time variables so that Splunk can extract the timestamp as an epoch value. This defaults to empty, so if the data timestamp is already in epoch, this setting is not needed.
-
TZ
- This configuration is not part of the Great 8, but I wanted to mention it here, since it can be very useful for manually setting the right timezone in events. This should be used when the event timestamp does not include a timezone or if the forwarder does not have the right timezone set. If configured, Splunk uses the defined timezone, taking precedence over the forwarder's timezone. When this is not configured, it defaults to the forwarder's timezone.
Other things to check and configure:
-
Data parsing (in addition to the Great 8)
-
Is the host name properly set? By default, Splunk forwarders use either the IP address or machine host name. There may be a reason to change the host name, such as when data flowing through syslog. Default host names can be set in the system/local/inputs.conf file, but props.conf and transforms.conf may also be used to set the host name based on event data.
-
What format is the data in? Using KV_MODE or INDEXED_EXTRACTIONS, for instance, can help parse JSON or XML data types. Note that both of those settings should not be set for the same sourcetype.
- Generally speaking,
KV_MODEis a better option thanINDEXED_EXTRACTIONS, sinceINDEXED_EXTRACTIONSwill use more disk space. Only use it when field(s) are needed to be parsed at index time, such as if the data will be used intstatssearches. - Also worth mentioning is that
KV_MODE=jsonwill limit the parsing - from what I can tell, this limit is set at 10240 characters by default and is under the[kv]stanza in limits.conf using themaxcharssetting. - In short, if there are ever any problems with field extractions not extracting all data, here are some settings to investigate:
- maxchars - Splunk will process field extractions for a single event up to this defined character limit. If an event exceeds this limit, field extractions will stop processing for any text after the maximum number of characters. This setting can help with performance by limiting how much text to process on exceedingly large events.
- limit - This is also found under the
[kv]stanza and is used to define how many fields will be extracted and available with the field picker. By default, it will only extract 100 fields, so can be set higher, or to 0, if more or all fields should be extracted, just remember it may come with performance concerns. - extraction_cutoff - This sets a limit, in bytes, for extracting fields up until the limit is hit. It is set in the
[spath]stanza and applies both to the spath command and auto kv extractions, defaulting to 5000 bytes.
As a note, if auto kv is not working and it seems impossible to figure out the limit settings, the fallback would be to use the spath command in the search bar. The limits set under this stanza will still apply, however.
- Generally speaking,
-
-
Configure or update knowledge objects
- Common Information Model (CIM) is vital for normalizing data across different source types. This is a standalone app that can be installed on the Splunk environment and contains many preconfigured data models. When bringing in new data, it is helpful to align to the CIM as much as possible for field names, tagging, etc.
- Macros are key. Setting macros for indexes can greatly help in the case of sourcetype changes, index changes, etc., as the configuration only needs to be changed in the macro instead of in every single knowledge object it is used in. Macros are heavily used in Data Models, so ensuring those macros are updated with any new and relevant indexes is important.
- Event types and tags also play an important role in Data Models and CIM. Setting these can help normalize new indexes.
Post-Data Ingestion Checks
-
Documentation
- All data should have a data flow diagram, displaying all of the components data passes through, including, but not limited to, host names, transfer protocols, and credential information. Data flow diagrams are incredibly useful when there is an issue with the data, to understand where it could have failed.
- It is important to create runbooks and other supporting documentation, linking the data flow diagram, to expand how to handle situations such as credential rotations, error message remediations, data information collected from the consultation, and any useful information around settings and configurations.

-
Monitoring
- We monitor for data outages using a static lookup containing relevant information. The lookup contains information around what index, sourcetype, source, or host is being monitored, at what frequency the data is expected to come in, and who to contact if there is any issue. Other fields within the lookup include a filter to exclude certain time windows, such as if data never comes in on weekends or if there is a recurring maintenance window. It also includes priority level to remediate the outage and confidentiality level of the data.
- We trigger an alert for potential data outage if data hasn’t been indexed within the expected frequency.
- We can also monitor for spikes or dips in eventcount, in addition to the full data outage, as well as latency issues, if data is still coming in but the delta between indextime and the timestamp is increasing.
- Alerts are sent through SOAR to determine if the outage is an upstream issue or a local issue. The findings from SOAR will page the point of contact for the data if it is an upstream issue (credential expiration, for instance) or the Splunk administration team if it is a Splunk related problem (file path change, for instance). Alerts also include a runbook on previously known issues and remediation steps to follow.
-
Access
- While I do not plan on going into RBAC best practices in this already lengthy blog, it is pertinent to have users validate that they have access and that it is granted in accordance with any policies.
- Data owner(s) should also verify that data looks correct and sign off that the request has been successfully completed.
How to Scale All of This
One of the most important things people can do when it comes to data onboarding is to be able to support all of the requests. If there are requests coming into your queue frequently enough, being efficient in the process is a must, otherwise the backlog will keep growing.
There are a few things that we do internally to improve our operational efficiency when it comes to data ingestion. Some of these may or may not be a good fit for your organization, but we have found that this works well for us.
- Create a props.conf template to be used with all data onboarding that will include, at a minimum, the Great 8 configurations. Having a template will reduce the time it takes to create the file, plus ensure that none of the configurations are skipped.
The Great 8 default configurations we use are:
SHOULD_LINEMERGE = False
LINEBREAKER = ([\r\n]+)
EVENT_BREAKER_ENABLE = True
EVENT_BREAKER = ([\r\n]+)
TRUNCATE = 10000
TIME_PREFIX = ^
MAX_TIMESTAMP_LOOKAHEAD = 35
TIME_FORMAT = %F %T.%3N %:z
We do customize many of these for a lot of our inputs, especially the time options, but this does give us a good starting place.
- In the case of custom scripts, whether within an application on a forwarder or sent through the HTTP Event Collector (HEC), create a standard logging format. For instance, our team has created our own Python SDK used in all HEC ingestion. This SDK creates standard logging, making troubleshooting much easier regardless of the dataset, plus makes it much more efficient to create scripts, as the SDK provides the foundation.
- Automate where possible. If your team has the skills to automate any part of the data onboarding process, it should be done. It can be a lot of upfront work, but will reduce the time spent on requests moving forward as well as reducing the risk of human error.
- Prepare a questionnaire for all data requests that will include all of the questions they’ll be asked in order to provide all of the necessary details. The questions provided under the Consultations and Metadata can be used as a guide. Having questions asked up front with example answers will help reduce the amount of back-and-fourth discussions.
Final Thoughts
Getting data into your Splunk environment is one of the most important things to get right. As the Splunk Security Center of Excellence, we are committed to build out efficient, scalable, and secure solutions to our services and share our findings with our customers and users. While we understand our solutions may not be the best solution for every use case, we hope that our experience is able to spark new ideas and designs to create or improve your own processes.
Related Articles
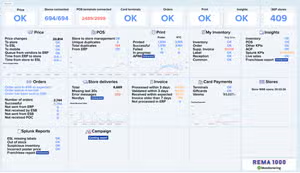
How REMA 1000 Stays Ahead: Innovative Retail Solutions Powered by Splunk

Clara-fication: Data Onboarding Best Practices