Dashboard Studio: How to Configure Show/Hide and Token Eval in Dashboard Studio

You may be familiar with manipulating tokens via `eval` or `condition`, or showing and hiding panels via `depends` in Classic (SimpleXML) dashboards, and wondering how to do that in Dashboard Studio. In this blog post, we'll break down how to accomplish these use cases in Dashboard Studio, using the same examples that were shown at .conf23.
One thing to note is that we're continuing to improve the experience and functionality of Dashboard Studio, so the tips provided in this blog are ideal for Splunk Cloud Platform 9.0.2303 and Splunk Enterprise 9.1. Let's dive in!
Using Tokens to Conditionally Show/Hide Panels
With Splunk Cloud Platform 9.0.2303 and Splunk Enterprise 9.1, we introduced an initial version of conditionally visible panels in Dashboard Studio.
 While the initial version is designed for you to easily show/hide panels depending on data availability, it is already possible to take advantage of this logic and have your panels be dependent on tokens instead. You can achieve this in many different ways using SPL.
For example, this query below will only return results if the token named $metric$ resolves to Occupancy or *
index = occupancy
...
| head limit=100 ($metric|s$ = "Occupancy" OR $metric|s$ = "*" )
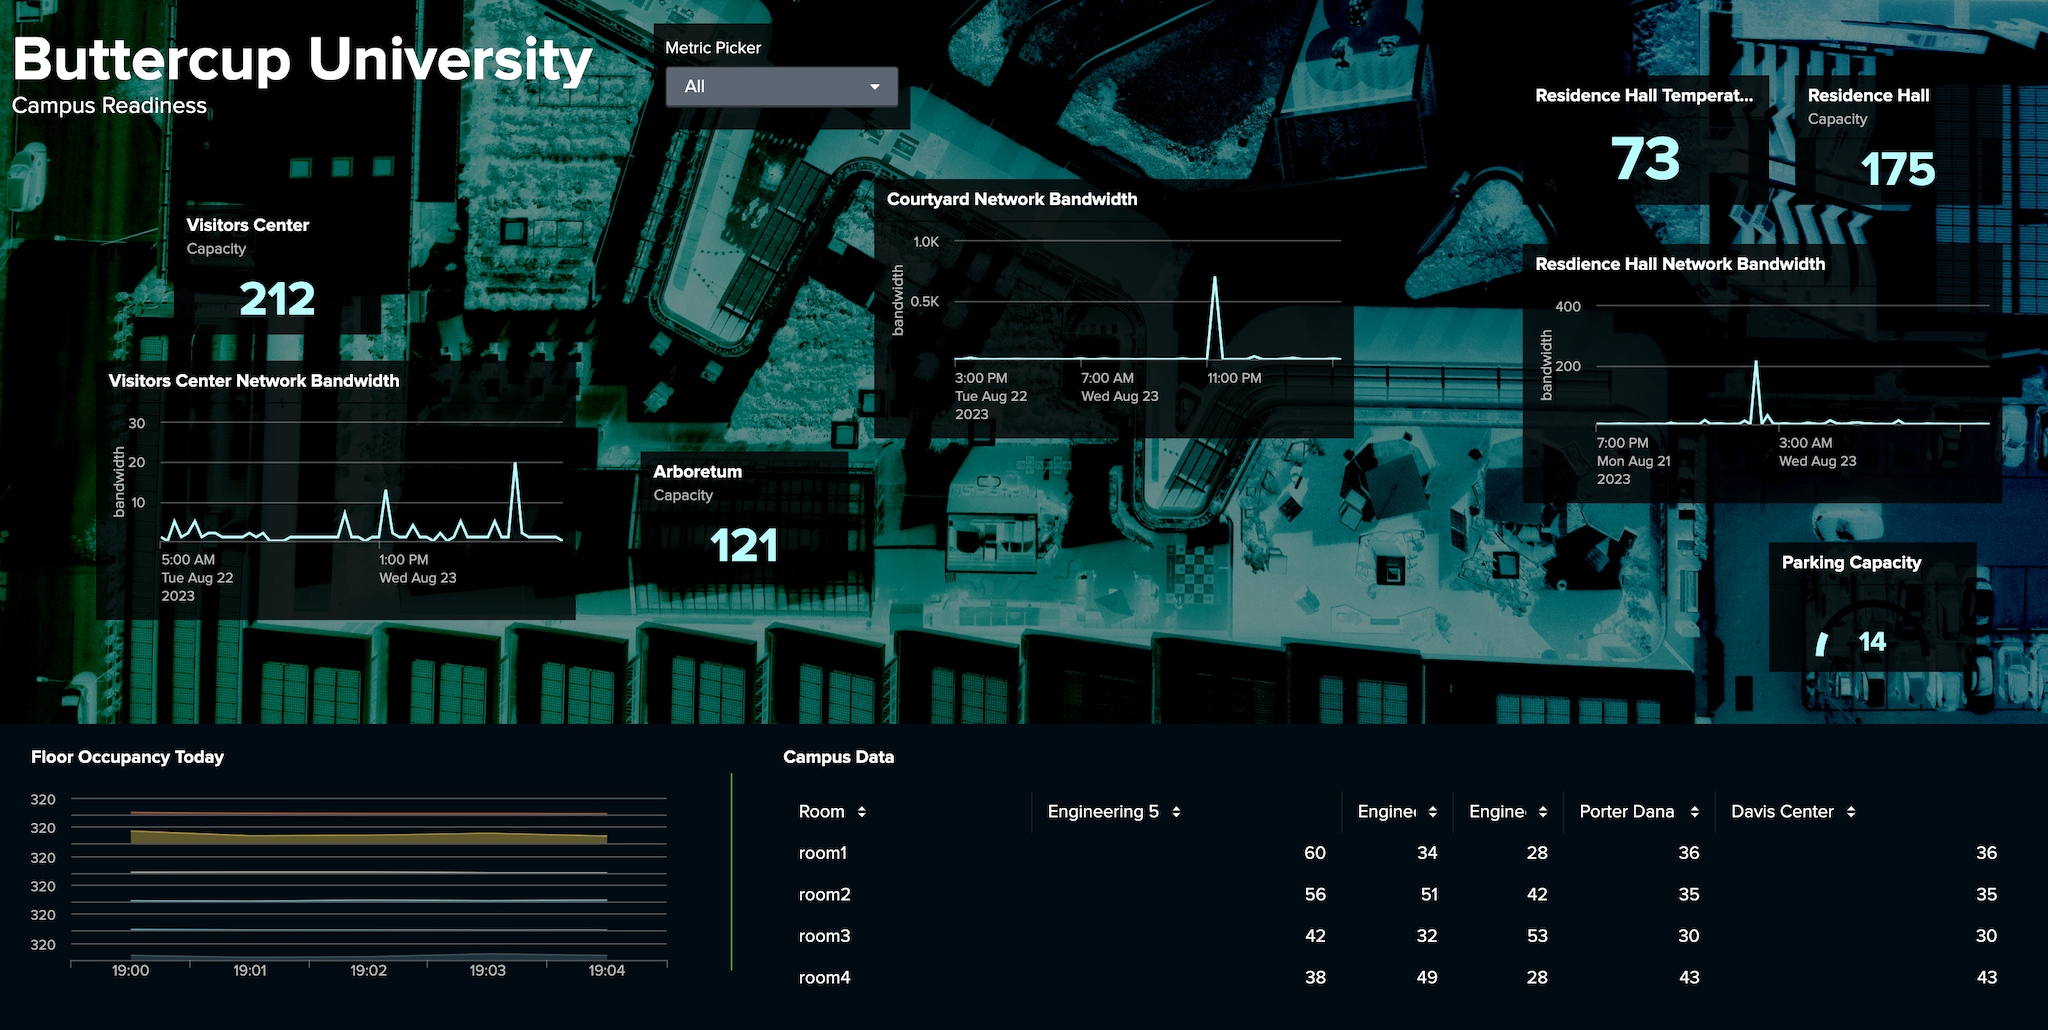
When this logic is used throughout your dashboard, you can start to create layouts which are responsive to the values of your tokens. In the example below, we can selectively view different metrics of Buttercup University at the pick of a dropdown.
 For an alternative example, the query below will only return results if the token named $detailsVisibility$ resolves to a value which exists in the conf23_workshop_orders index. All other values would yield 0 results returned for the query, thus hiding any panel this search powers.
index=conf23_workshop_orders status=purchased shipping_country=$countrySelected$ $detailsVisibility$ shipping_city=$citySelected$
| table _time order_id product count
The key to building conditionally visible panels is to have your search only return valid results when you want the panel to be visible. You can decide how to achieve that.
Evaluating Tokens
While we’re still working on a dedicated experience for token evaluation logic in Dashboard Studio, we’d like to show you a workaround that could unblock your most important eval use cases today.
Last year, we introduced the ability for you to reference search results directly as a token using the new syntax - $data source name:result.field$. This was designed to give you easy access to your search results, but it can be taken further to perform any evaluative function possible in SPL. In fact, you can create searches using a combination of makeresults and eval SPL commands that do nothing other than generate new tokens based on existing tokens or search results.
Take a look at this query for a data source called Over Capacity Evaluator
| makeresults
| eval office_outage_risk = case($office_count$ <= 1000, "low", $office_count$ >1000, "high")
| eval contingent_outage_risk = case($contingent_count$ <= 500, "low", $contingent$_count$ >500, "high")
| eval remote_outage_risk = case($remote_count$ <= 800, "low", $remote_count >800, "high")
| fields office_outage_risk contingent_outage_risk remote_outage_risk
In the above example 3 new tokens are generated, where each token represents a custom risk score:
- $Over Capacity Evaluator:result.office_outage_risk$
- $Over Capacity Evaluator:result.contingent_outage_risk$
- $Over Capacity Evaluator:result.remote_outage_risk$
These tokens are then ready to be used throughout the dashboard. In this example, these tokens are embedded in the descriptions of some single values so viewers can easily interpret the data.

Try This in Your Dashboard!
Now that you know how to eval tokens and apply conditional logic for controlling panel visibility, try this out in your Dashboard Studio dashboard! You can also check out additional examples in the Examples Hub under "Evaluate Tokens Using Search" and "Advanced Show/Hide".

Coming Soon
As we continue to make improvements to the experience and functionality of Dashboard Studio, these workflows may be streamlined, and these tips may no longer be necessary. Stay tuned for future enhancements such as:
- Conditional panel show/hide in Grid layout
- Ability to specify conditions for show/hide
- Ability to specify token eval logic
This blog was co-authored with Eason Gao
* This information is subject to change at any time, at the sole discretion of Splunk LLC and without notice. This roadmap information shall not be incorporated into any contract or other commitment. Splunk undertakes no obligation to either develop or deliver any product, features, or functionality described here.
Related Articles
About Splunk
The world’s leading organizations rely on Splunk, a Cisco company, to continuously strengthen digital resilience with our unified security and observability platform, powered by industry-leading AI.
Our customers trust Splunk’s award-winning security and observability solutions to secure and improve the reliability of their complex digital environments, at any scale.


