Tag: Opentelemetry
Latest Articles
displayMode
paginated
filter
tags
tags
Opentelemetry
showImagesOnMobile
false
limit
9

Observability
5 Minute Read
How Using Annotations with OpenTelemetry Can Lower Your MTTR
Understanding your workloads is important when troubleshooting. Learn how using annotations with OpenTelemetry can help lower your MTTR.

Observability
2 Minute Read
Having Trouble Getting the Right Insights From Your Cloud Network Monitoring? Preview Splunk NPM Today!
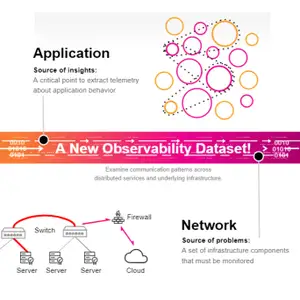
With Splunk Network Performance Monitoring (NPM) for the cloud, infrastructure SREs, developers and service owners can understand the impact of network behavior on application performance by observing ALL interactions between services, containers and zones in real time. There’s no need to change their application code and container images.

Observability
4 Minute Read
Announcing the Donation of the OpenTelemetry eBPF Collector
At Splunk, we’re strongly committed to making the OpenTelemetry project a powerful and complete framework for collecting, generating and exporting observability data. This is why we’re excited to announce the donation of an eBPF-based network telemetry data source, formerly called the Flowmill eBPF Collector, to the OpenTelemetry project.

.conf & .conf Go
2 Minute Read
DevOps at .conf21 Virtual: Adding Observability to Your Splunk Tool Belt
There are several key themes you’ll pick up on in the .conf21 DevOps Track breakouts — observability, monitoring cloud infrastructure, and application performance monitoring (APM) in all its forms. Read on to see some of our favorite tracks and some key sessions to prioritize if you've been looking at observability in your organization.
/en_us/blog/fragments/subscribe-footer