Observability Meets Security: Tracing that Connection
As outlined in a previous post, OpenTelemetry and Splunk Observability Cloud can provide great visibility when security teams investigate activity in modern environments. In this post, we look at another aspect of this visibility: how you can use traces to see directly into the workings of an application to find a potential threat.
Let’s imagine we’re the security analyst, and a message comes across from the Security Operations Center (SOC). They’re seeing outbound connections from the frontend of a new system to somewhere outside the network, and it shouldn’t be doing that.
When responding to incidents like this in the past, I’d be lucky if I got the original DNS information and firewall log showing the connection and had to work out what program was involved — if that was possible at all. Thankfully, the example application in our scenario was developed with OpenTelemetry in mind, so It’s just like having a debugger hooked into your production applications, all the time.
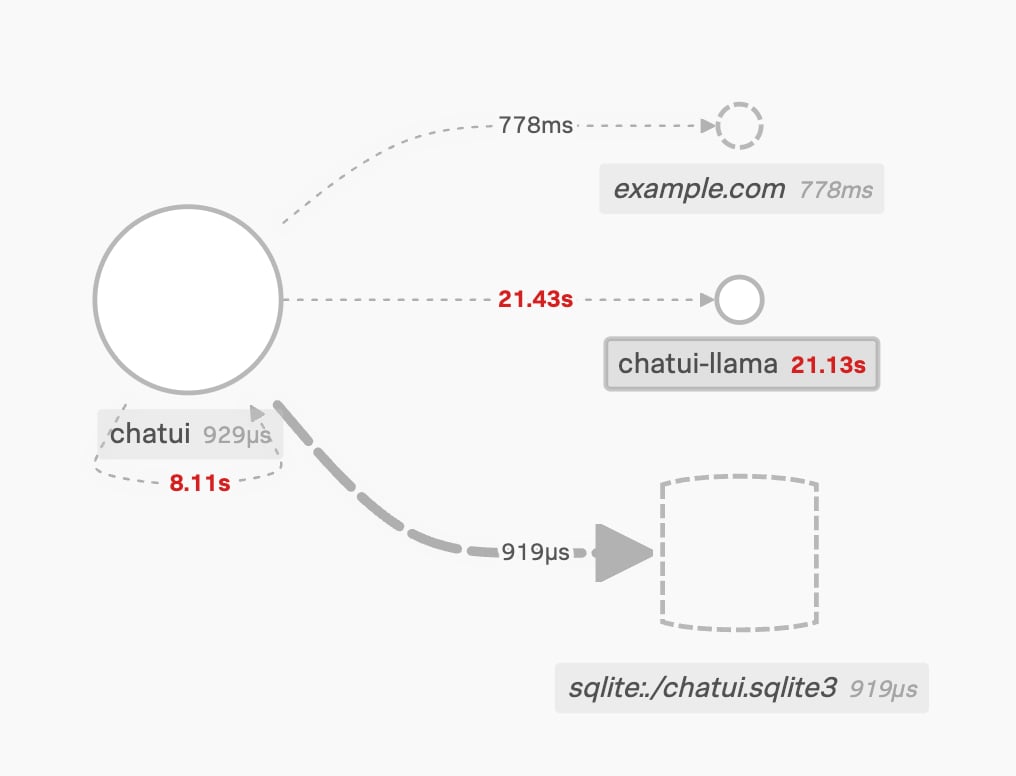
Here’s our hypothetical company’s new proof-of-concept LLM chat application, built as a minimal application with a frontend, backend, and an SQLite database. This is what the service map looks like on a normal day:
The frontend on the left connects to the “chatui-llama” service and a database.
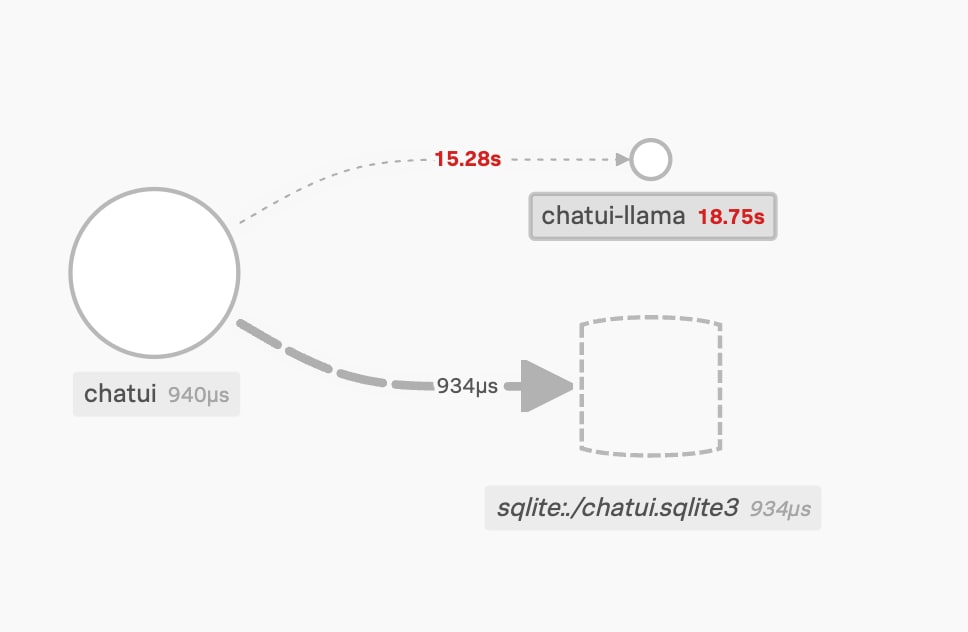
Below is how the service map looks in our scenario. Something in the frontend service is connecting to “example.com”.

The updated service map, with the new connection.
By clicking on the “example.com” service, we can see it’s an inferred service, so not something we’re getting telemetry back from. It’s outside our environment, or not currently instrumented.
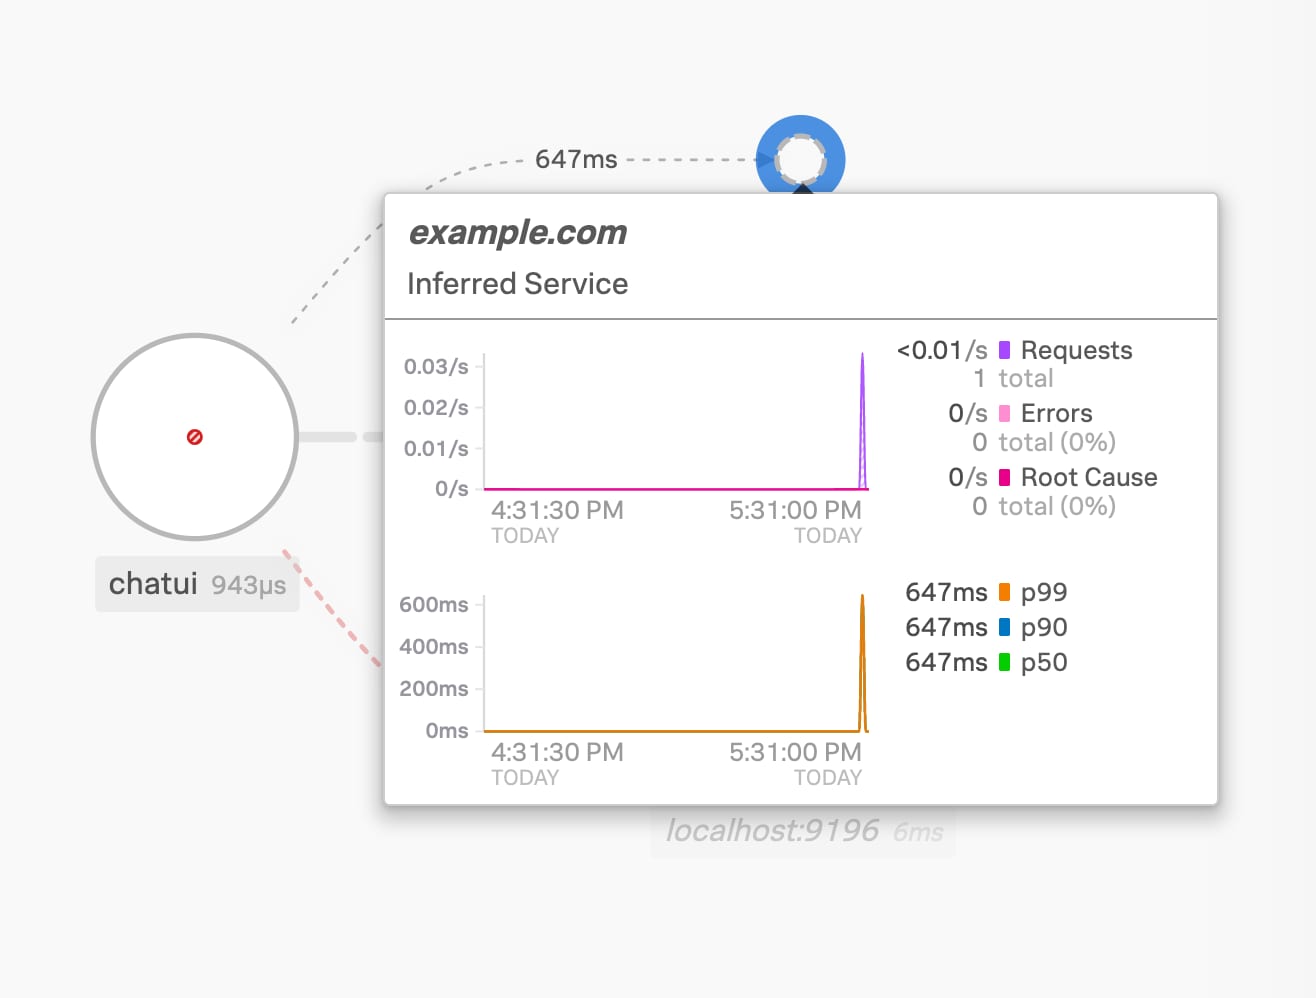
Details for the “example.com” service
A trace encapsulates the end-to-end workings of an activity; for example, if a user logs into the system, they’ll contact the frontend and it’ll connect to the database (to ensure the user exists), and both of those activities are included in the one trace.
Getting back to the investigation, we click through to the "Trace Analyzer" view for this service, where we can see individual traces that interacted with the “example.com” service. There’s been an error and a few successful operations in the last 15 minutes. The top half shows the stats, the bottom half allows us to choose an individual trace, filtering on different attributes such as workflows, services, or a variety of other features.
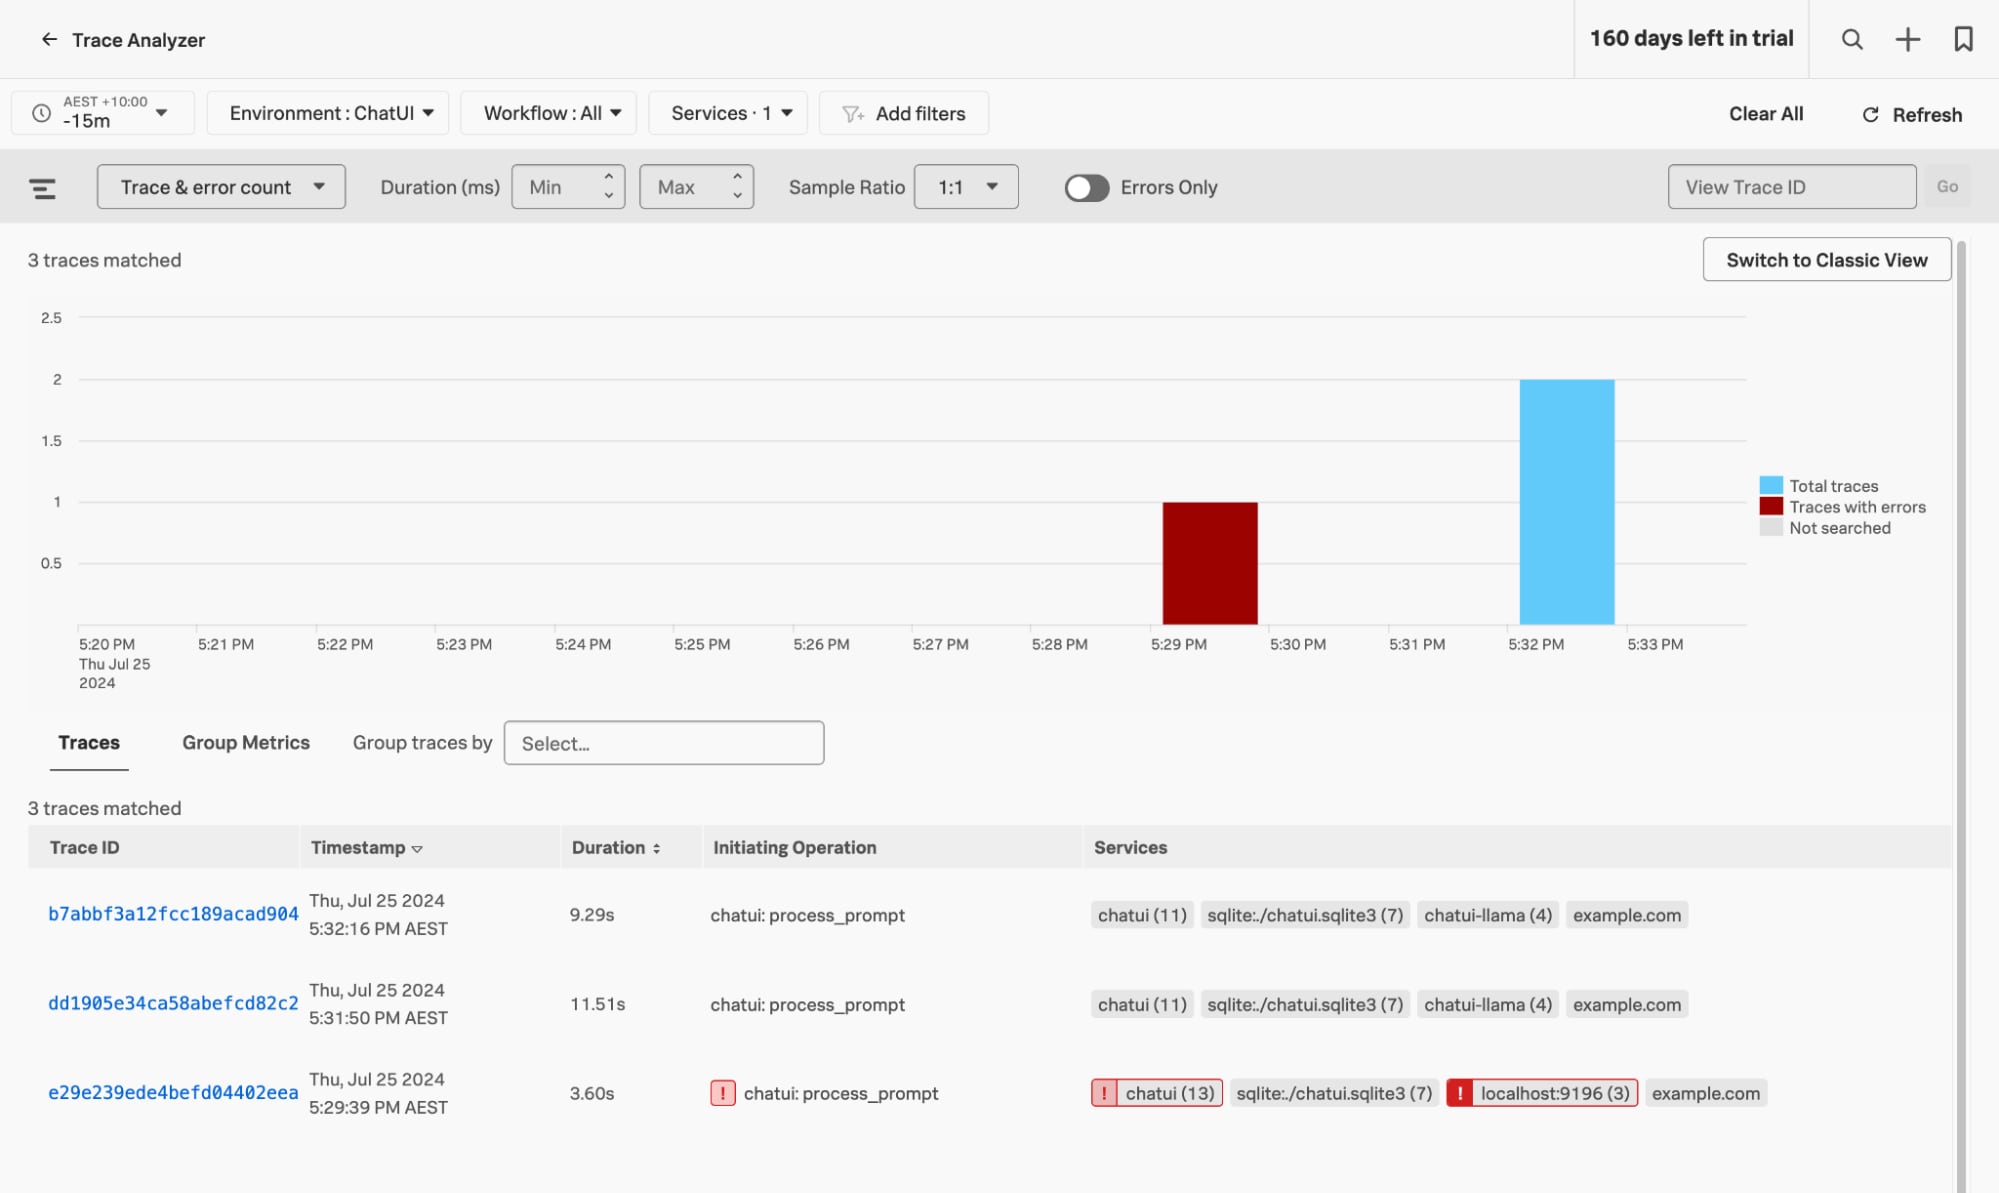
The “Trace Analyzer” view for the ChatUI environment
We can drill into the trace “Waterfall” view by clicking on one of the traces to see how the workflow progressed from start to finish with timings and, importantly, which services were involved. The workflow started in the “process_prompt” span, then did an UPDATE and two SELECT SQL commands on the database, then performed a HTTP GET request against “example.com”.
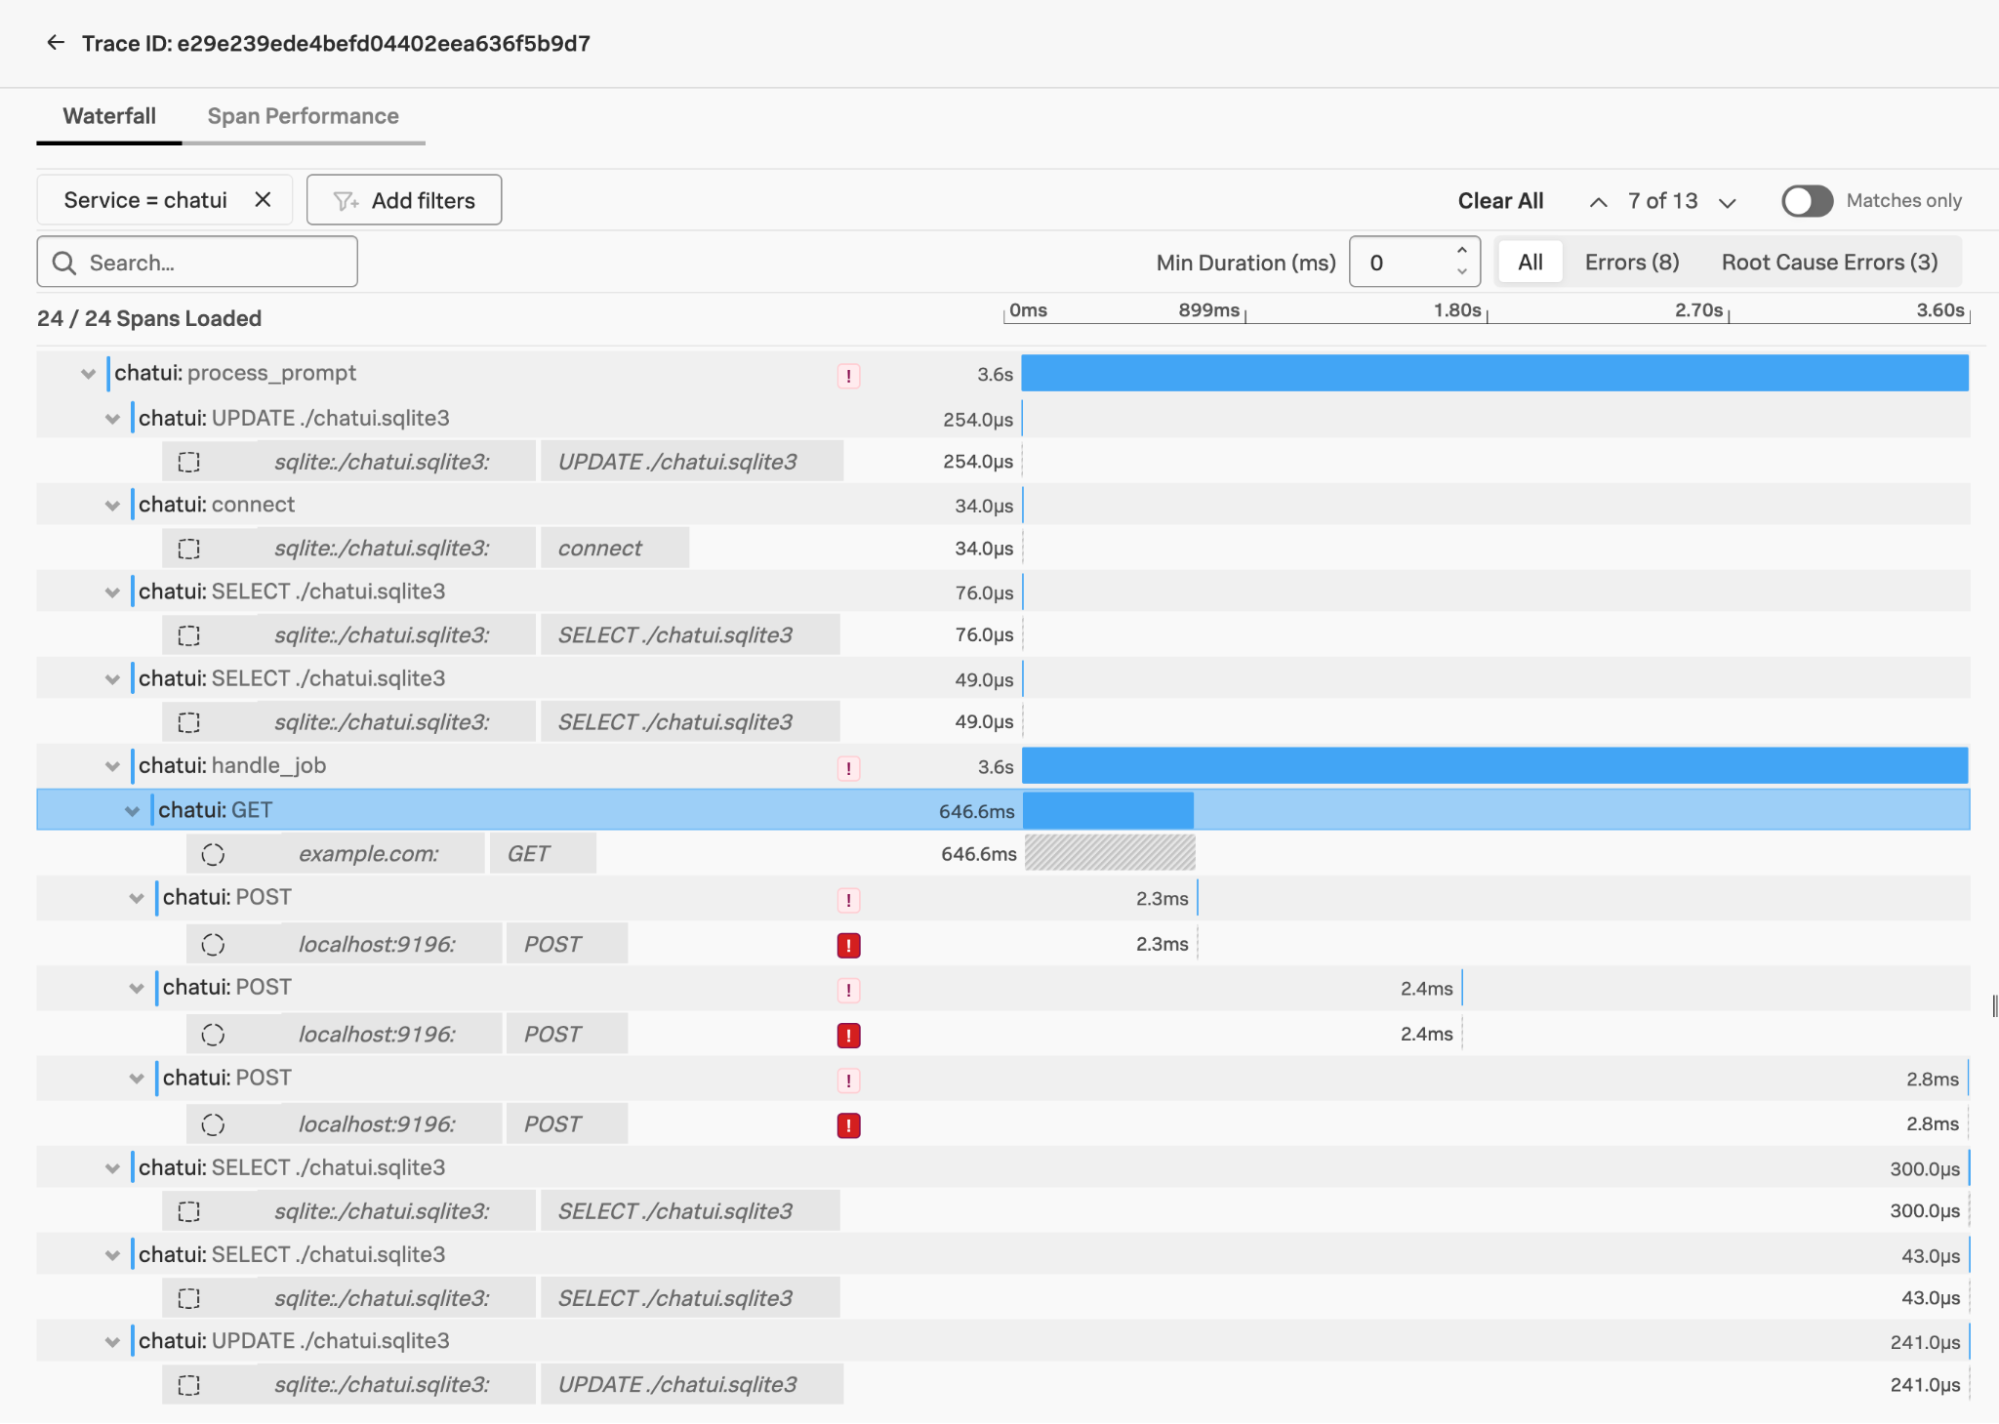
Waterfall view showing spans relating to the trace we are investigating
After the connection to “example.com”, there were some errors connecting to a service on localhost:9196; this is our “chatui-llama” service shown in the service map. We know it was down because we hadn’t started the container; if you select the failing connection (noted with a red exclamation mark above), more detail is shown below, including the full code-level exception information if you click the “Show More” link.
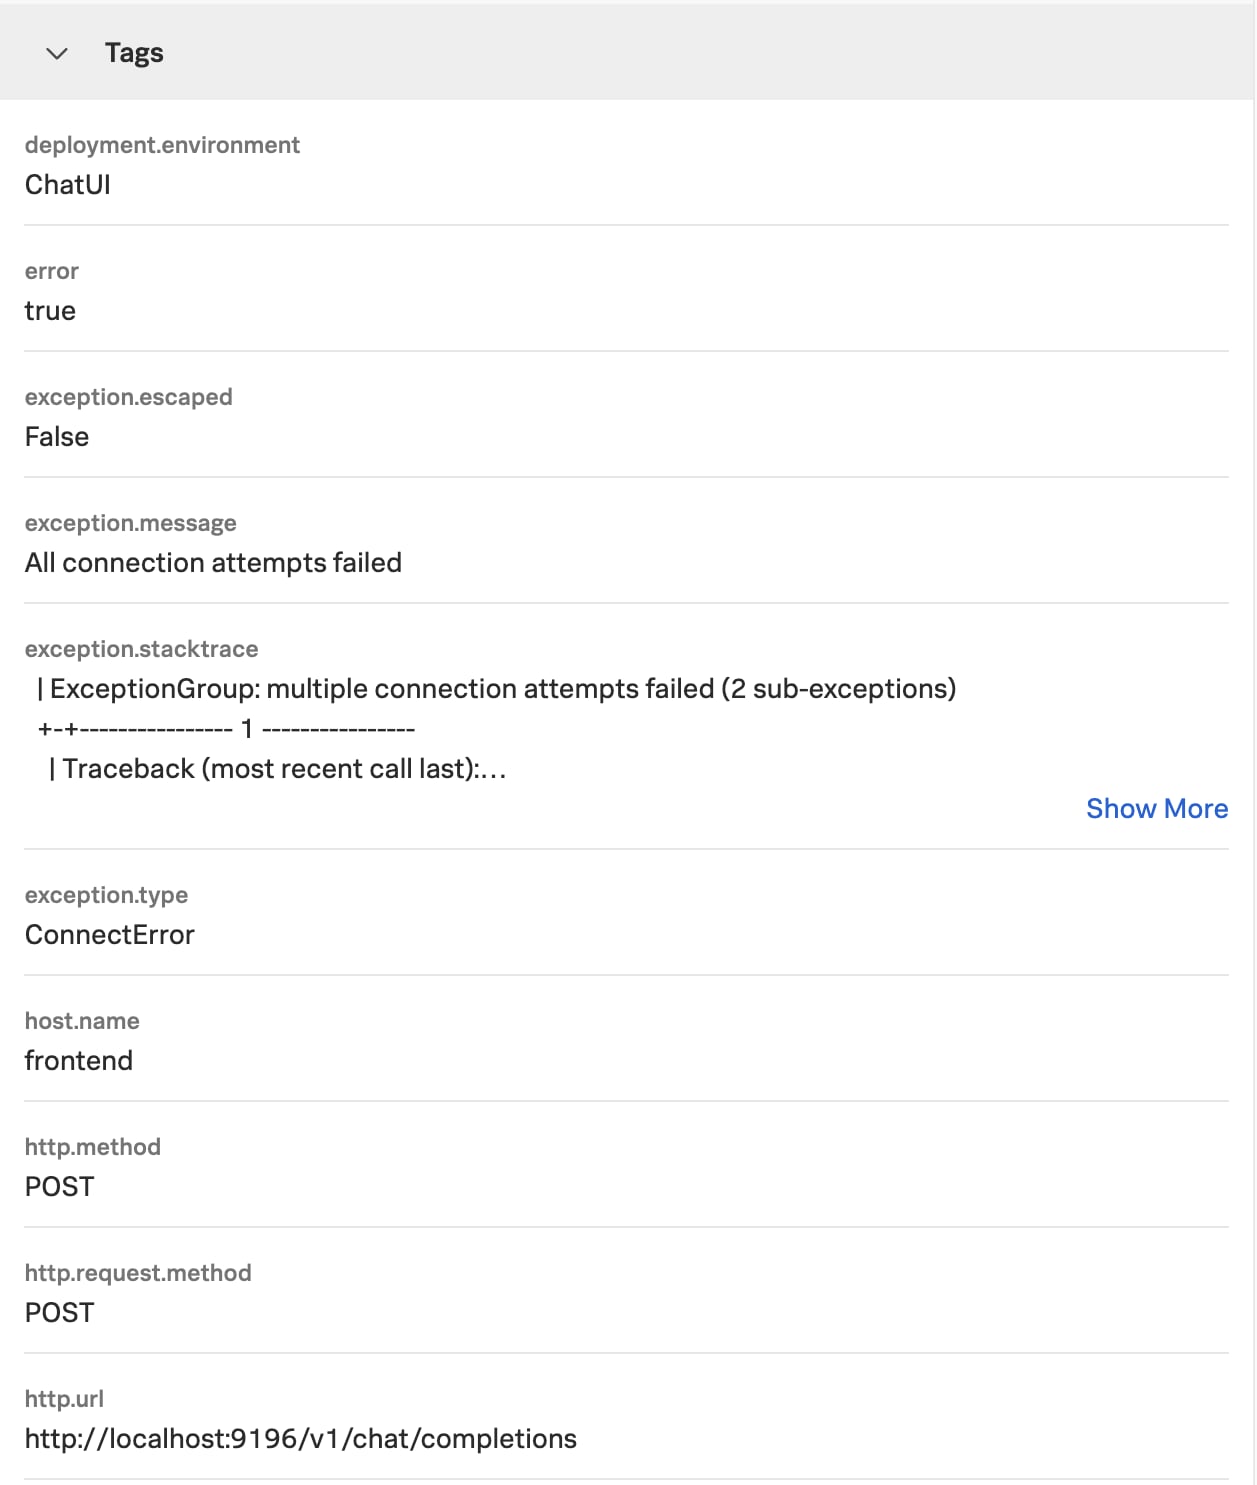
More information on the connection failures, shown in the “Trace Analyzer” view.
As a small side note, we can even see the contents of the SQL queries that were made during the workflow!
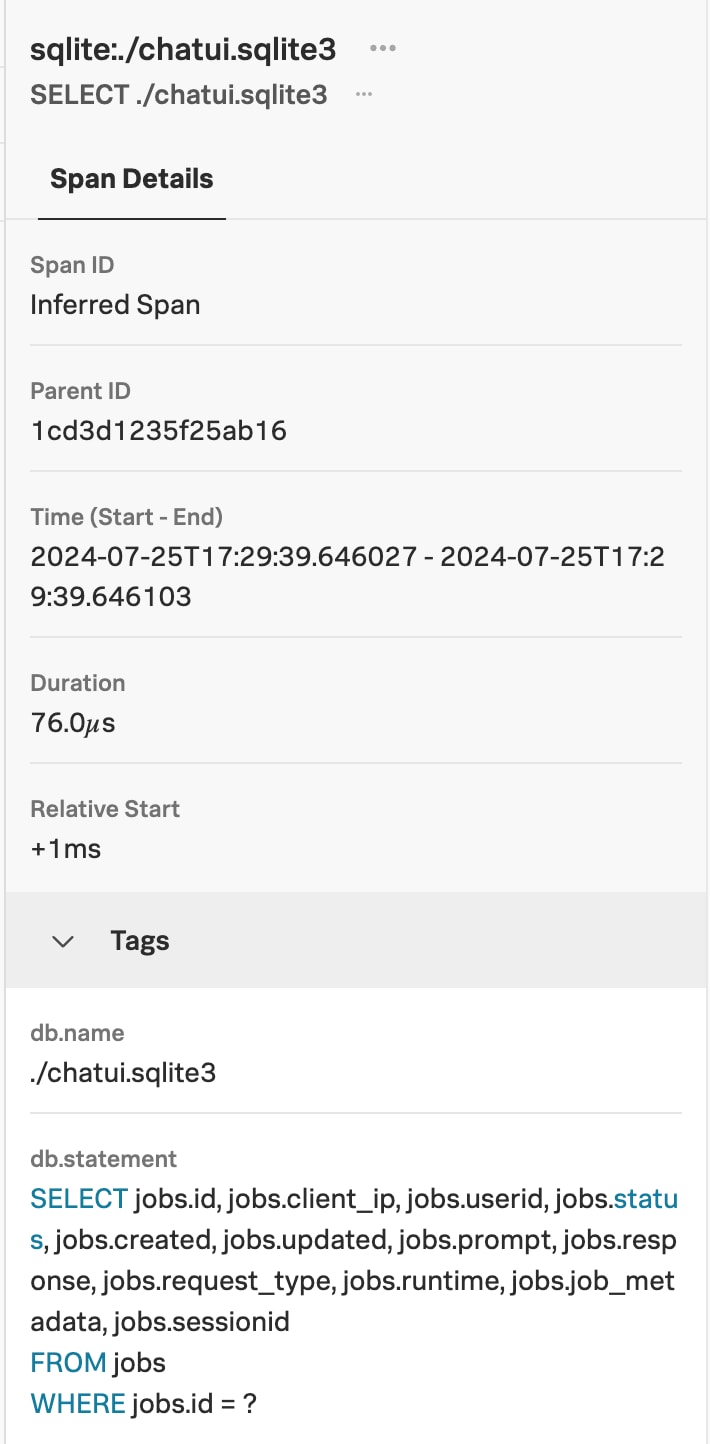 |  |
SQL query detail for the spans in this trace
Looking at the details for the connection to example.com, we see it’s part of the “handle_job” span, and it was a “GET” request to “https://example.com”. We can even see the software version and that the connection was made using httpx, a common Python library for making this kind of request.
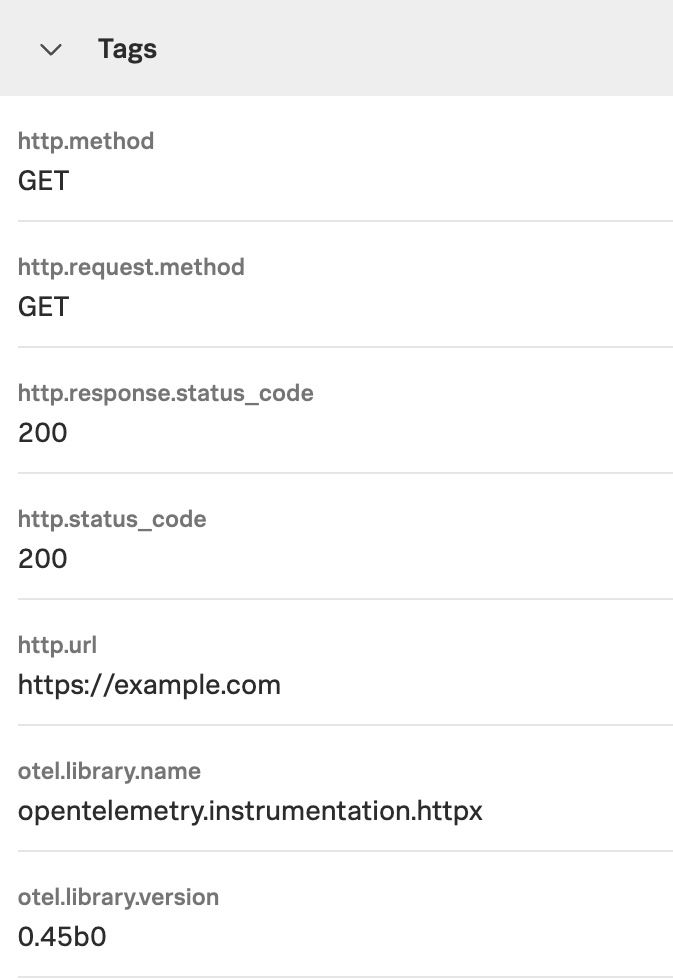
HTTP request detail
In this system, we’re using the httpx library as a dependency of the openai crate to connect to the backend service, which is supported by the auto-instrumentation toolkit. This means that any request is automatically tagged with the URL, method, status, metrics and a few other parameters, which makes for a lot of extra context on every request. The industry-standard packages like requests, urllib3 and aiohttp are covered as well, so if your Operations and DevOps teams are embracing observability practices, it’s likely that the environment will already be covered; alternatively it's quite easy to do so with zero-code instrumentation methods.
We have seen that the connection is coming from the “handle_job” span, and we’ve got access to the source code, so we can go straight there. This is a contrived example, so our “problem” isn’t exactly hidden: someone has added a configurable mode so that when the prompt includes the text “do bad things”, it makes a connection out. Now that we’ve quickly discovered the cause, we can move on to remediation; investigating who made the changes in version control and deploying correct code in production.
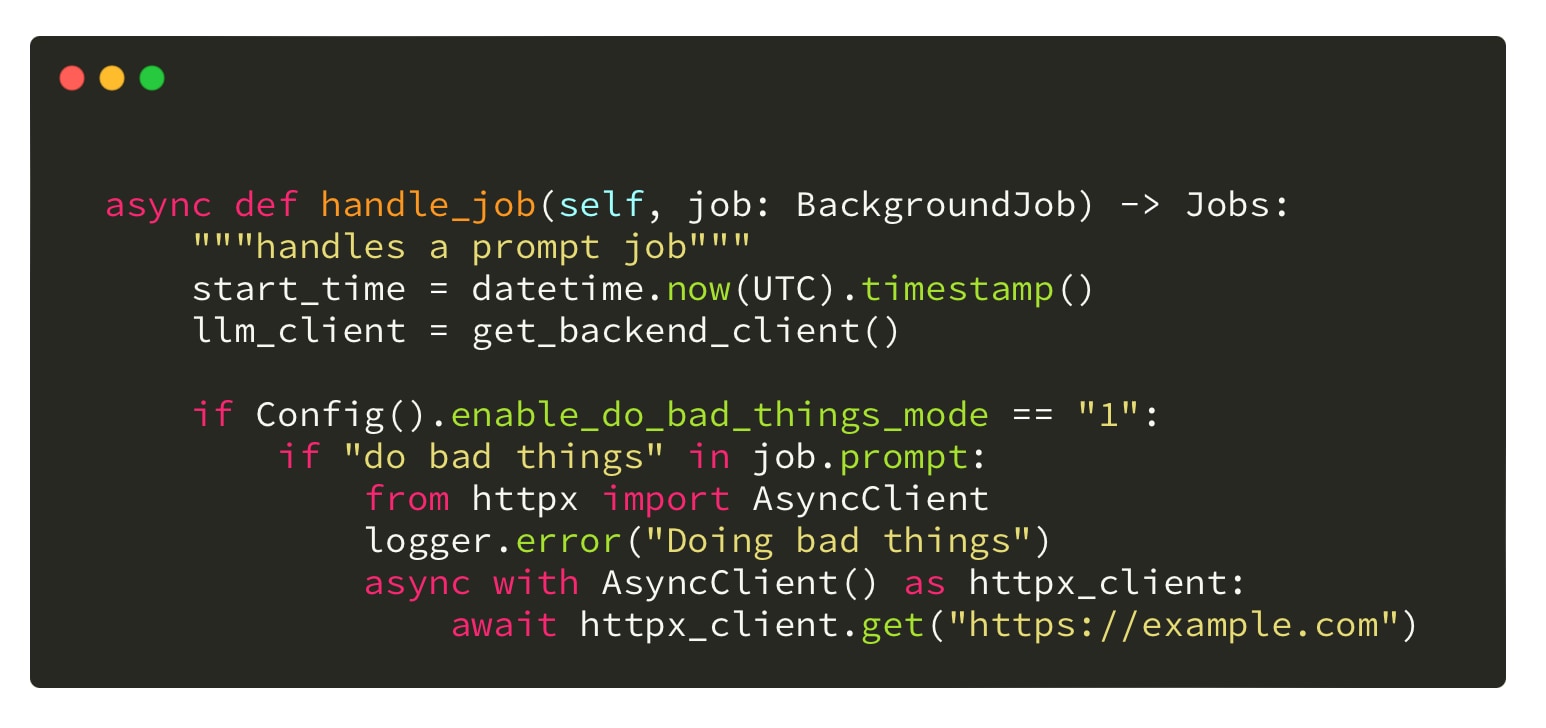
Source code for the application showing how the connection was made.
In conclusion, observability tools are a fantastic source of information for hunting in your environment. The visibility that they provide makes it easier than ever before to get to the answers you need — especially when compared to traditional hunting methods. I hope you’ve learned something new, and that you collaborate with your friends in Operations Land to mine this rich data source for goodies!
As always, security at Splunk is a team effort. Credit to authors and collaborators: James Hodgkinson, David Bianco, Dr. Ryan Fetterman, Melanie Macari, Matthew Moore.
Related Articles
About Splunk
The world’s leading organizations rely on Splunk, a Cisco company, to continuously strengthen digital resilience with our unified security and observability platform, powered by industry-leading AI.
Our customers trust Splunk’s award-winning security and observability solutions to secure and improve the reliability of their complex digital environments, at any scale.


