How To Get Complete Visibility of Your Services

What do the gauges on your car, the jumbotron at a stadium, and Splunk Observability Cloud all have in common? They all show you the important information to know how something is performing. We all know what to look for in the first two examples. Whether it’s your gas gauge (yep, your gas tank is measured by a KPI), the total sum of points scored by a team (look at that, sports observability!) or any other common metric, there are countless examples of why it's important to visualize important metrics in a way that's easy to understand, easy to access and gives you access to the most important data in one place.
Luckily, Splunk Observabilty Cloud comes with out-of-the-box capabilities to make visualizing your services and infrastructure just as easy. Let’s take a look at how to visualize your services, starting with the services your team consumes from Cloud Service Providers.
Follow the Guide to Cloud Visibility
To start visualizing your cloud data, whether it is from one or multiple providers, simply use the guided Cloud Integrations options within Splunk Observability Cloud to onboard your service data, including options to select specific services you may be consuming. Not only does this guided data onboarding experience make it easy to connect to AWS, GCP, and Azure, but it will also ensure that the out-of-the-box dashboards and visualizations work correctly.

AWS integrations from the Splunk Observability Cloud Data Management user interface
Once your integrations are established, you are able to view the top-level summary of all of your infrastructure services by clicking on the Splunk Infrastructure Monitoring icon in the navigation bar. This will show you a summary of the number of services, EC2 instances, EBS volumes, and anything else that might be running in your cloud environment, as well as clear notifications about which ones have critical events generated from Splunk Observability’s out-of-the-box detectors (we’ll have a section about that later). If something does have critical alerts, you’d just click on the panel for that integration for a more detailed view of that service’s performance.

AWS section of Splunk Observability’s Infrastructure Monitoring overview dashboard

The EC2 dashboard displaying all of the out-of-the-box metrics, and indicating critical disk space issues
All Your Telemetry Data in One Place
This easy-to-use visualization capability doesn’t end with cloud services either. Most organizations either have or are planning to implement a digital transformation plan, and what that means for app developers, DevOps engineers, and SREs is microservices. Lots of them. And most likely this also means you have Kubernetes managing the containers for these microservices. Metrics and logs from containers can be a mess to visualize, contextualize, and extract value from, but this is another area where Splunk Observability has made that easy.
Once you have deployed OpenTelemetry to instrument data collection from your Kubernetes services and applications you will see all of your Golden Signals for your K8s deployment by simply clicking on the Kubernetes navigator tab in the same top-level infrastructure view as your cloud metrics. Not only will this give you a standardized, out-of-the-box view of metrics for nodes, containers, and clusters, but you can also filter by workload to see what is running in your environment. The K8s Analyzer tab also provides guided suggestions on where to drill down further based on possible performance degradations that are identified.

The Kubernetes navigator’s out-of-the-box visualizations.
Now all of this definitely makes visualizing your metrics easier and more efficient, but you are probably asking yourself “Wait a minute, this is Splunk, where are the logs?” Well, that’s one of the best parts, you now have an option to view the same logs you send to Splunk Enterprise in the same UI that has been optimized for observability use cases. You’d simply configure the Log Observer Connect feature, and you’d be able to see your Kubernetes and other cloud infrastructure logs, as well as pass the tags and other contextual filters from your metrics visualizations into that log view to review the logs you care about without writing SPL.

The Log Observer dashboard in Splunk Observability Cloud, with filters passed from Kubernetes navigator.
Custom Dashboards for Your Custom Needs
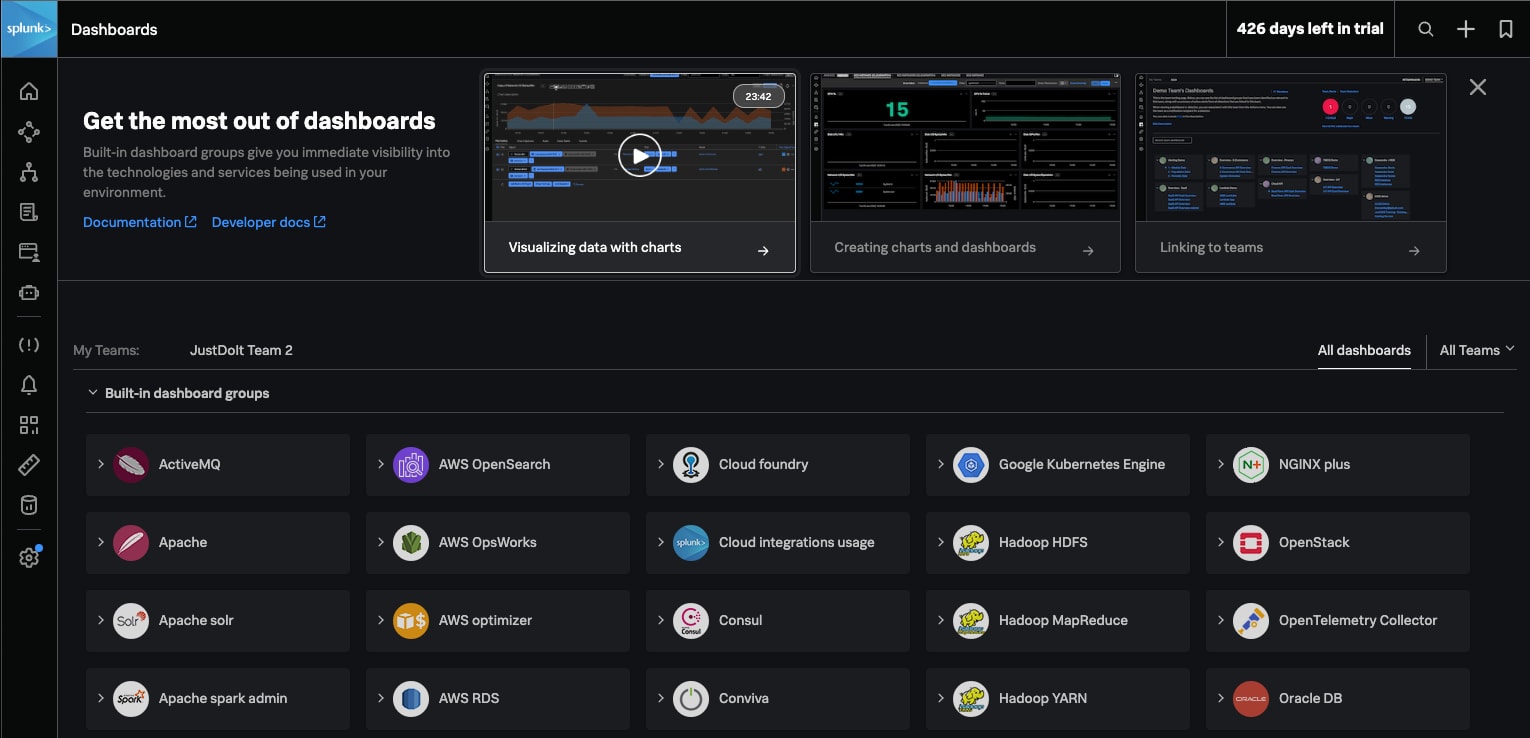
While the out-of-the-box dashboards will cover most of your day-to-day needs, you still have the ability to make dashboards that have metrics from different areas of your hybrid environment, contain business metrics, or anything else that might be unique to your organization. There are Getting Started guides embedded within Observability Cloud to help you build dashboards that are unique to your business needs and can be shared across teams.

Now that you know your service dashboard will be as easy to read as the dashboards you use in the rest of the world every day, go ahead and add an integration or two and see what you can find! Start a free Splunk Observability Cloud trial.
And speaking of finding things, our next step will walk you through how to tag your services to make finding that needle in the haystack a lot easier.
| < | Previously: How to Quickly Find What’s Broken in Your Complex, Cloud Environment | Next up: How To Use Tags to Speed Up Troubleshooting | > |
Related Articles
About Splunk
The world’s leading organizations rely on Splunk, a Cisco company, to continuously strengthen digital resilience with our unified security and observability platform, powered by industry-leading AI.
Our customers trust Splunk’s award-winning security and observability solutions to secure and improve the reliability of their complex digital environments, at any scale.


