Solve problems faster in monoliths and microservices by immediately detecting problems from new changes, confidently troubleshooting the source of an issue and optimizing service performance.
solution
Zoom in on the traffic you care about
Alert on business priorities
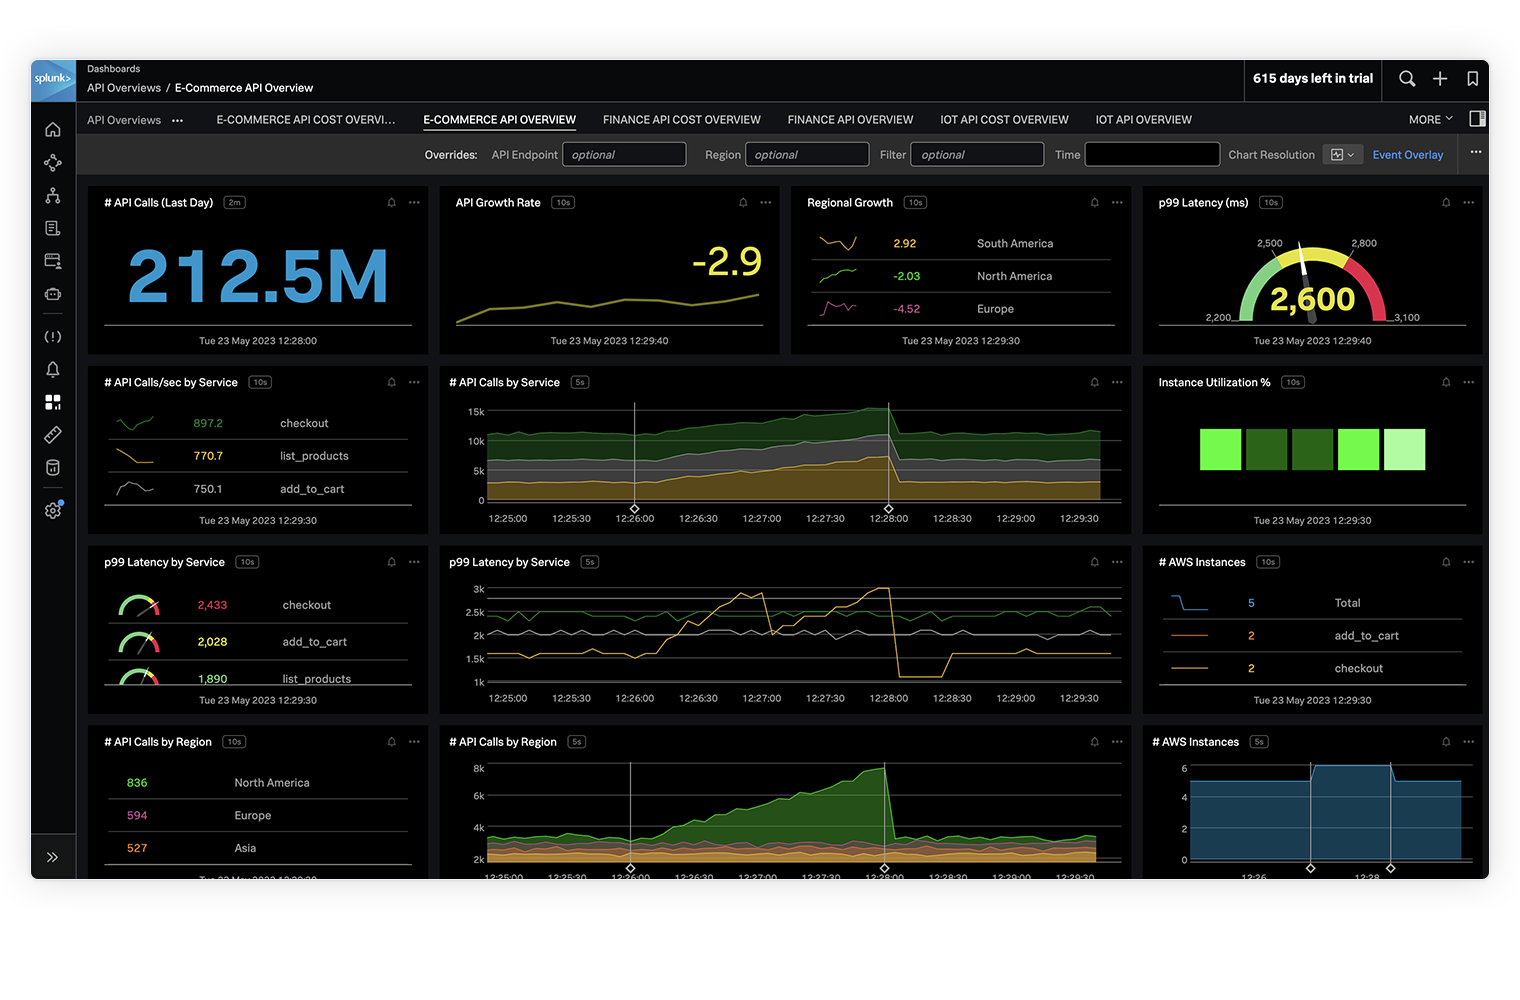
Tap into flexible, custom metrics that go beyond infrastructure and golden signals.
Identify issues at a glance
Route the problem to the right team with just a glance at the red dot in the Service Map.
Troubleshoot with shared context
Have all the relevant data at your fingertips for super fast troubleshooting.

Filter for the traffic you care about
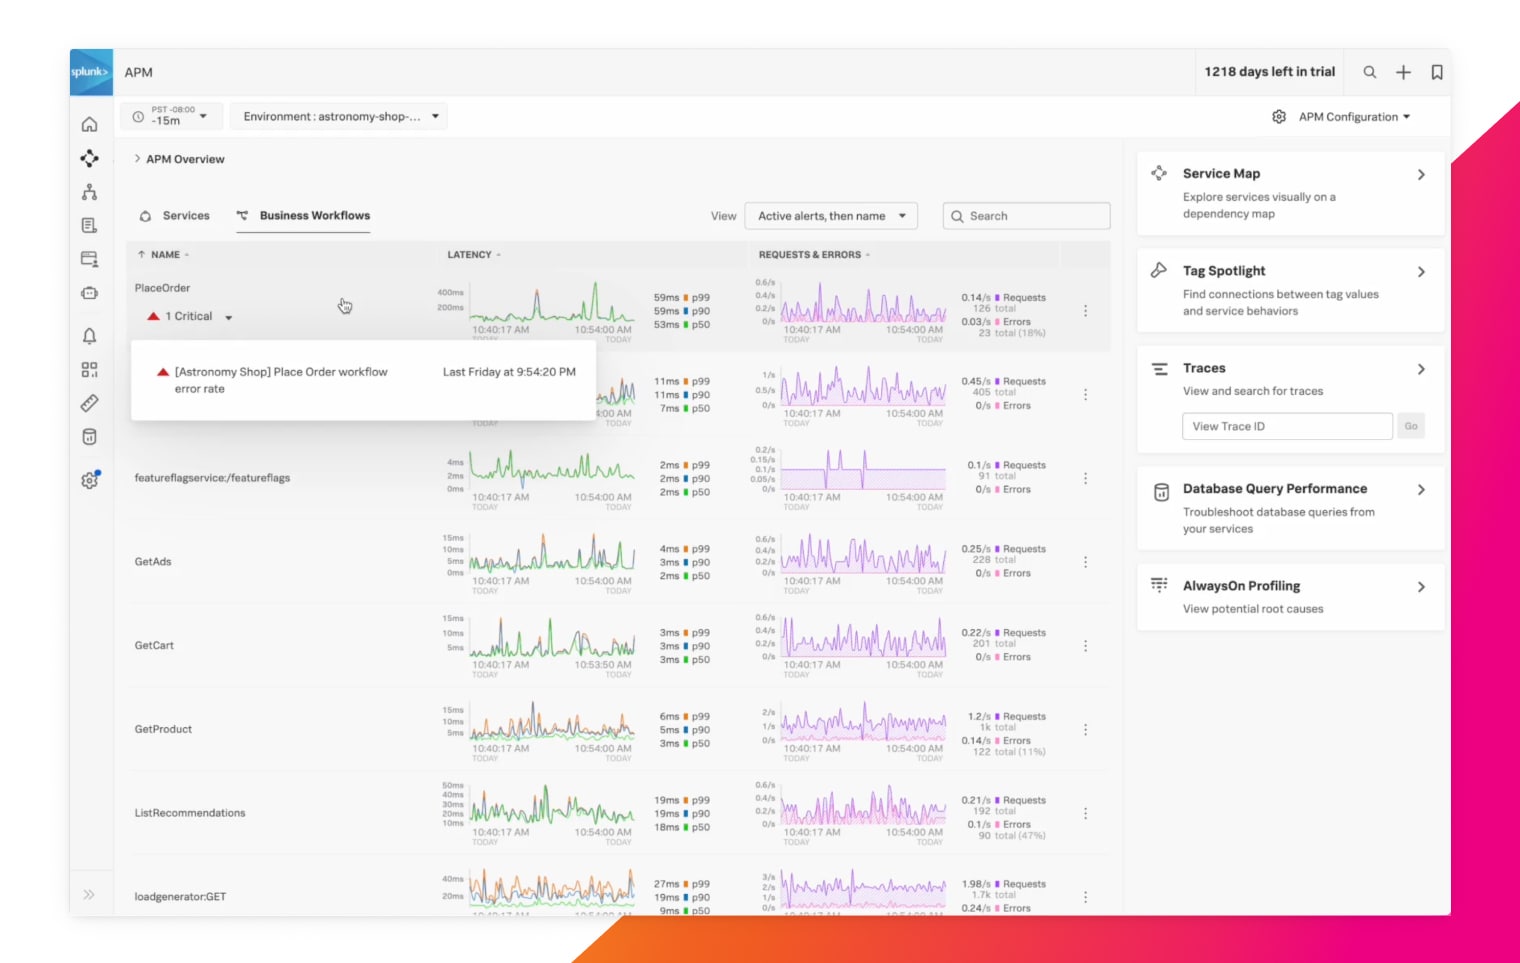
With Business Workflows, group together any combination of microservices that align to key business functions (such as checkout or login). Then simply click to see how these functions perform for any user segment.

Isolate which service is at fault when there’s an issue
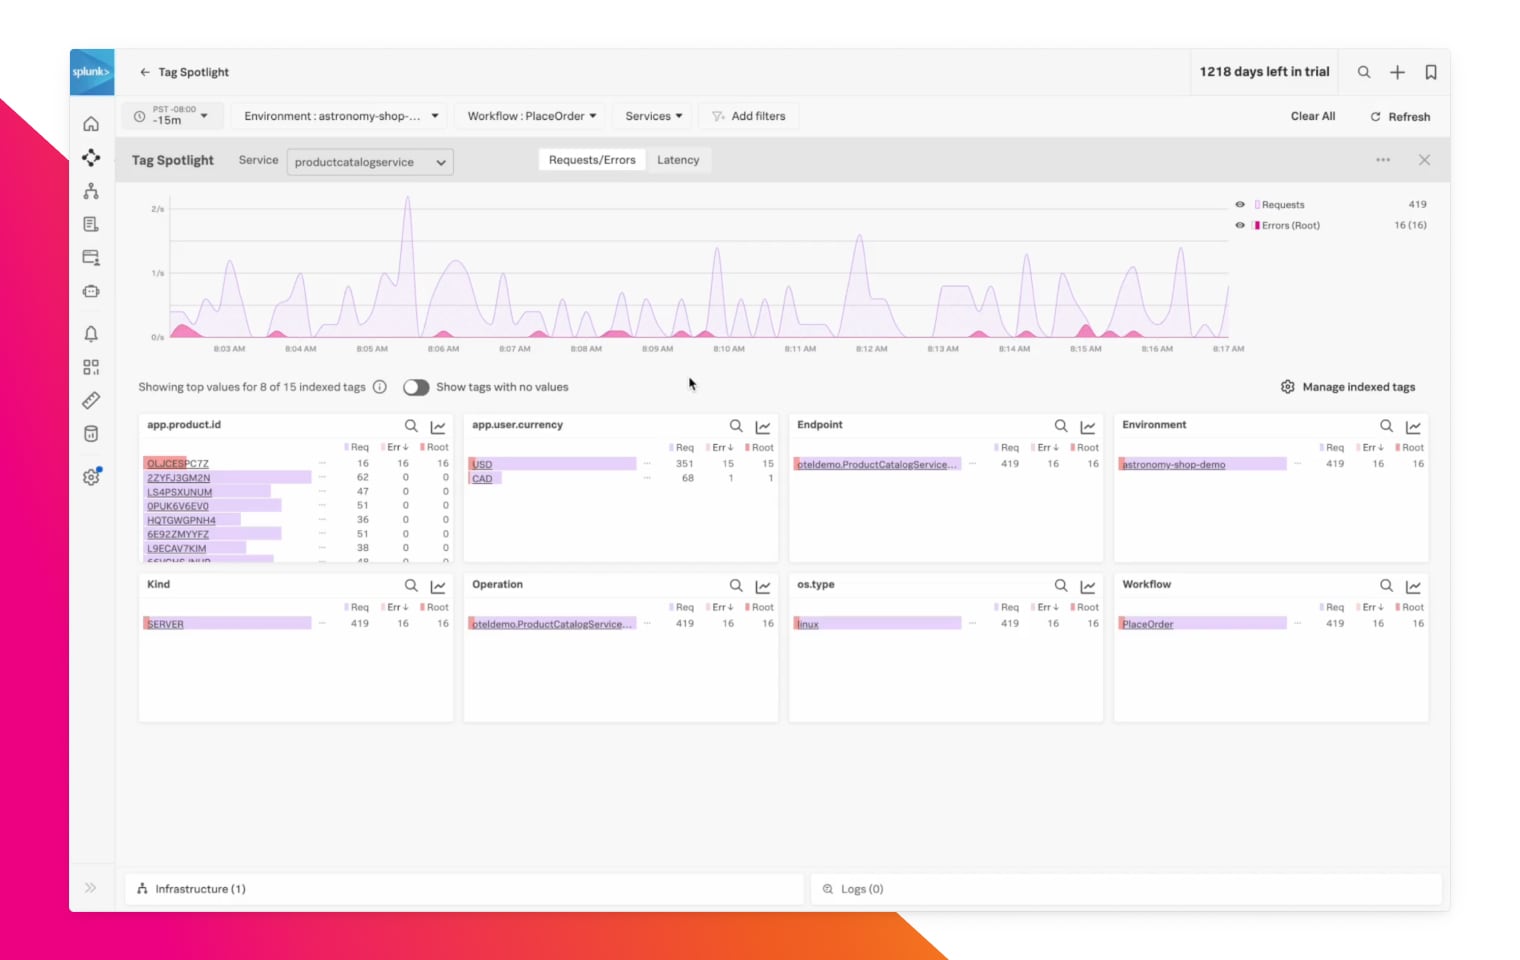
Use the Service Map and Tag Spotlight to zoom in on the performance of key workflows that impact segments of important traffic. Then, when the change occurs color coding shows which service caused an issue.
Get fast troubleshooting with shared context
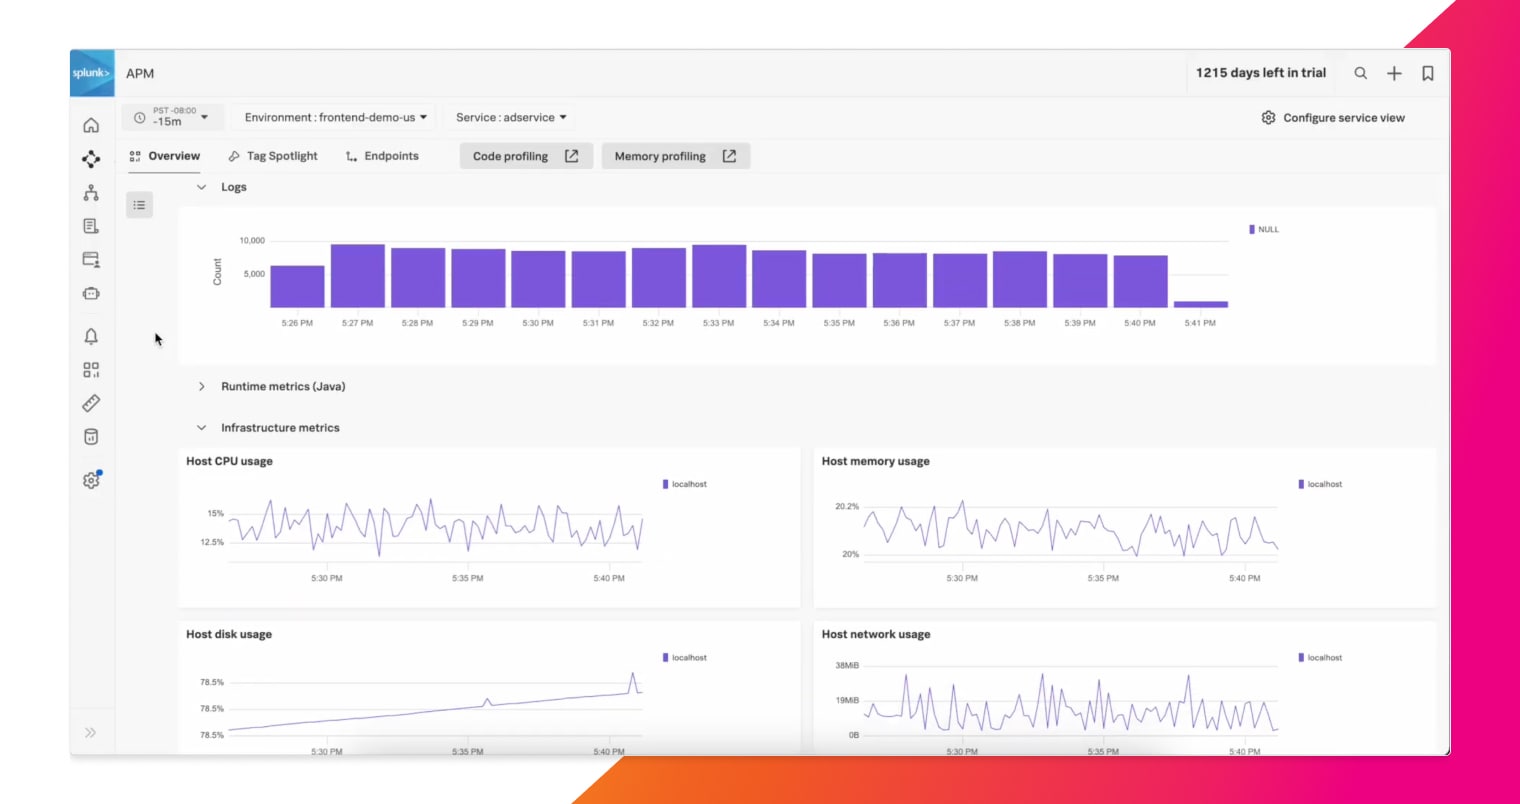
With Infrastructure Monitoring or logs-in-context, Splunk brings together all the traces together with infrastructure metrics and all the logs that are relevant to the issue that’s being investigated and filters out the data that’s not relevant.
Splunk captures all the logs, metrics and traces in a way that allows us to understand any event across our platform, so we can ask questions and get answers.

