Solve problems faster in monoliths and microservices by immediately detecting problems from new changes, troubleshooting the source of an issue and optimizing service performance.
Solution
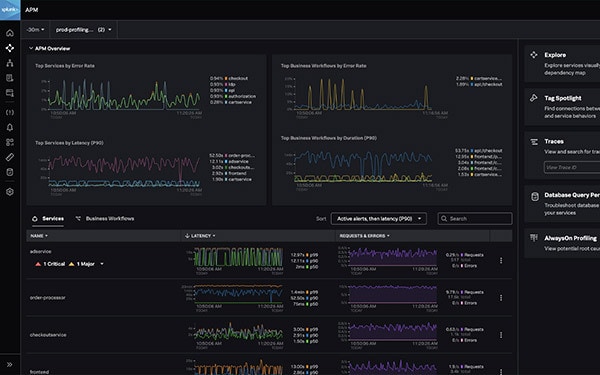
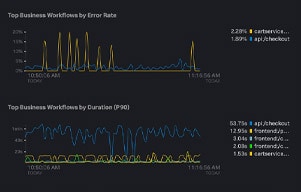
A unified observability platform for all data
All your data in one place
View all the logs, metrics and traces you need to troubleshoot issues in one screen.
Scaleable custom metrics
Tie your metrics to business KPIs and alert on important issues.
See ALL transactions
No need to reproduce issues. When notified of an issue, simply search for the relevant transactions.
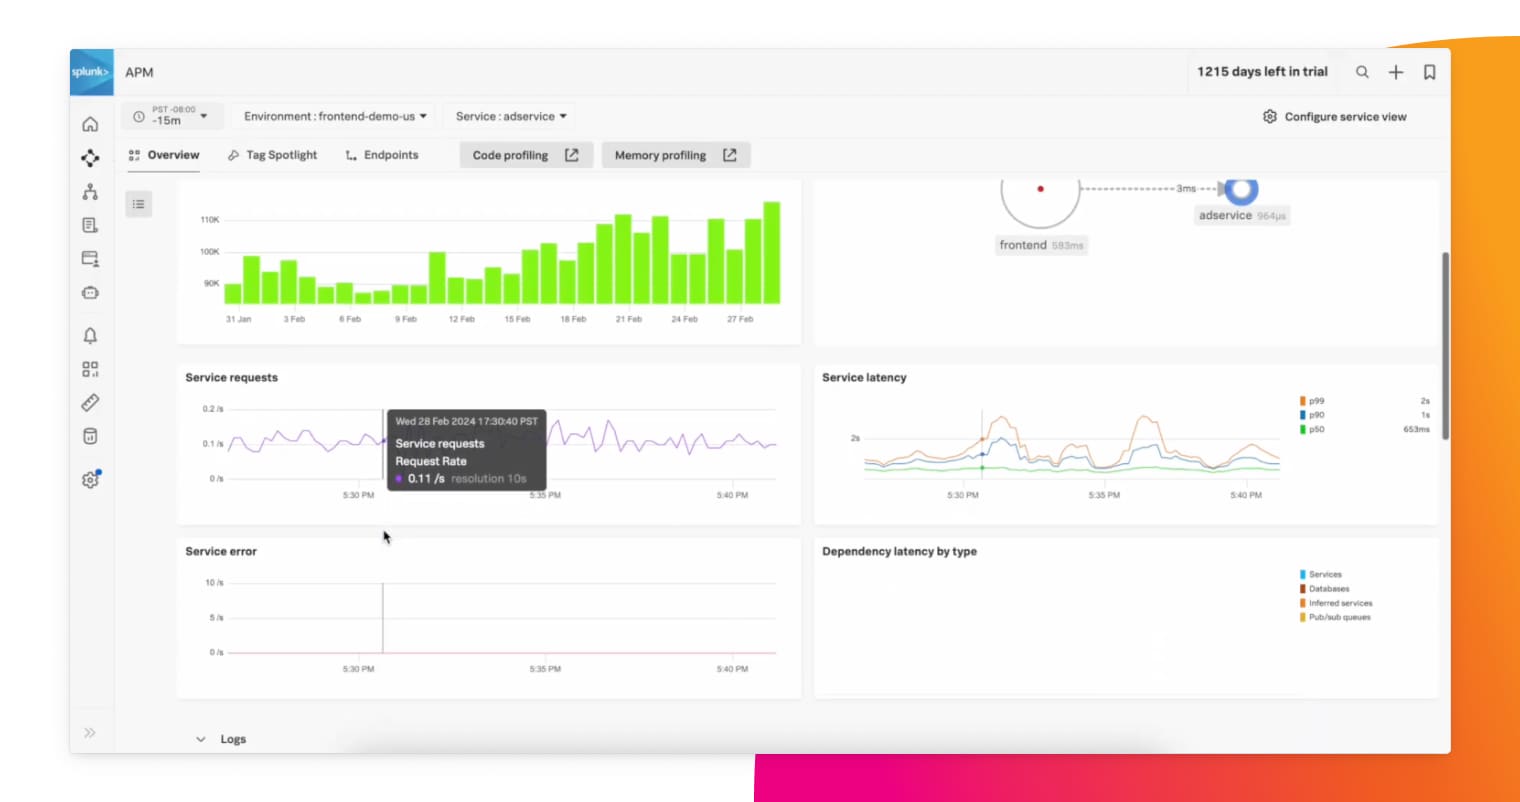
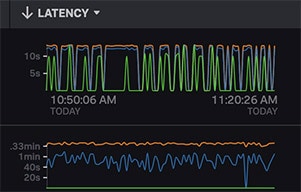
Granular, accurate alerts on service issues
Instrument custom metrics to improve detection and isolation of problems in your service. The more detailed and granular the metric, the more it helps you understand the issue. Splunk’s metrics engine is designed from the ground-up for large scale deployments.
Splunk Observability helps us see clearly into our complex environment, allowing us to act based on data so we can deliver on our mission to help customers build better products, faster.
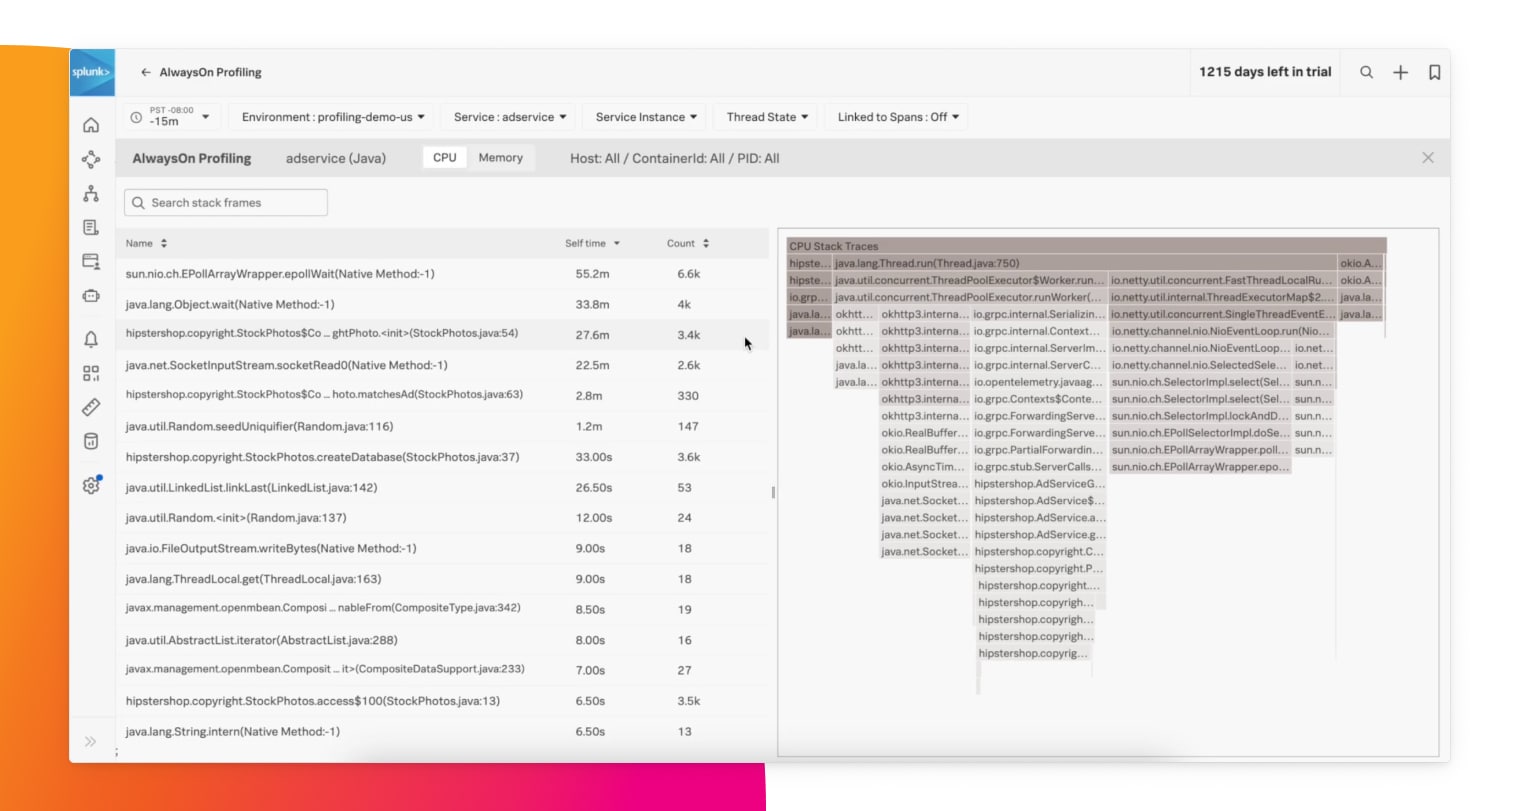
Diagnose accurate root cause within a service
Click to see whether issues are caused by the infrastructure, the network, a third party service or a poor database query. And with AlwaysOn Code Profiling you can see how much memory and CPU each line of code consumes to spot problematic code.
Splunk Observability gave Rappi the ability to prioritize putting the fire out by focusing on the right alerts. Since technology-related alerts, business-related alerts, operations-related etc. alerts all live in Splunk Observability, we are able to really pinpoint where the problem is and to concentrate on fixing it faster.
Instrument your code for the last time
With Splunk, you have peace of mind knowing that once you instrument your code with OpenTelemetry, you can send your data to any observability vendor without needing to re-instrument if you change tools or build new applications.
We could bake OpenTelemetry into our architecture from day one because we have Splunk, who is the number-one contributor to OpenTelemetry and way ahead of the curve on this.