Key Features in Splunk AppDynamics
Application Performance Monitoring (APM)

Identify hybrid and on-prem application issues in real time. When performance issues occur, AppDynamics provides extensive business context and shows you the how issues impact business metrics so you can prioritize remediation. Quickly diagnose the root cause anywhere in the stack - from third-party APls, the network, and even down to the code level.
Monitoring for SAP®

Our SAP monitoring solution empowers organizations with the ability to detect, isolate, and troubleshoot SAP performance issues with unmatched precision. Utilizing a low-overhead agent, our solution swiftly identifies performance bottlenecks, pinpointing the root cause down to a single line of ABAP code or a specific database query. Code-level transaction snapshots provide detailed diagnostic information whenever performance is impacted, enabling rapid resolution of issues.
This comprehensive monitoring extends across the entire stack, encompassing both SAP and non-SAP systems, and focuses on SAP's most critical areas such as IDocs, DB Locks, work processes, and remote function calls (RFCs). Comprehensive analytics offer a real-time understanding of program performance and impact, with over 35 pre-configured dashboards and more than 350 metrics/KPIs providing day-one value.
Manage risk effectively while reducing both the mean time to identify (MTTI) and mean time to resolve (MTTR) issues. Our solution ties insights, analytics, and alerts directly to business processes, monitoring the health of key workflows. Dynamic thresholds replace static alerting, delivering precise notifications that adapt to normal performance patterns.
Application security

Secure Application is an application security Add-on for Splunk AppDynamics that helps organizations protect their applications from advanced threats and vulnerabilities. It includes vulnerability detection, advanced threat detection and protection, and application context to secure applications across on-premises, cloud, and mobile environments. Secure Application helps organizations ensure the security and compliance of their applications while improving performance and reducing risks.
Secure Application helps you to:
- Reduce mean time to detect (MTTD) and mean time to respond (MTTR) by prioritizing security issues with business context and recommending fixes based on potential impact.
- Bring application and security teams closer by helping application teams adhere to an organization's most critical security priorities.
- Prevent breaches with our Application Monitoring and Protection solution without additional firewalls and proxies, automatically blocking threats in real time.
Business iQ Business Performance Monitoring

Understand how hybrid and on-prem application performance directly influences critical business metrics at every stage of the customer journey, from conversions to revenue impact. With User Journey Maps, visualize how performance improvements or degradations affect outcomes and prioritize issue remediation based on real business impact. Validate the success of new software releases and migrations by ensuring they meet performance goals, empowering your team to drive measurable results with confidence.
Digital Experience Monitoring (DEM)

Deliver flawless digital experiences. See how end-users interact with your applications with Experience Journey Maps that reveal the most trafficked application paths and their performance. Use real-user monitoring (RUM) for browser (BRUM) and mobile devices (MRUM) o optimize customer journeys across devices, operating systems, and browsers. Use synthetic monitoring to observe availability and performance of web apps and APis. Advanced alerting and correlation of real user monitoring, networking monitoring, and APM data accelerates MTTI and MTTR.
Network monitoring

Isolate network performance issues fast with complete visibility into how owned and unowned network, ISP, API, SaaS, and third-party services affect users with Splunk AppDynamics integrated with Cisco ThousandEyes. Quickly identify, triage, and prioritize issues that matter most to your business, and assign the right resources to resolve them.
Dashboards and analytics

Visualize in real time how application, transaction, and end-user data impact your business metrics like conversion and revenue.
Baselining

Learn the behavior of your application’s performance metrics over time with dynamic baselining., Create rolling averages of these metrics to help tune out noisy, false alerts, and generate intelligent, actionable alerts.
Business transaction monitoring

AppDynamics automatically discovers business transactions, both known and unknown, and constructs a detailed topology map of how traffic flows within your applications in real time. AppDynamics monitors traffic patterns and establishes baselines of acceptable performance. When important business transactions like “Add to cart” slow down, AppDynamics automatically triggers powerful diagnostic actions and isolates the root cause.
Transaction Snapshots

Actively monitor every business transaction execution within an instrumented application, whether using our agents or OpenTelemetry. Leverage Business Transaction and Process Snapshots to capture critical details for a deeper understanding of method call performance. Pinpoint exactly which line of code is taking the longest to execute and uncover insights to optimize application performance.
Infrastructure monitoring

Scale and optimize hybrid application environments across both traditional and cloud native infrastructures according to business priority. Modernize applications, reduce noise and costs, and fuel innovation with best-in-class cloud and infrastructure monitoring tools that enable you to prioritize KPIs affecting business results - like revenue.
Log Observer Connect for AppDynamics

View logs in Splunk while maintaining troubleshooting context from AppDynamics. Log Observer Connect for AppDynamics combines world-class APM from AppDynamics with world-class log analytics from Splunk to give you a complete picture of your applications.
Eliminate log replication and enable teams to analyze logs in place. There is no duplication of data as AppDynamics stores metrics, events, and snapshots while Splunk stores the logs. AppDynamics agents enhance Splunk logs with crucial metadata for faster, more targeted searches. Splunk Universal Forwarder imports the enhanced application logs into Splunk.
Root-cause analysis (RCA)

Monitor the health of all the entities in your application and shows you the suspected causes for any anomalies. You can confirm or negate the suspected causes, then drill down into metrics and snapshots.
Automatic anomaly detection uses machine learning to immediately detect anomalies — without preconfiguration. It gives you powerful insights that would be difficult or impossible to obtain using pre-configured health rules.
Al-driven Anomaly Detection

Detect when business transactions in your application are not performing normally. It uses machine learning to discover the normal ranges of key business transaction metrics, then alerts when metrics deviate significantly from expected values
Anomaly detection employs multiple techniques to ensure that the metric data it collects is accurate, and it uses heuristics that reduce alert noise. It can identify a wider range of problems than a person could capture in preconfigured health rules. And no configuration is required.
Self-hosted Virtual Appliance

AppDynamics virtual appliance is a pre-packaged, self-contained application monitoring solution based on the modern Kubernetes architecture. The virtual appliance is optimized for easy setup on virtualization platforms and provides the same extensive monitoring capabilities as the AppDynamics on-premises solution such as Al-powered anomaly detection, root cause analysis, and application security.
The virtual appliance form factor improves time-to-value in deployment, and it reduces operational costs while supporting self-hosted modern distributed services. You can deploy and manage self-hosted observability across on-premises and cloud platforms to meet regulatory, security, and business needs.
Smart Agent and Data Collection

Centralizs AppDynamics agent lifecycle management with Smart Agent and dramatically simplifiyagent installation, configuration, and upgrade. Use Smart Agent to remotely manage al deployed agents in one centralized place. Intelligent Ul-driven automation eliminates time- consuming manual intervention. For example, you can automate upgrading of agents in bulk.
Cisco Unified Contact Center Enterprise Monitoring
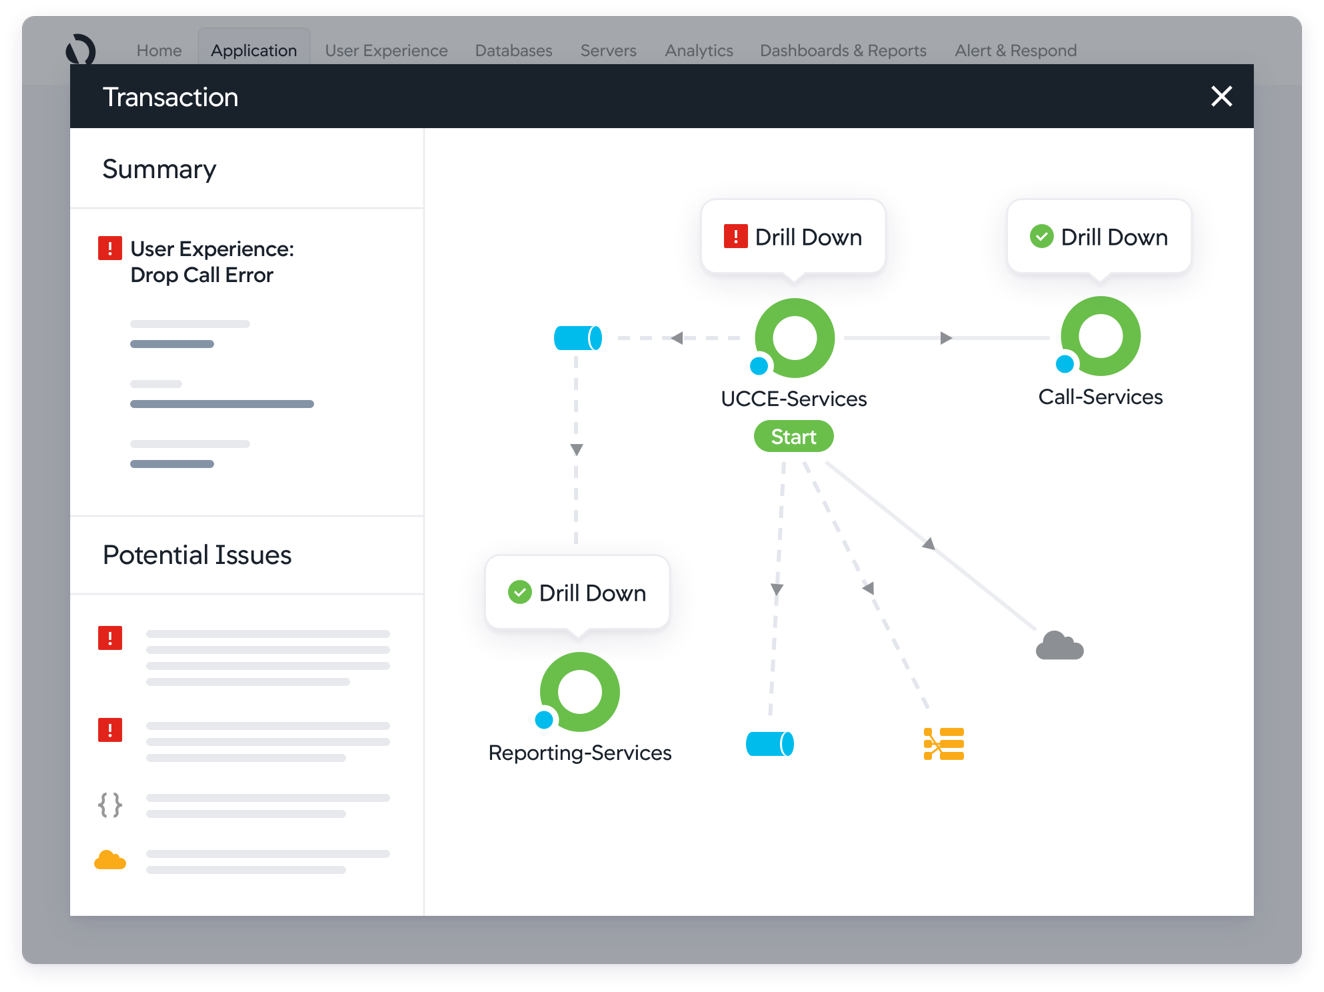
Set your call center up to drive optimal business results by integrating AppDynamics into Cisco Unified Contact Center Enterprise (UCCE). Monitor performance across all dependencies and integrations to pinpoint bottlenecks. Quickly diagnose and resolve call-center-specific issues, like dropped calls and media fetch errors. With network performance monitoring, you can ensure remote call center workers are continuously connected.
Cloud Migration

Monitor real time performance issues to streamline cloud migration while mitigating risk. Baseline every application, end user experience, and key infrastructure metric. Use performance insights to guide planning, prioritization, and cloud infrastructure sizing. Fix issues fast with AppDynamics AI-driven anomaly detection and root-cause analysis (RCA), and see service-level agreement compliance in real time.
Validate post migration success with AppDynamics pre- and post-migration business performance metrics to show the technical and business success of migrating to the cloud.
Continuous delivery
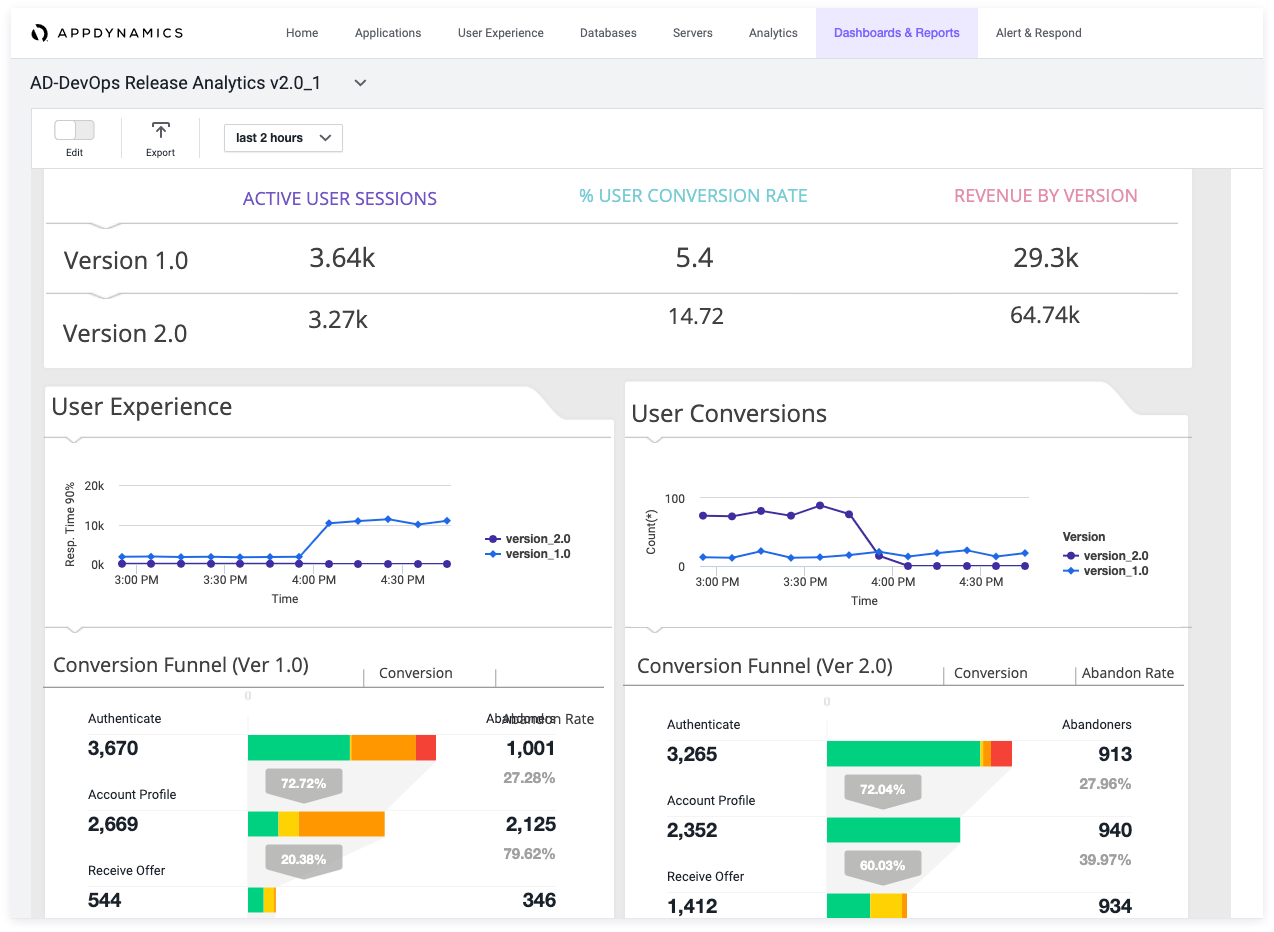
Identify and resolve issues prior to release so you can be confident that new software releases will perform smoothly and deliver successful business outcomes.
AppDynamics automatically generates application flow maps that dynamically update with every release. You can see in real-time how new releases are performing against older versions.
Machine-learning-based anomaly detection detects when application performance deviates from normal, and automated root cause analysis speeds MTTR. You can identify application crashes immediately and understand the user journey to help with new release planning and design activity.
