How Logging Works in Kubernetes: Challenges, Approaches, and Solutions for K8s Logging

No matter how experienced your team is with managing logs in conventional application environments, managing logs in Kubernetes (K8s) can pose new challenges.
K8s involves many more dynamic, distributed, and ephemeral components and generates a higher volume of logs compared to conventional application environments. Finding and analyzing those logs in a way that delivers actionable system insight for an effective observability practice involves a level of complexity that exceeds the logging challenges associated with other types of distributed systems and environments and environments.
Certainly you can overcome Kubernetes logging challenges — doing so requires evolving your approach to logging. You must:
- Rethink the way you collect, process, and analyze logs.
- Reconsider the role that logging plays in your overall observability strategy and culture.
To guide you along this path, this article explores the fundamentals of Kubernetes logging. I’ll explain:
- Why Kubernetes log collection is so challenging, especially making sense of all the different log types a K8s environment produces.
- How to avoid getting stuck in the mud of Kubernetes logs — by simplifying Kubernetes log management and improving visibility into Kubernetes and the complex, cloud-native environments it powers.
(For more on Kubernetes, explore our other expert articles: Intro to Kubernetes Monitoring and How To Monitor Kubernetes with Splunk Infrastructure Monitoring.)
What is K8s logging? How Kubernetes logging works
Although Kubernetes logs may not seem that different from other types of logs at first glance, they work differently in certain key respects.
Types of Kubernetes logs
First, there are two categories of logs in Kubernetes:
- Application logs produced by the applications running inside your Kubernetes environment. These logs help you understand application behavior, performance, and errors.
- Cluster/system logs provide visibility into cluster-wide and node-specific Kubernetes infrastructure: control plane logs, kubelet logs, container runtime logs, audit logs, and network logs.
There are multiple types of logs in each of these categories. A single application is likely to produce multiple logs, one for each microservice instance that runs as part of the application. The cluster-level logs also fall into various categories. There are logs for:
- The primary node
- Worker nodes
- The Kubernetes API server
- Various other components of Kubernetes
Log locations
Given that there are multiple types of logs in Kubernetes, it’s not surprising that they are spread across a variety of system log files and locations. Most Kubernetes system logs are stored in the /var/log directory, e.g. API server, kubelet, pod logs.
Others, like application logs inside containers, can be more challenging to collect. Their location depends on the application container runtime.
Events and metrics
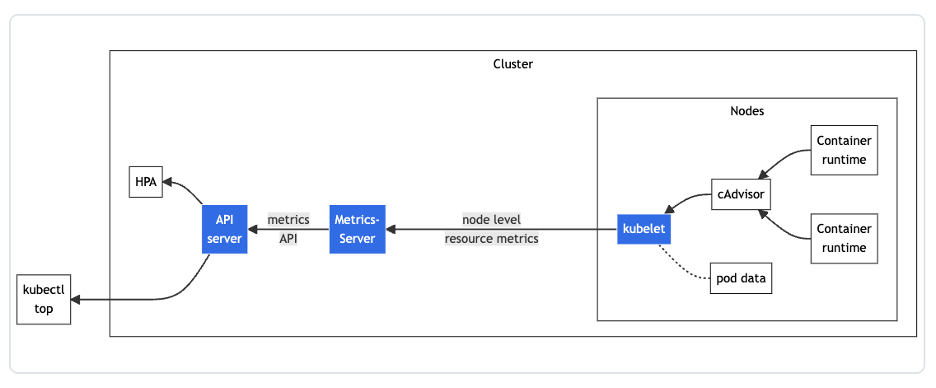
Although this article focuses on Kubernetes logs, it’s important to note that logs are only one of several sources of visibility into the Kubernetes environment. Kubernetes offers a Metrics API, which is useful for:
- Collecting data about cluster health and resource consumption.
- Recording certain event types, such as the termination of pods.
This information is not fully available from Kubernetes logs — instead, it’s recommended to collect and analyze this events and metrics data alongside log data to gain end-to-end visibility into Kubernetes.

Architecture of the resource metrics pipeline. (Image source: Kubernetes documentation.)
Challenges of Kubernetes logging
The logging architecture of Kubernetes itself is not especially complicated. However, logging in Kubernetes becomes challenging due to the difficulty of collecting and analyzing the various logs inside your applications and cluster.
Lack of log centralization
One fundamental challenge is that Kubernetes logs are spread across various locations. You can’t tail a single log file or run a single command to pull all the log data from your cluster.
Instead, if you want to collect logs manually, you’ll need to toggle between a multitude of locations: all of your nodes, every single pod, and more. Commands like journalctl can simplify this process to some extent, but they hardly make it easy.
(Related reading: centralized logging, explained.)
Lack of built-in log management
Adding to the complexity of log collection is the fact that Kubernetes itself provides no native framework for managing logs. It simply produces the logs — leaving it to you to figure out how to manage them.
Container runtimes in Kubernetes do automatically rotate and delete log data from containers once their logs exceed 10 megabytes in size, but container log data isn’t indefinitely persisted. To persist your container log data, to ensure it’s available for analysis, you have to aggregate and store that data somewhere else before Kubernetes overwrites it.
(New to this topic? Start with our introduction to log management.)
Diverse and evolving log formats
Kubernetes logs come in a variety of formats — there is no standard log structure or approach.
Kubernetes developers have begun to address this problem by standardizing system logs into structured, JSON formatting. However, this feature is not enabled by default and doesn’t enforce application log structure.
The bottom line here: although there are efforts to make logs more consistent, the lack of common structure and formatting remains a challenge today. That Kubernetes logging standards continue to evolve complicates the log management strategies that teams may develop. It’s difficult to know whether the logging approach you use on one version of Kubernetes will work equally well with a future release.
Lack of persistent log storage
For application logs, Kubernetes does not offer persistent log storage by default. Instead, pods and containers write logs to the container runtime’s logging system, but these logs are rotated or removed when the node shuts down.
To retain log data, it must be aggregated to an external, persistent storage location. There are several approaches to doing this, such as:
- Using a sidecar container to collect and forward logs.
- Streaming logs directly to an external location instead of writing them to local storage inside your containers.
- Deploying a log collector like the OpenTelemetry Collector to receive, process, and export logs to centralize collection.
Solutions for Kubernetes logging
Configuring structured logs allows for filtering log entries, pattern recognition, and trace correlation. Structured logs also reduce storage costs thanks to the more efficient compression of key-value data.
Best practices for Kubernetes logging include:
- Using structured JSON logs.
- Including timestamps, log levels, and metadata.
- Aggregating logs.
- Using a log collector like the OpenTelemetry Collector.
Collect, process, and export logs with the OpenTelemetry Collector
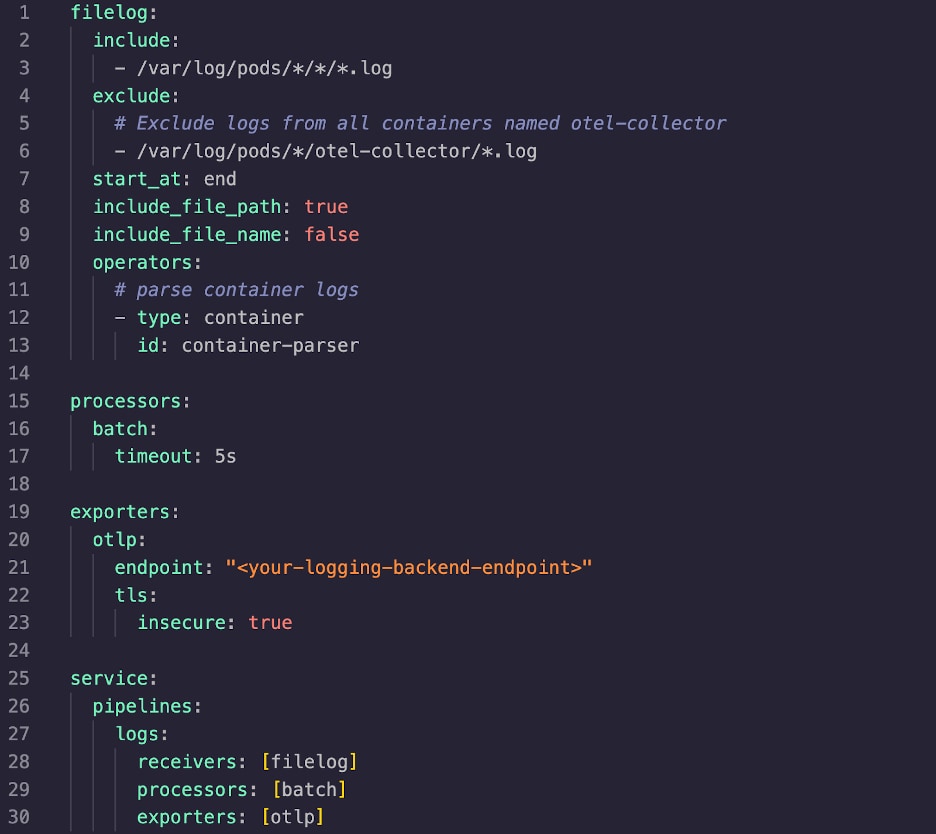
OpenTelemetry is an open-source observability framework that enables insights into the performance and health of your applications and infrastructure. The OpenTelemetry Collector collects, processes, and exports telemetry data to specified backend platforms. Log collection is supported by default. The Filelog Receiver is the de facto solution for collecting any Kubernetes logs.
With the OpenTelemetry Collector installed and configured with the Filelog Receiver, logs from Kubernetes can be exported to an observability backend (like Splunk Observability Cloud).

Additionally, volumes and volumeMounts will need to be set in your Collector manifest in order to give Kubernetes access to the logs it wants to collect.
You can also use the OpenTelemetry Collector to collect logs sent to standard output by Kubernetes containers. To enable this feature presets.logCollection.enabled must be set to true in the Collector’s values.yaml file.

Adding processors can help filter, structure, and provide additional log metadata.
Logging off
As we’ve seen, managing logs in a Kubernetes environment involves many moving parts and complexities.
As long as you’re armed with an understanding of some of the challenges, a standardized log format, and log collection configured in the OpenTelemetry Collector, you can begin to build a consistent, unified Kubernetes logging and observability solution.
See an error or have a suggestion? Please let us know by emailing splunkblogs@cisco.com.
This posting does not necessarily represent Splunk's position, strategies or opinion.
Related Articles
About Splunk
The world’s leading organizations rely on Splunk, a Cisco company, to continuously strengthen digital resilience with our unified security and observability platform, powered by industry-leading AI.
Our customers trust Splunk’s award-winning security and observability solutions to secure and improve the reliability of their complex digital environments, at any scale.


