What Is Distributed Tracing?

When all your IT systems, your apps and software, and your people are spread out, you need a way to see what’s happening in all these minute and separate interactions. That’s exactly what distributed tracing does.
Distributed tracing is a way to track requests in applications and how those requests move from users and frontend devices through to backend services and databases.
Distributed tracing enables you to track requests or transactions through any application you monitor — giving you vital information that supports:
- Uptime
- Issue and incident resolution
- Ongoing optimization
- Ultimately, a pristine user and customer experience
In this article, let’s take a long look at distributed tracing and the technologies used to make it possible in your enterprise.
Metrics, logs, traces: Pillars of observability
Managing modern software environment hinges on the three “pillars of observability”: logs, metrics and traces. (Sometimes events is included in this: MELT.) Each of these is a data source that provides crucial visibility into applications and the infrastructure hosting them. This practice informs many areas of IT monitoring, including observability platforms (like Splunk), application performance monitoring (APM), and infrastructure monitoring, among others.
For many IT operations and site reliability engineering (SRE) teams, two of these pillars, logs and metrics, are familiar enough. For decades, teams have analyzed logs and metrics in order to:
- Establish baselines of normal application behavior.
- Detect anomalies that could signal a problem.
- Further investigate issues as necessary.
Metric collection gathers quantitative data about an application's performance, helping developers optimize, monitor, and improve user experience through informed decision-making. However, it’s the third pillar— traces — that may be less familiar.
What is a trace? Why is it important?
A trace is a collection of transactions (spans) that represent a unique user or API transaction that is handled by an application and its constituent services.

Tracing starts the moment a user interacts with an application. You send an initial request and that is assigned a unique trace ID. One trace represents one user interaction. As the request moves through the host system, every operation performed on it (span) is tagged with a few items.
Each span contains:
- A beginning and an ending time
- A trace ID
- Additional information about the request, e.g. microservice version that generated the span.
Each span represents one segment of the request’s path including information like:
- The name and address of the process handling the request.
- Logs that provide context about the process’s activity.
- Tags to query and filter requests by session ID, HTTP method, etc.
- Detailed stack traces and error messages in the event of a failure.
The fundamental goal behind tracing — understanding digital transactions — is always the same. But the way we do it changes. It doesn’t work, though, when used with applications built on a distributed architecture, like microservices.
Traditional tracing vs. distributed tracing
Let’s first look at traditional tracing, how it used to work, and then we can start to understand why this isn’t a great solution today.
Traditional tracing
Tracing was simpler in monolithic applications because of fewer components, reducing the criticality for full visibility. Traditional tracing tools used probabilistic sampling, catching only a small part of transactions. This provided limited insights, allowing SRE and IT teams to:
- Understand general trends for common user requests.
- Detect significant performance changes, like complete service failures.
However, the problem with probabilistic sampling is that, it is not scalable for complex environments and has some performance issues, like:
- Small performance degradations, such as latency increasing from 1 to 1.2 seconds for a specific database shard, may go unnoticed because of insufficient transaction coverage.
- Errors triggered by rare user input may not appear frequently enough in sampled data to become detectable.
In a dynamic distributed system, where ephemeral components and unrelated alerts complicate troubleshooting, traditional tracing fails. Issues might only be detected when they escalate into major disruptions, highlighting the need for comprehensive, real-time tracing in modern environments.
Modern tracing: how traces in microservices work
A single-user transaction fans out to interact with tens or hundreds of microservices, each one requesting data from backend data stores, interacting with each other via APIs, or other parts of your infrastructure. (Think of it as software using software.)
By design, microservices scale independently from one another. It’s normal to have multiple instances of a single service running at the same time on different servers, and different environments. Each microservice can run on multi-layered stacks made up of:
- Servers
- Application code
- Containers
- Orchestrators
- And more
Traditional monitoring — looking at a single body of code — just won’t cut it. To understand request flows within a web of microservices, you must collect additional data, like:
- The specific service instance that handles the request
- Where it is hosted within your environment
Because traces are distributed across different services, this process of tagging spans and correlating them is called “distributed tracing”.
How distributed tracing works
Distributed tracing tracks a request when it travels across different services in a microservices architecture. While doing so, it provides visibility into each service's performance and interactions.
For instance, think of any popular online video game with millions of users. This game must keep track of each player’s location, every interaction they have with each other, the items they pick up in the game, and a variety of other data generated during play. Keeping the game running smoothly would be unthinkable with traditional tracing methods — distributed tracing makes it possible.
Distributed tracing follows a request (transaction) as it moves between multiple services within a microservices architecture, allowing you to identify where the service request originates from (user-facing frontend application) throughout its journey with other services.
As an example of distributed tracing, imagine a collection of microservices in a standard modern application:
- The user interface is rendered by a small group of microservices.
- User data is recorded in a database (that runs as a different service).
- Some number of small backend services handle data processing.
In this environment, a distributed trace of the user’s request would start by recording information about the request’s status on the first frontend service — which data the user inputs and how long it takes the service to forward that data to other services.
The next touchpoint in the trace would involve the backend services, which accept the input and perform any necessary data processing, like ETL or, increasingly, ELT. Then, the backend services transfer the processed data to the database service, which stores it.
Example of distributed tracing
Let’s consider a simple client-server application:
- The client sends a request to the server for a specific customer.
- The server processes the request and sends the response back to the client.
Within the context of the client, a single action has occurred. The client sent a request and got a response — but we observe each server request generated as a result of this client request in a span. As the client performs different transactions with the server in the context of the application, more spans are generated. We can correlate them together within a trace context.
The trace context is the glue that holds the spans together. Take a look at this breakdown:
- Client sends a customer name request to Server at time: X (Trace Context: customerrequest1, SpanID: 1, timestamp: X)
- Server receives customer name request from Client at time: Y (Trace Context: customerrequest1, SpanID: 2, timestamp: Y)
- Server parses the request from the Client at time: Z (Trace Context: customerrequest1, SpanID: 3, timestamp: Z)
Note that the trace context remains the same, tying each span together and letting the infrastructure know that each span belongs to the same transaction.
A distributed tracing tool first correlates the data from all the spans and then formats them into visualizations that are available either:
- On request through a web interface
- Provided automatically through alerting or AIOps tools
Instrumentation: how to generate traces
To gather traces, your applications must first be instrumented. What is instrumentation? Instrumenting an application requires using a framework, like OpenTelemetry, in order to generate traces and measure application performance. This information is super helpful: now you easily locate bottlenecks — and quit spending time seeking them out.
As long as you’re using a vendor-agnostic framework, like OTel, you’ll only have to do instrumentation work once.
Collecting traces, exporting traces
Once your application has been instrumented, you’ll want to begin collecting this telemetry using a collector.
The Splunk OpenTelemetry collector is a great example. The collector provides a unified way to receive, process, and export application telemetry to an analysis tool like Splunk APM, where you can:
- Create dashboards, business workflows and identify critical metrics.
- Quickly correlate events like increases in latency or errors with tag values, providing a one-stop-shop to understand how traces are behaving across your entire application.
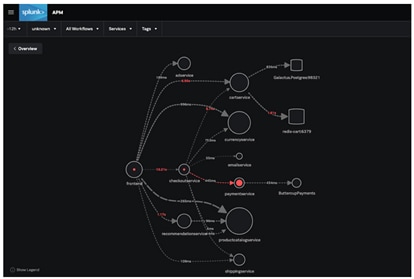
- Sift through trace data in seconds to immediately highlight which microservice is responsible for errors within the dynamic service map.
Can you guess which microservice is ultimately responsible for the errors in the application? With Splunk, you can go even deeper than this to determine which version of payment service is responsible.
Types of tracing
There are three primary tracing types.
Code tracing
Code tracing refers to a programmer’s interpretation of the results of each line of code in an application and recording its effect by hand instead of a debugger — which automates the process — to trace a program’s execution.
Manually tracing small blocks of code can be more efficient because the programmer doesn’t need to run the entire program to identify the effects of small edits.
Data tracing
Data tracing helps check the accuracy and data quality of critical data elements (CDEs) trace them back to their source systems, and monitor and manage them using statistical methods. Typically, the best way to perform accuracy checks is to trace operations to their origins and validate them with source data — although historically this hasn’t been cost-effective in large operational processes.
Program trace (ptrace)
A program or stack trace is an index of the instructions executed and data referenced during the running of an application. The information displayed in a program trace — the program name, language, and the source statement that was executed, among other data — is used in the debugging process.
Outcomes & benefits of distributed tracing
The main benefit of distributed tracing is visibility into real user transactions in one place. Complexity doesn’t matter. Some benefits that come from a more holistic approach include:
Razor-sharp performance problem identification
By monitoring the request’s status and performance characteristics on all these services, SREs and IT teams can pinpoint the source of performance issues. You can track specific, minute detail to know the responsiveness of each individual service in order to determine, for example that:
- The database service is suffering from high latency.
- A service that renders part of your homepage is failing 10% of the time.
(Related reading: what downtime is costing your business.)
Increased productivity
The disjointed nature of microservice architectures makes application performance monitoring — including functions such as tracking down and fixing performance issues — time consuming and expensive compared to monolithic applications.
Additionally, the way failure data is delivered in microservices isn’t always clear and often requires developers to decipher issues from error messages and arcane status codes. Distributed tracing provides a more holistic view of distributed systems that:
- Reduces developer time spent diagnosing and debugging request failures and latencies.
- Makes troubleshooting root causes more efficient
All this ultimately improves your mean time to recovery/repair (MTTR).

Improved collaboration among teams
In a microservice environment, each process is generally the responsibility of a particular team. This can cause problems when it becomes necessary to identify errors and determine who is responsible for fixing them. In this context, distributed tracing helps to:
- Identify which team is responsible for fixing which issues.
- Accelerate response time.
- Enable teams to work together more effectively.
Flexible implementation
Distributed tracing tools work with a wide variety of applications and programming languages, so developers can incorporate them into virtually any system and view data through one tracing application.
Challenges of distributed tracing
Although distributed tracing is significantly more beneficial than traditional tracing, it comes with a few challenges:
- Data volume: Generated trace data has a huge volume. it can be difficult to analyze, store, or gather insights without proper tools and strategies.
- Tooling: Finding the right tool for visualizing, collecting, and analyzing trace data can be difficult. This is because many existing tools do not support the complexity of distributed systems.
- Context propagation: With event-driven architectures or asynchronous calls, it may be difficult to ensure that various services correctly propagate trace contexts, like trace ID.
- Latency: Capturing and aggregating trace data can sometimes introduce latency. This will negatively impact real-time applications, where speed is important.
- Overhead: Distributed tracing can cause performance overhead. This is because services need to collect, store, and transmit trace data. Thereby, impacting response time.
- Complexity: When a number of microservices interact with each other, maintaining a consistent trace across all services requires careful coordination and instrumentation. This increases the complexity of tracing.
- Digital transformation: With digital transformation, the complexity of IT environment increases, demanding the need of advanced distributed tracing solutions for effective visibility and monitoring.
Tracing projects & tools
Now let's look at some common tools and frameworks that support distributed systems today.
Open distributed tracing standards: OpenTelemetry
With applications consisting of different coding languages, distributed microservices, and written by people all over the globe, it helps to have an open vendor-agnostic framework you can use to instrument your applications.
For many languages, OpenTelemetry provides automatic instrumentation of your application, whereas others must be manually instrumented.
Splunk Observability
Many large, global enterprises, where distributed systems are about as complicated as can be, choose Splunk Observability for all their tracing, monitoring, and observability needs. An indsutry-leader, Splunk Observability enables all sorts of must-have goals, including unifying visibility, accelerating troubleshooting, and controling both your data and your costs.
(Learn more about Splunk Observability.)
Jaeger & Zipkin
Jaeger and Zipkin are two popular open-source request tracing tools, each with similar components: a collector, datastore, query API, and web user interface.
Both work like this: Outgoing requests are traced along with the application. The collector then records and correlates the data between different traces and sends it to a database where users can query and analyze it via the UI. The tools help with the 3 phases of request tracing - instrumentation, propagation, and collection and analysis, which together enable tracking and understanding the flow of requests across services.
Jaegar and Zipkin are differentiated by their architecture and programming language support — Jaeger is implemented in Go, Zipkin in Java. Zipkin supports virtually every programming language with dedicated libraries for Java, Javascript, C, C++, C#, Python, Go, Scala, and others. Jaeger’s supported-language list is shorter: C#, Java, Node.js, Python, and Go.
Apache Kafka
Kafka is a distributed event streaming platform, providing a high-throughput, low-latency platform for handling real-time data feeds, often used in microservice architectures. It’s used to:
- Process streams of records in real time.
- Publish and subscribe (pub/sub) to those record streams in a manner similar to a message queue.
- Store them in a “fault-tolerant durable way.”
Kafka uses “topics” — a category or feed name to which records are published — to abstract streams of records. For each topic, Kafka maintains a partitioned log, an ordered, continually appended sequence of records that can serve as an external commit log for a distributed system.
Another noticeable tool is AWS Lambda. It automatically captures trace data. Thus allowing developers to monitor serverless functions, enabling visibility into the performance and interactions of microservices.
Distributed tracing is essential today
Using microservices for cloud-based apps is the norm today. Distributed request tracing offers a huge advantage over the older, needle-in-a-haystack approach to tracking down the problems that could disrupt your services.
If you’re responsible for a microservice-based system, equipping your enterprise with this powerful technology will optimize how you do your job. Try distributed tracing with Splunk Observability to get a real-time view of your tracing telemetry and start solving problems faster.
See an error or have a suggestion? Please let us know by emailing splunkblogs@cisco.com.
This posting does not necessarily represent Splunk's position, strategies or opinion.


Related Articles
About Splunk
The world’s leading organizations rely on Splunk, a Cisco company, to continuously strengthen digital resilience with our unified security and observability platform, powered by industry-leading AI.
Our customers trust Splunk’s award-winning security and observability solutions to secure and improve the reliability of their complex digital environments, at any scale.

Subscribe to our blog
Get the latest articles from Splunk straight to your inbox.
