Tech the Halls - Part 2: Naughty and Nice

The nights are getting longer, and the elves are getting busier!
In our first installment, Tony the Elf took us through how we can use Splunk to analyse financial data to ensure we are all set for Christmas. We explored different types of visualisations, learned how to interpret some very important Key Performance Indicators (KPIs), and even discovered how to forecast spending habits.
This time, things are getting personal…
Have You Been Good This Year?
In this second installment of our festive-themed series, we take you to the SOC, or Santa Operations Centre for those not familiar. This is where Santa and his elves monitor the delivery operations on the big day, using past Christmas data sets to optimise operations. From monitoring Key Performance Indicators from the CRM (Christmas Readiness Matrix) system to analysing the Naughty or Nice Lists, Splunk’s lookup functionality plays a starring role in ensuring the right presents go to the right children.
Let’s dive into how these lookups can turn Santa’s data into a sleigh-load of insights.
Splunk Lookups: Making the Impossible Possible
This powerful feature allows you to enrich your data by matching fields in your event data with external datasets, without ingesting them. It’s like creating a bridge between two different worlds of data, unlocking the ability to map, correlate, and analyse in ways previously not possible without a series of onboarding tasks.
With that in mind, have a think about how Santa's sleigh is loaded so efficiently every year. By correlating Naughty or Nice List data with toy inventory and delivery logistics, lookups ensure there is a single dataset with all the required information, ensuring the smoothest Christmas operation in the world.
Whether it’s matching inventory against demand, analysing delivery performance, or cross-referencing lists like Santa’s Naughty or Nice, Splunk lookups turn raw data into rich, actionable insights.
Now, let’s visit Tony at the SOC to see it all in action!

Exploring the Santa Operations Centre
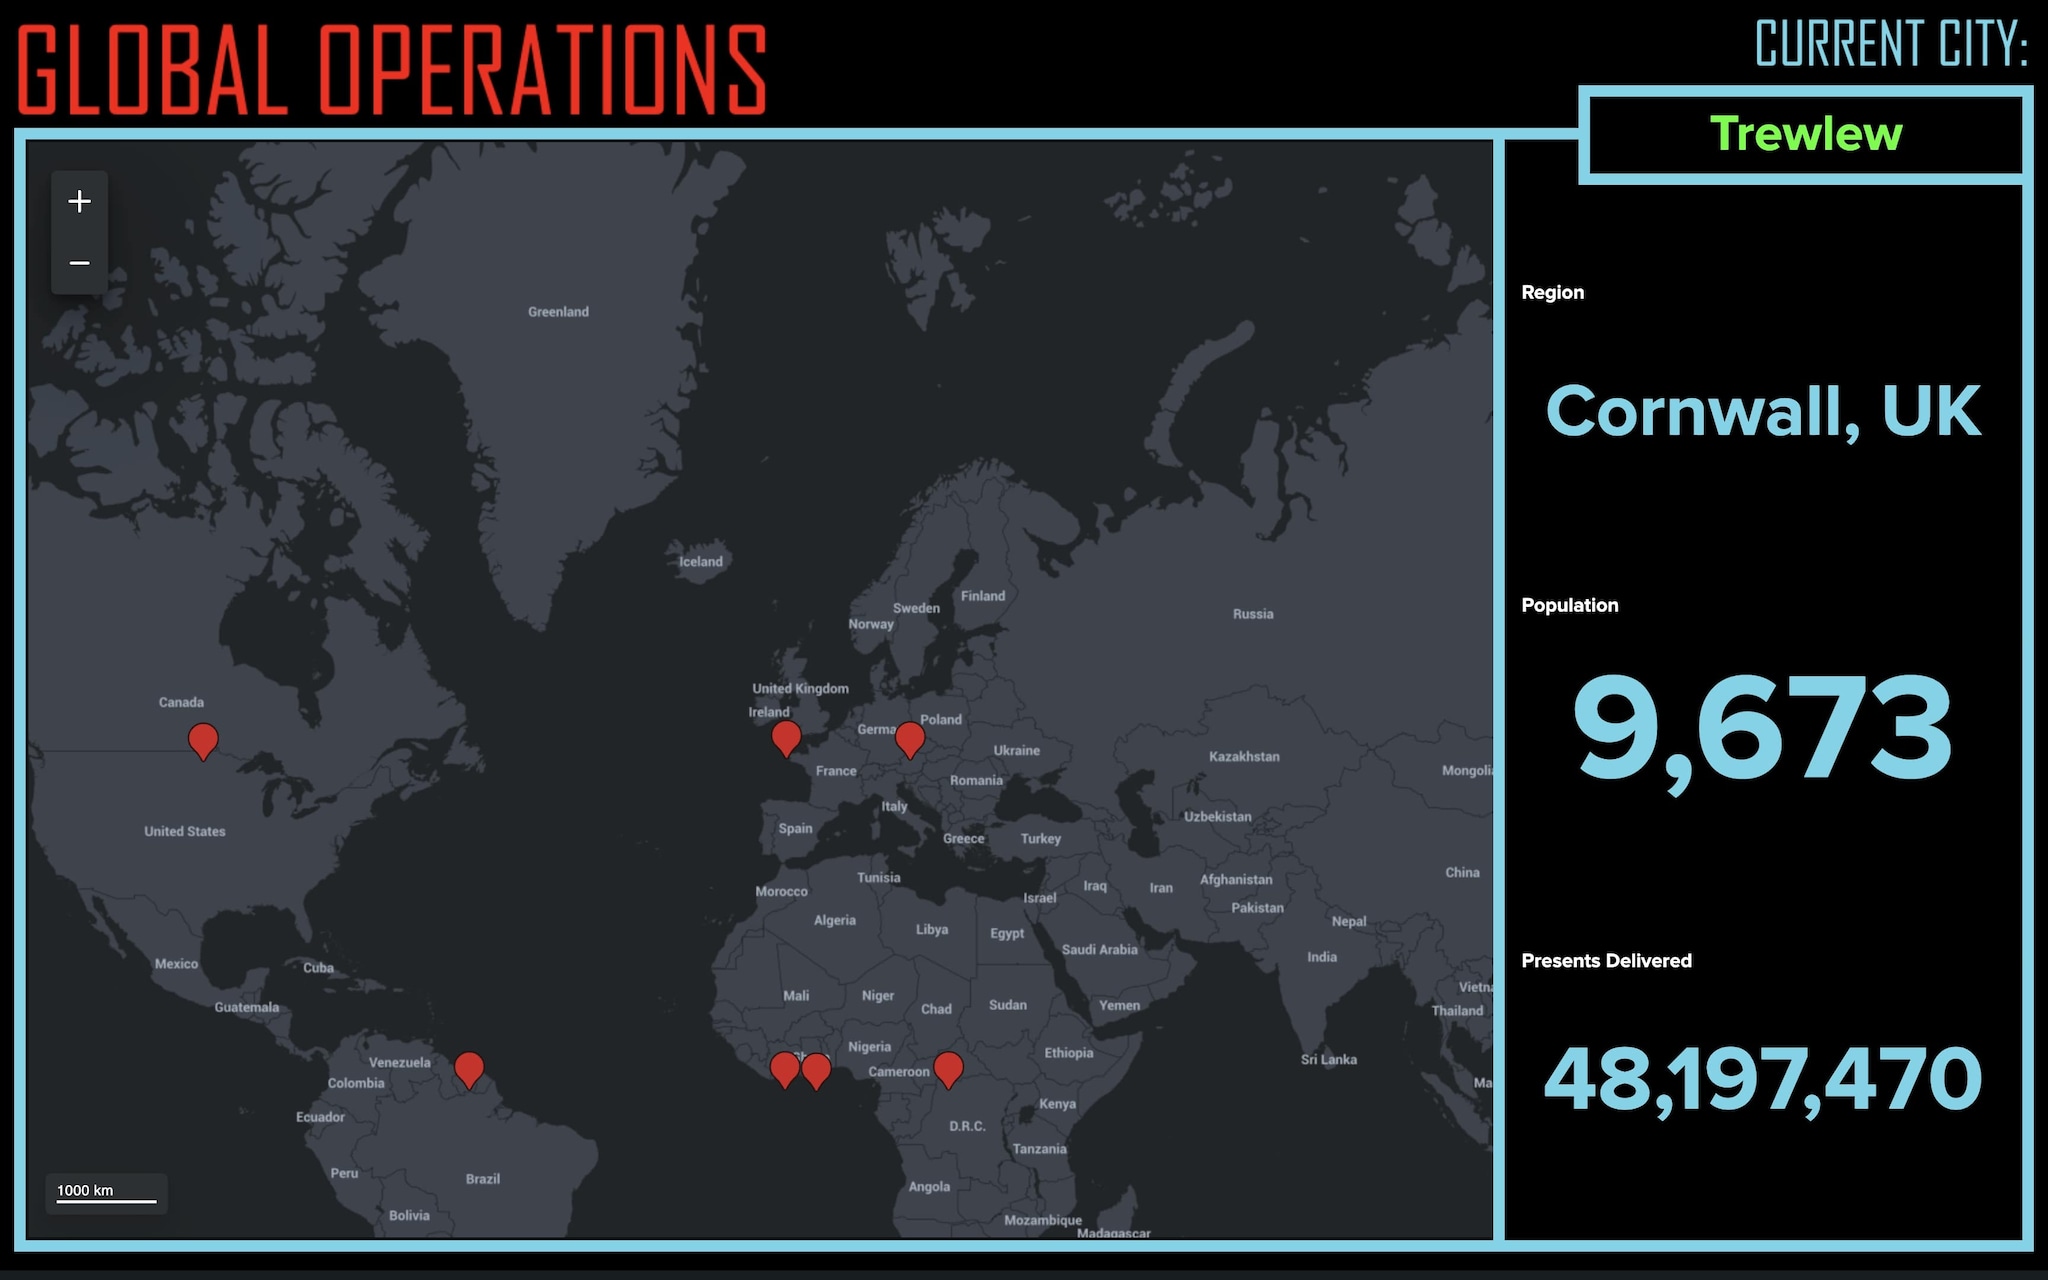
Here in the Santa Operations Centre, Tony the Elf and his team are able to monitor everything from delivery stats to favorite toys in the form of simple visualisations and metrics. Let’s take a deeper look at some of the insights seen from bringing these datasets together into a simple to understand dashboard:
1. Reflecting on Last Year’s Performance
The SOC dashboard starts with a look back at last year’s Key Performance Indicators (KPIs) for the town of Trewlew:
- Santa’s sleigh delivered over 48 million presents worldwide by the time it reached Trewlew.
- This year, details like the town’s population help Santa’s team plan for an even faster and more efficient delivery.
Santa’s delivery team uses these insights to compare performance across previous years and set ambitious goals for the current Christmas season.
2. Tracking This Year’s Targets
Shifting to this year’s data:
- 14,000 presents are required for the 2,418 children on the Nice List in Trewlew—congratulations to them!
- Santa’s team calculates how many presents need to be delivered per second to exceed last year’s performance. After all, Santa isn’t just about "Ho Ho Ho"—he’s all about "Go Go Go!"
By tracking real-time delivery performance, Santa ensures the sleigh stays on schedule, keeping the spirit of Christmas alive for every child on the Nice List until the very last present is delivered!
3. Spotting Trends in Gift Preferences
The dashboard also highlights the most popular toys in the "Favourite Toy" section, providing insights into what’s trending:
- Of the 250 toy trucks on the sleigh, 97 are blue, 77 are red, and 76 are yellow.
- Understanding these trends helps Santa and his elves prepare for future demands on toys, ensuring every child gets the toy of their dreams.
It’s not just about knowing what toys are trending, it’s also about using this data to anticipate inventory needs for next year’s holiday season.

4. Naughty or Nice: Year-Over-Year Analysis
Finally, the dashboard takes a deep dive into the Naughty or Nice Lists, tracking each child’s progress over the years:
- One example is Amelia White, whose streak of improvement sadly took a downturn this year compared to previous years
- On the other hand, George Taylor has shown steady improvement year over year, earning himself a rosy future on the Nice List, thus more demand potentially next year

“Amelia White” vs “George Taylor”
Real-World Applications of Splunk Lookups
While the SOC dashboard might seem like a whimsical use case, Splunk lookups are used by organisations worldwide to solve complex data challenges. Here are some real-world examples:
- Logistics and Supply Chain: Just like Santa’s sleigh team, companies use lookups to match inventory data with customer orders, ensuring timely and accurate deliveries.
- Fraud Detection: Banks enrich transaction data with known fraud patterns to identify and prevent fraudulent activities in real time, keeping customers safe and operations secure.
- Incident Management: IT teams correlate alerts with known error codes to accelerate troubleshooting and reduce downtime, ensuring business continuity even during high-demand periods.
From Santa’s workshop to Fortune 500 companies, Splunk lookups empower teams to make data-driven decisions quickly and effectively. If you’re interested in learning more about the details, visit the Splunk Customer Stories Page.
Call to Action
Want to see what’s next? Stay tuned for our upcoming blog and video, where we’ll explore the single busiest manufacturing line in the world—the North Pole Toy Centre.
Until then, remember: whether you’re optimising toy production or analysing your own operations, Splunk has the tools to keep you on the ‘Nice’ list.
Related Articles
About Splunk
The world’s leading organizations rely on Splunk, a Cisco company, to continuously strengthen digital resilience with our unified security and observability platform, powered by industry-leading AI.
Our customers trust Splunk’s award-winning security and observability solutions to secure and improve the reliability of their complex digital environments, at any scale.


