Look at all the pretty colors!

Well, it’s Sunday here in Las Vegas, and .conf2014 is about to go down. I’m sitting in one of our Splunk University classes at the MGM, with many of our fine customers.
The class is our Power User Bootcamp, and we just finished talking about Splunk’s tagging, event types, and lookup functionalities. One of our more security-minded customers asked “hey – that ability to assign a color to event types in the Splunk search GUI is pretty cool – I’d like to use that to prioritize the events I’m looking at based on the risk profile assigned to a user. From a lookup. Can I do that?”
A second customer said “I like that idea.”
So, since this is Vegas, and there’s lots of pretty colors you can see when you stroll the Strip at night, let’s show you how to make some pretty colors in Splunk, so we don’t have to go outside. (By the way – this exercise is strictly for the standard Splunk web-based search GUI – if you wish to apply pretty colors in a similar way in a Splunk dashboard, check out the various examples provided to do just that in the Splunk 6.x Dashboard Examples app. The “Table Row Highlighting” and “Table Cell Highlighting” examples are relevant. Also, this exercise will only work as written in the default “Search And Reporting” app, which has a custom event renderer already applied to give you these color options. *In order to make this work in your own app, you’d have to copy the resulting eventtypes.conf and event_renderers.conf files that you get from doing this work in the Search and Reporting app into your own app’s “local” directory. And by the way – if you want your own fancy color in there, like “chartreuse” in honor of .conf2014, you can add it in there with a three-digit-hex color code…)
*UPDATE 10/14/2014: You can, in fact, get this to work in your own app. Set up your event types in the Search and Reporting app, and copy the resulting eventtypes.conf and the event_renderers.conf files into your own app structure in the “local” directory. See the graphic at the end.
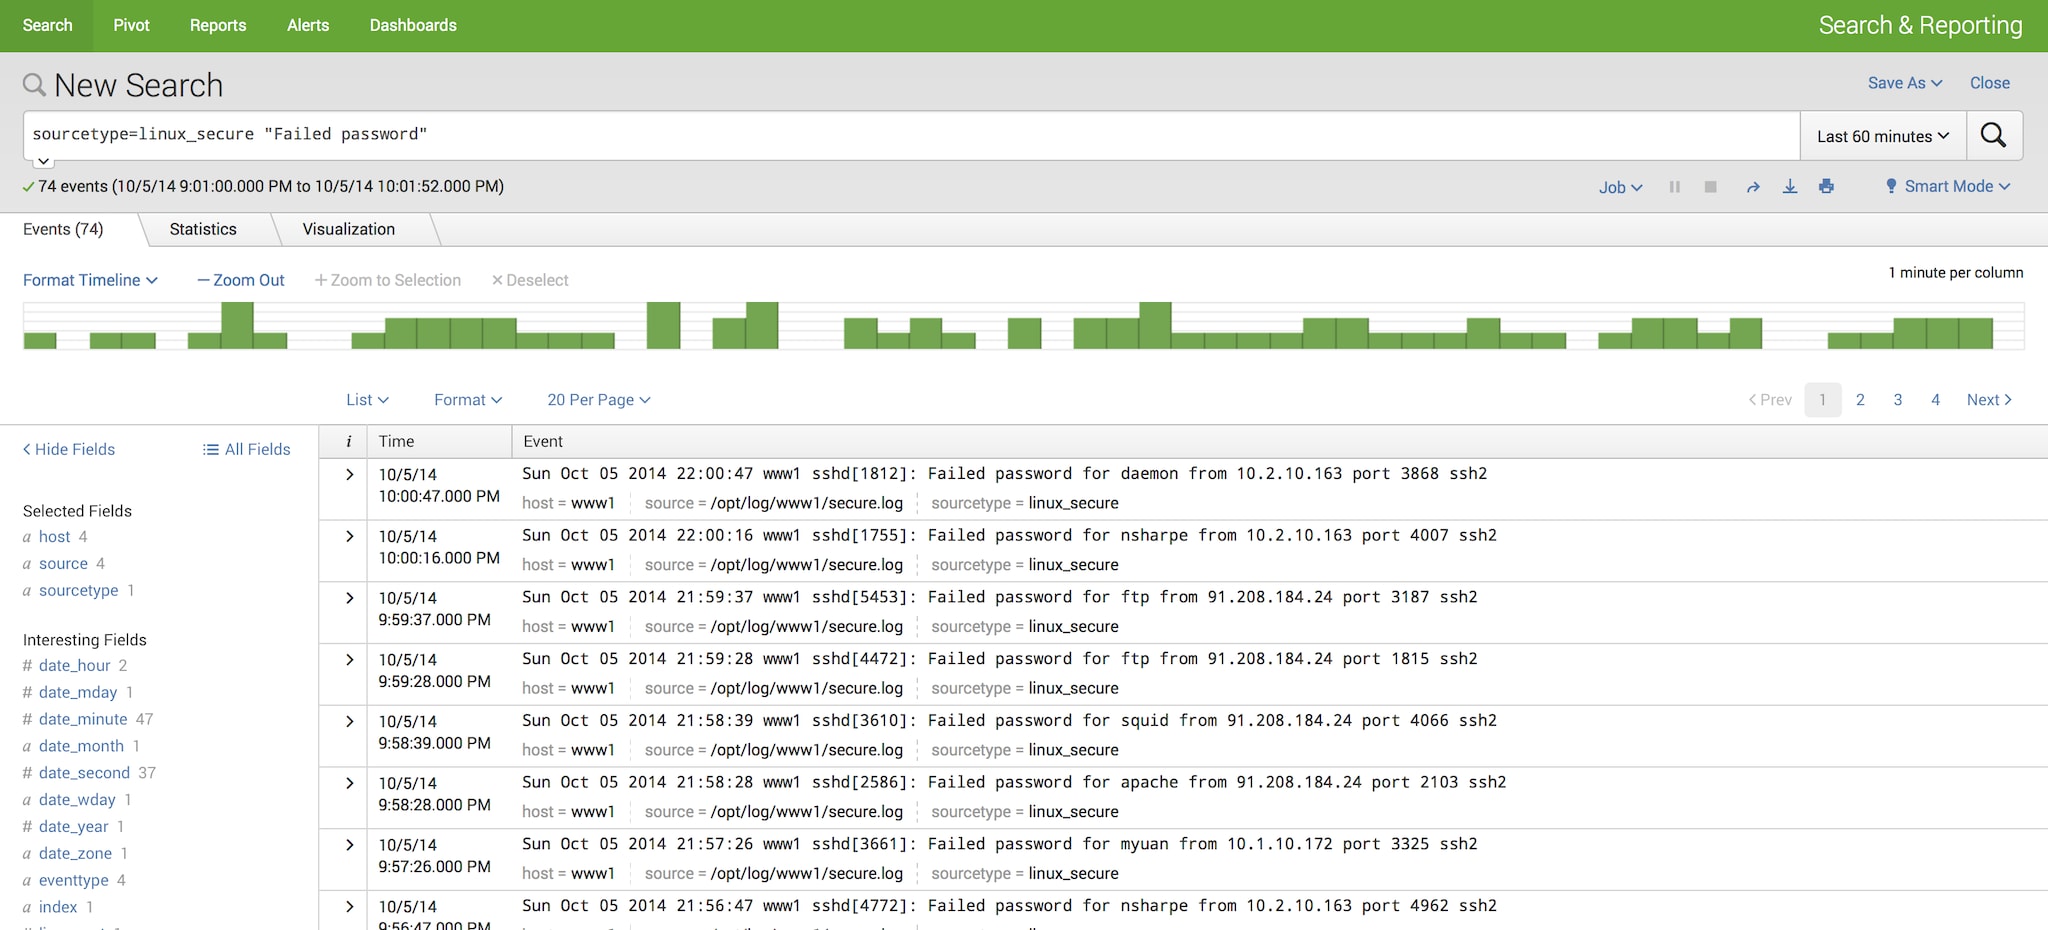
OK. So the idea here is that you’ve done some work in your organization to assign a risk profile to each user. Perhaps a user is a new hire. Perhaps they have not been on vacation for a number of years. Perhaps they are on some sort of HR disciplinary plan – whatever the reason, they might be considered a risk to your organization. Now, we have events in Splunk that might look like this (standard Linux failed login events with usernames):
So you might assign risk in a lookup table like this:
"user","risklevel"
operator,elevated
myuan,normal
ftp,elevated
mail,normal
nagios,high
proxy,high
list,high
errn,low
snowden,high
mitnick,high
For this lookup, we are simply looking for the field “user” in our events, and when we see it, we assign a new field called “risklevel”. I called this file “riskuser.csv” and set it up as an automatic lookup on my sourcetype of “linux_secure.” Risklevel can be “high” or “elevated” or “normal” and if the user is not found in the lookup table, they get assigned a risklevel of “low.”
In a production environment, it would make more sense to lookup the risk level from a database where this data is stored – this would be accomplished with our free DB Connect app.
If we did this right, then our “risklevel” field gets populated automatically when we do the search, like this:
Now, let’s add the colors.
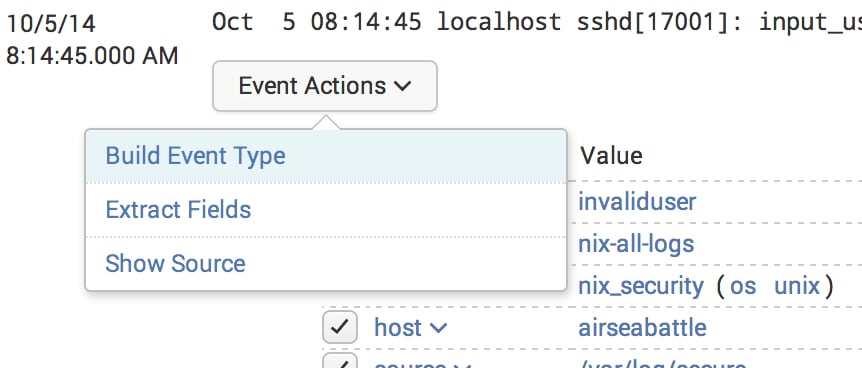
We need to create some event types in Splunk, and then assign appropriate colors to each one of the event types. I’ve chosen to apply green for “low”, blue for “normal”, yellow for “elevated”, and red for “high.” You can do this directly from Splunkweb’s GUI – just create four event types, one for each risklevel. Do this in the Event Types GUI, which you get to by drilling into an event, and then Event Actions->Build Event Type:
My event types are simple: “sourcetype=linux_secure risklevel=high” corresponds to a event type called “highrisk.” And so on, for the three other categories in my lookup – elevated, normal, and low.
Pick a “style” for each eventtype that corresponds to the color you want. By the way – this appears to be a one-way street. Once you assign a color via a style in the Event Types GUI, then the only way to change this (at the time of this writing) is to MANUALLY edit the event_renderers.conf file that gets updated or created within the search app, in either the local directory at the app level or at the individual user level. A more extensive description of this process is best left for another day, when I’m not supposed to be paying attention in class.
If you did this right, you’ll now have pretty colors showing up associated with your events. As we can see below, I have red, yellow, and blue visuals corresponding with the users identified in my lookup file:
Questions? Comments? Type things below. And if you’re in Vegas for .conf, I still think The Flamingo has the most colorful facade on the Strip!
UPDATE 10/15/2014: Here’s a screenshot of this functionality working outside of the Search and Reporting app:
Related Articles
About Splunk
The world’s leading organizations rely on Splunk, a Cisco company, to continuously strengthen digital resilience with our unified security and observability platform, powered by industry-leading AI.
Our customers trust Splunk’s award-winning security and observability solutions to secure and improve the reliability of their complex digital environments, at any scale.


