Dashboard Studio: Tabbed Dashboards
In Splunk Cloud Platform 9.2.2406, Dashboard Studio introduces a number of new features that will streamline and improve your dashboard designing experience: tabbed dashboards, Single Value Radial Gauge, and cloning examples directly from the Examples Hub. In this blog, we'll dive deeper into each of these new features.
Tabbed Dashboards
We hope you're as excited about tabbed dashboards as we are, as we've seen many customers manually build tabbed dashboards in Classic dashboards with custom JS and it's a top 10 upvoted Splunk Idea for Dashboard Studio.
Tabbed dashboards are a great way to help you organize information by logically categorizing different groups of information into separate views within the same dashboard. With tabbed dashboards, you can combine multiple related dashboards into a single dashboard, or break down a large dashboard into multiple views (we'll talk about how we're managing performance below).
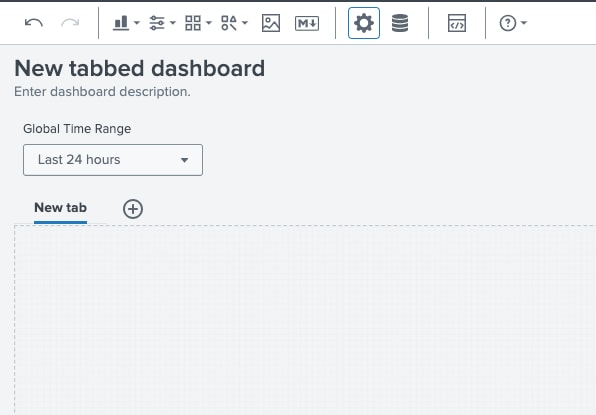
The first thing you'll notice when you upgrade to Splunk Cloud Platform 2.4.2406 is that all new dashboards and all existing dashboards will now have a singular tab when in Edit mode. If there's only one tab in the dashboard, you won't see the tab bar while in View mode.
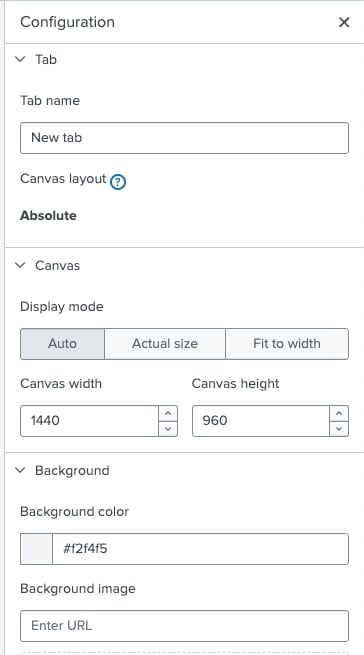
In the configuration panel, you can change the tab name and canvas options for that tab. Your dashboard-level settings like View Options and Preferences are still available to you at the bottom of the configuration panel.
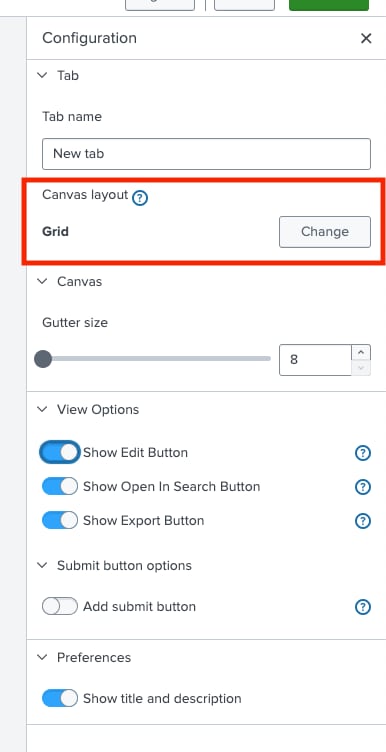
If you have an existing dashboard that was Absolute layout, or you created a new dashboard and selected Absolute layout, the first tab's layout type will be Absolute layout. When you add new tabs, they will be Grid layout by default, but you can change it to Absolute at any time. The only caveat is that this is a one-way trip, and you cannot switch back to Grid layout later.
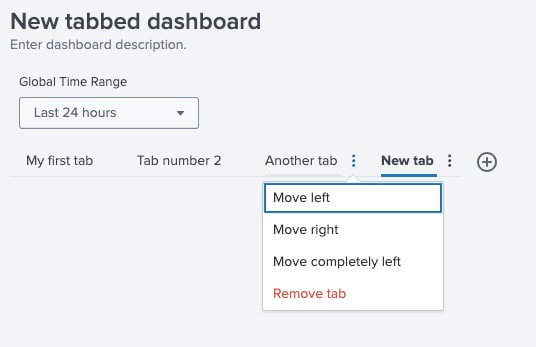
If you have multiple tabs, you can easily reorder them by using the menu on the right side of each tab's name. You can also remove tabs from this menu.
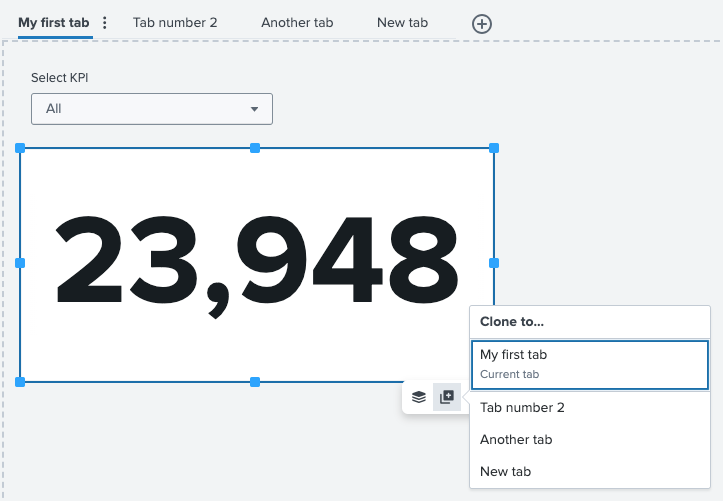
Once you have visualizations or inputs in a tab's canvas, you can easily clone it to another canvas, using the existing clone button.
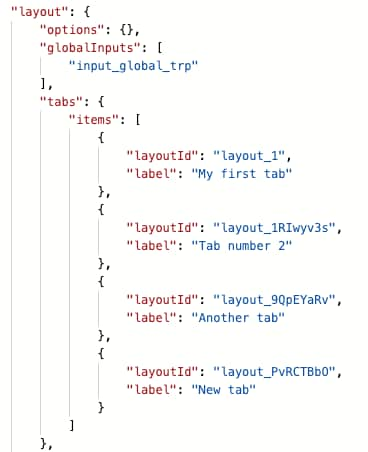
In order to accommodate tabs, we've made a few changes to the source code. Any pre-existing dashboards will be automatically migrated to the new tab-based dashboard definition. Under the layout stanza, you'll see a new section called tabs where you will see the unique IDs and tab names you've specified. They appear in the same order as they are displayed on the canvas.
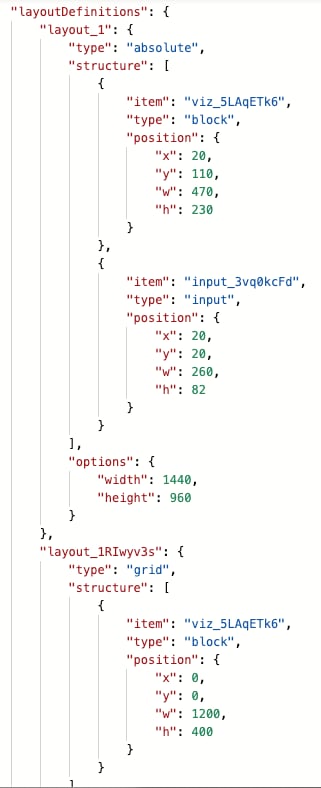
There will also be a new section called layoutDefinitions where you'll see the layout type and what items are included in each tab. In the example below, you can see that the first tab is Absolute layout with two objects and the second tab is Grid layout with one object. You may also notice that the same visualization ID is present in both tabs. That's right, you can share objects between tabs! This is useful if you need to maintain some context or information between tabs.
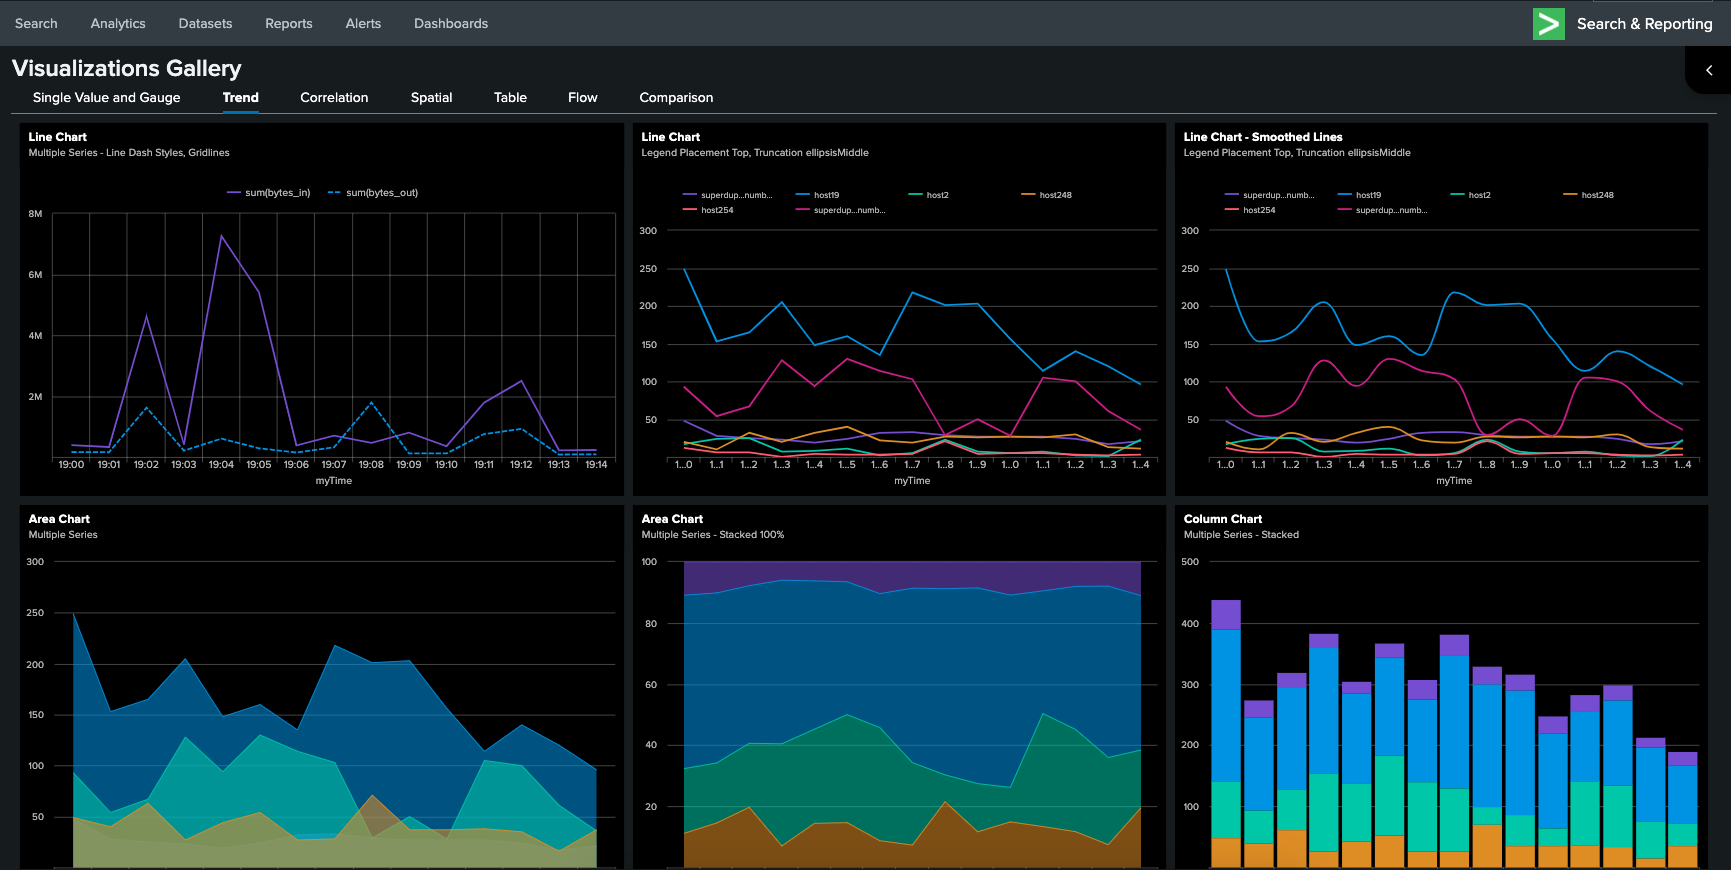
As you can imagine, tabs can be really powerful for condensing a lot of information into one dashboard, like in this Visualizations Gallery example we showcased at .conf24:
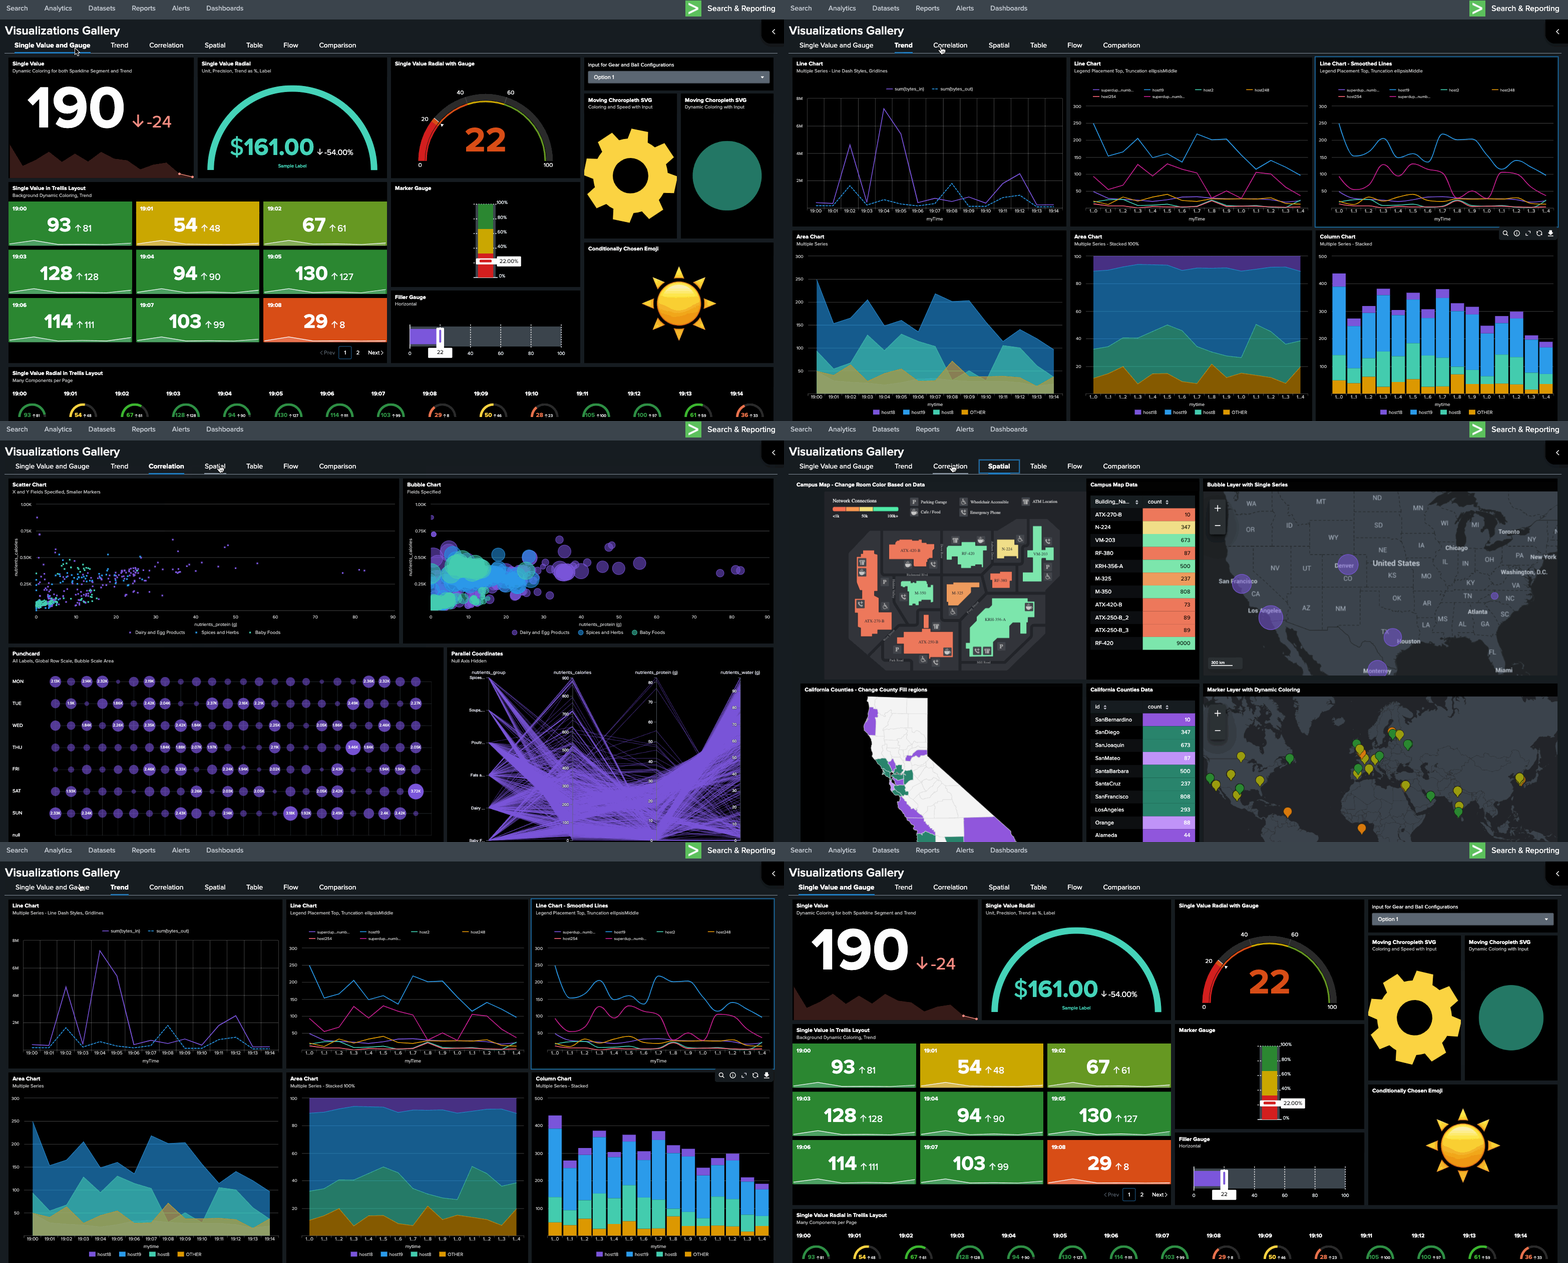
Since tabbed dashboards may have many charts (and therefore many searches) we manage search execution by only loading the searches needed for the tab you are currently viewing and any searches that generate tokens. For example, when you first load a dashboard, only the searches needed for that tab will run. As you navigate to the next tab, only the searches for that next tab will run, and so on. Once the searches run, the results are cached so as you navigate back to a previously viewed tab, the results load instantaneously and do not re-run searches.
Single Value Radial Gauge
In Splunk Cloud Platform 9.2.2406 we also released an updated Single Value Radial, which now has the option to apply a gauge with specified thresholds and colors. If you enjoyed using the Radial Gauge in Classic dashboards, this is a great alternative in Dashboard Studio.
Add a Single Value Radial to your dashboard, then select a Dynamic elements option under Color and style. You'll notice the dynamic coloring options now include gauges.
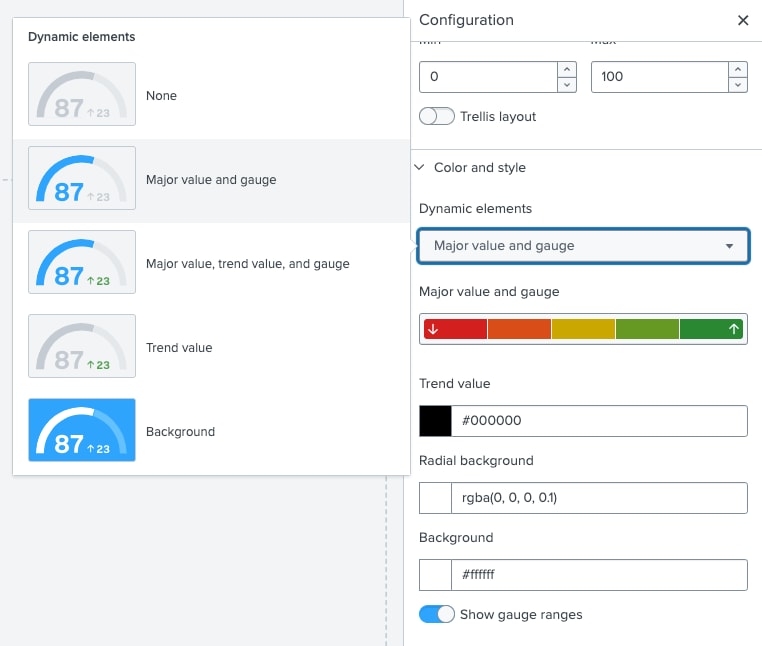
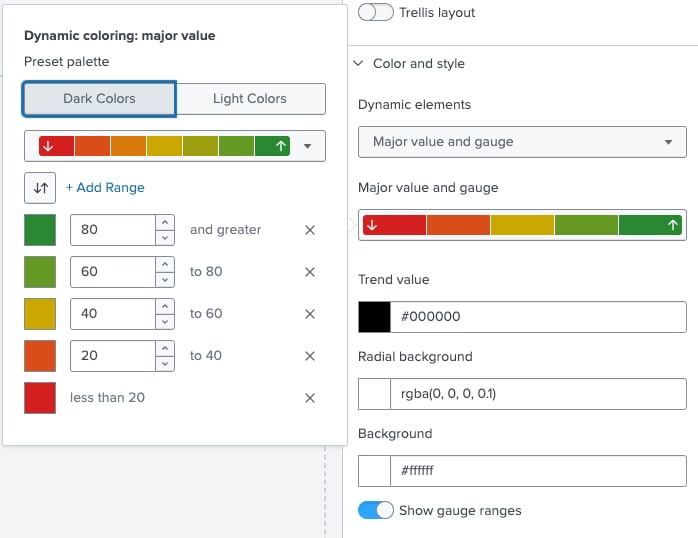
Under Major value and gauge, you can specify thresholds and colors.
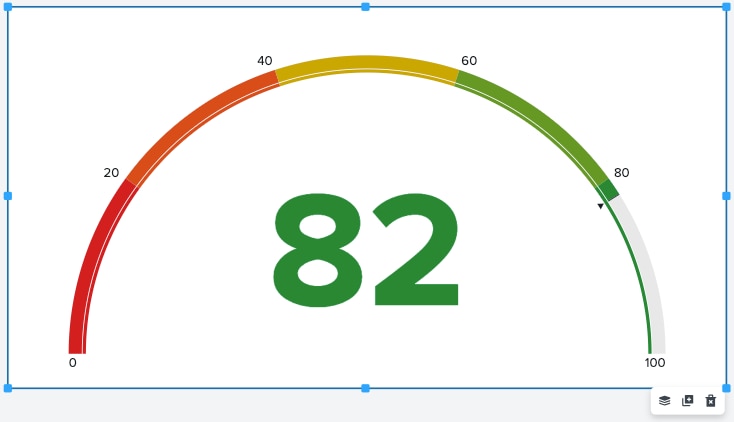
Your Single Value Radial Gauge will look something like this, complete with a marker for where your single value currently sits (82, in this example).
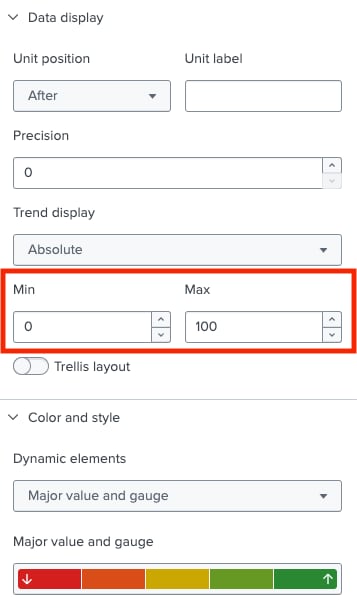
To change the min and max values of your radial gauge to something other than the default 0 and 100, you can do so under Data display:
Clone from Examples Hub
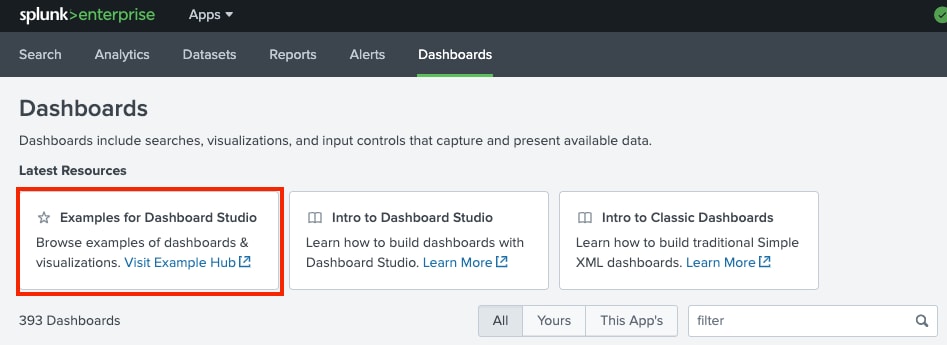
The Dashboard Studio Examples Hub is a resource that comes out of the box with Splunk. You can access it from your dashboards listing page:
The Examples Hub provides examples for individual elements (data sources, inputs, visualizations) and complete dashboard examples.
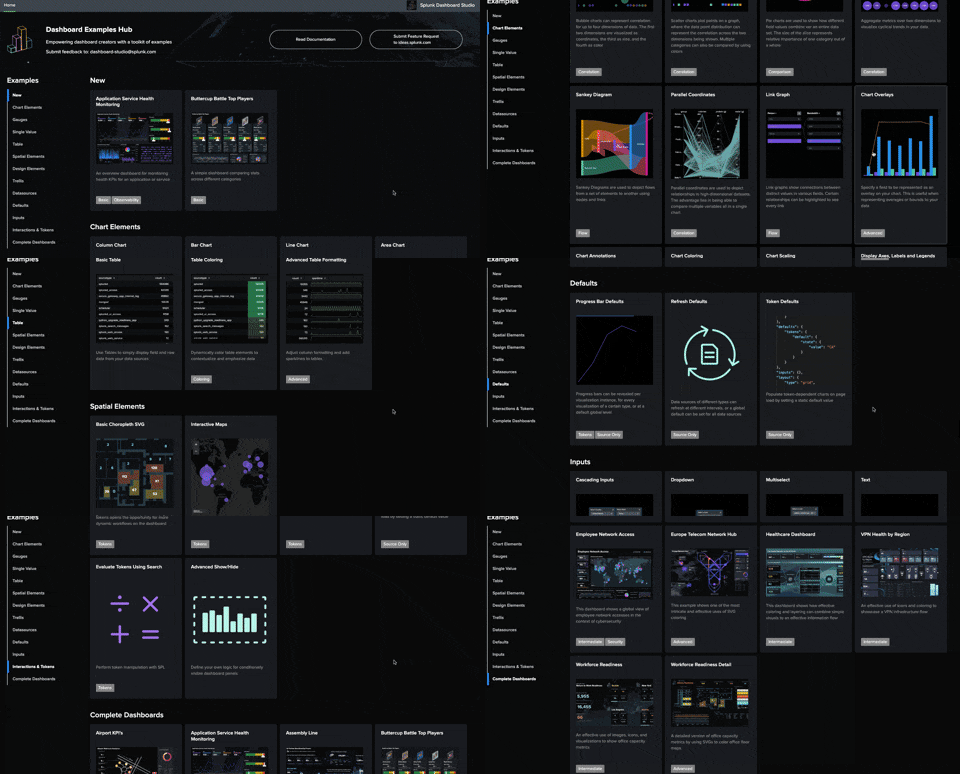
Each complete dashboard example also exposes the dashboard definition, so that you could use the example as a starting point for your own dashboard. In the past, you had to copy and paste the entirety of the definition from the Examples Hub into your own dashboard.
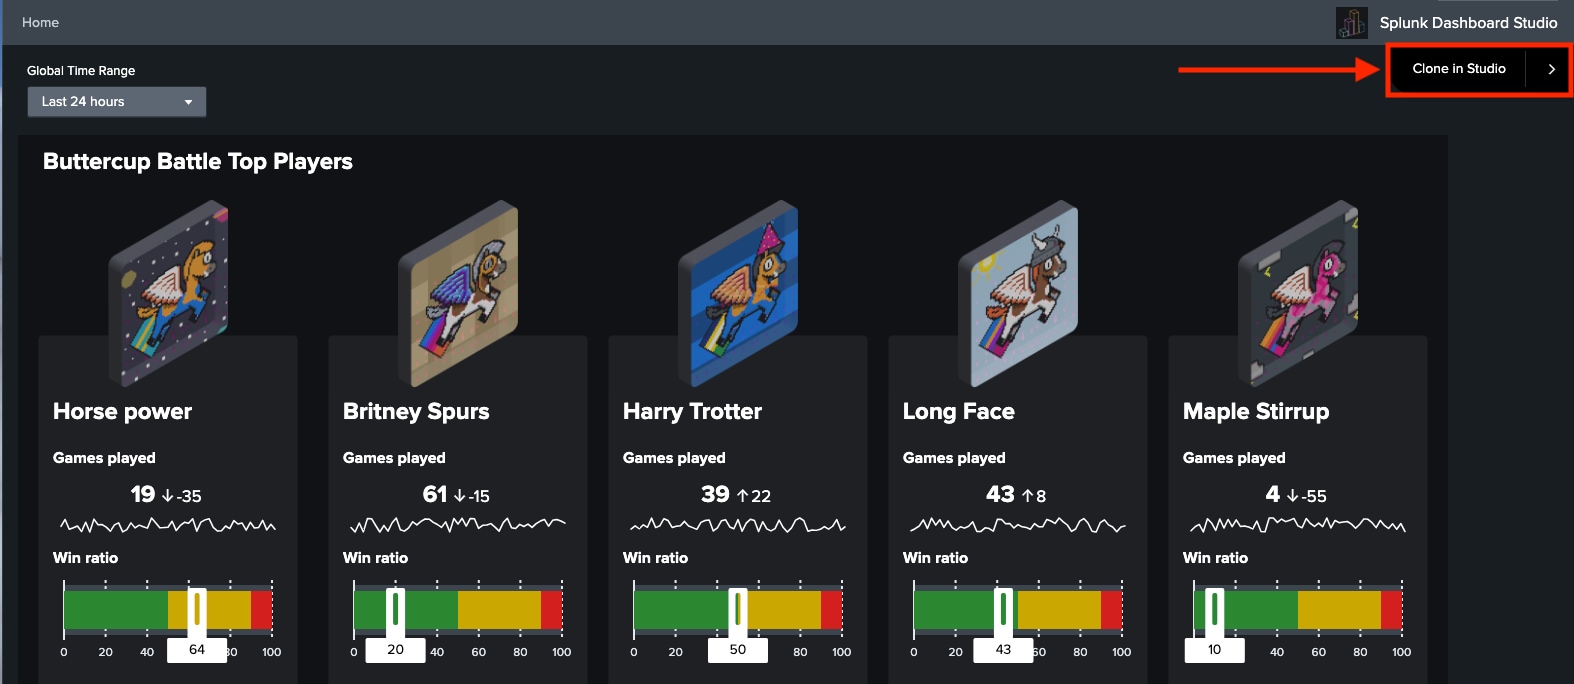
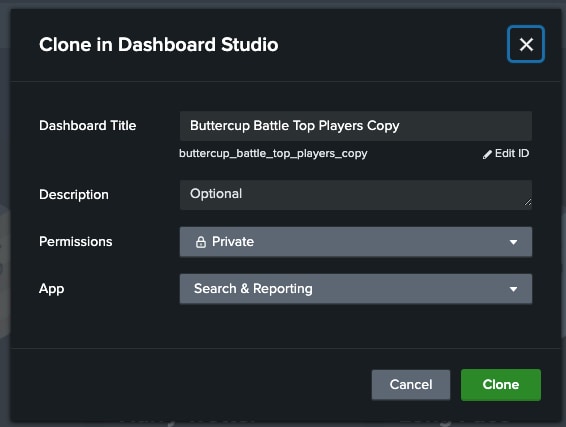
Now, you can use our handy new "Clone in Dashboard Studio" action. In the top right corner of a complete dashboard example, you will see a new button that will allow you to create a dashboard from the example.
Then you can specify a new dashboard name, description, and permissions. You'll also need to specify which app you want your new dashboard to live in.
Coming Soon
Check out Dashboard Studio and send in your feedback through Splunk Ideas, and you might see your feature request listed on a future blog's "coming soon" list! We are continuing to work on new capabilities, which are delivered incrementally with Splunk Cloud Platform and Splunk Enterprise releases.
Next up….
- View dashboards without logging in
- Version history for dashboards
- Collapse Splunk and App bars in dashboards
Helpful Resources
- Dashboard Studio demo
- Dashboard Studio Blogs - Catch up on our other recent updates with Studio
- Dashboard Studio Tutorial
- Improving Dashboard Performance and Resource Usage Tech Talk
- Splunk Dashboard Studio Documentation
- Splunk Ideas - Dashboard Studio for feature or enhancement Requests
- Examples Hub - Find the Examples Hub from the Dashboards page in Search & Reporting
- Splunk Community - Dashboards & Visualizations for questions
* This information is subject to change at any time, at the sole discretion of Splunk LLC and without notice. This roadmap information shall not be incorporated into any contract or other commitment. Splunk undertakes no obligation to either develop or deliver any product, features, or functionality described here.
Related Articles
About Splunk
The world’s leading organizations rely on Splunk, a Cisco company, to continuously strengthen digital resilience with our unified security and observability platform, powered by industry-leading AI.
Our customers trust Splunk’s award-winning security and observability solutions to secure and improve the reliability of their complex digital environments, at any scale.
