Dashboard Studio: Sweating the Small Stuff
In 2022, we shipped Dashboard Studio updates focused on addressing the "little things": enhancements that, although small, alleviated paper cuts and improved feature capabilities. We've decided to do that again, and in Splunk Cloud Platform 9.1.2402, we have a new list of small stuff we've addressed.
New Examples Hub Dashboards
We've added two new dashboards to the Examples Hub, so that you have even more options to peruse when looking for inspiration or a dashboard to customize for your own needs.
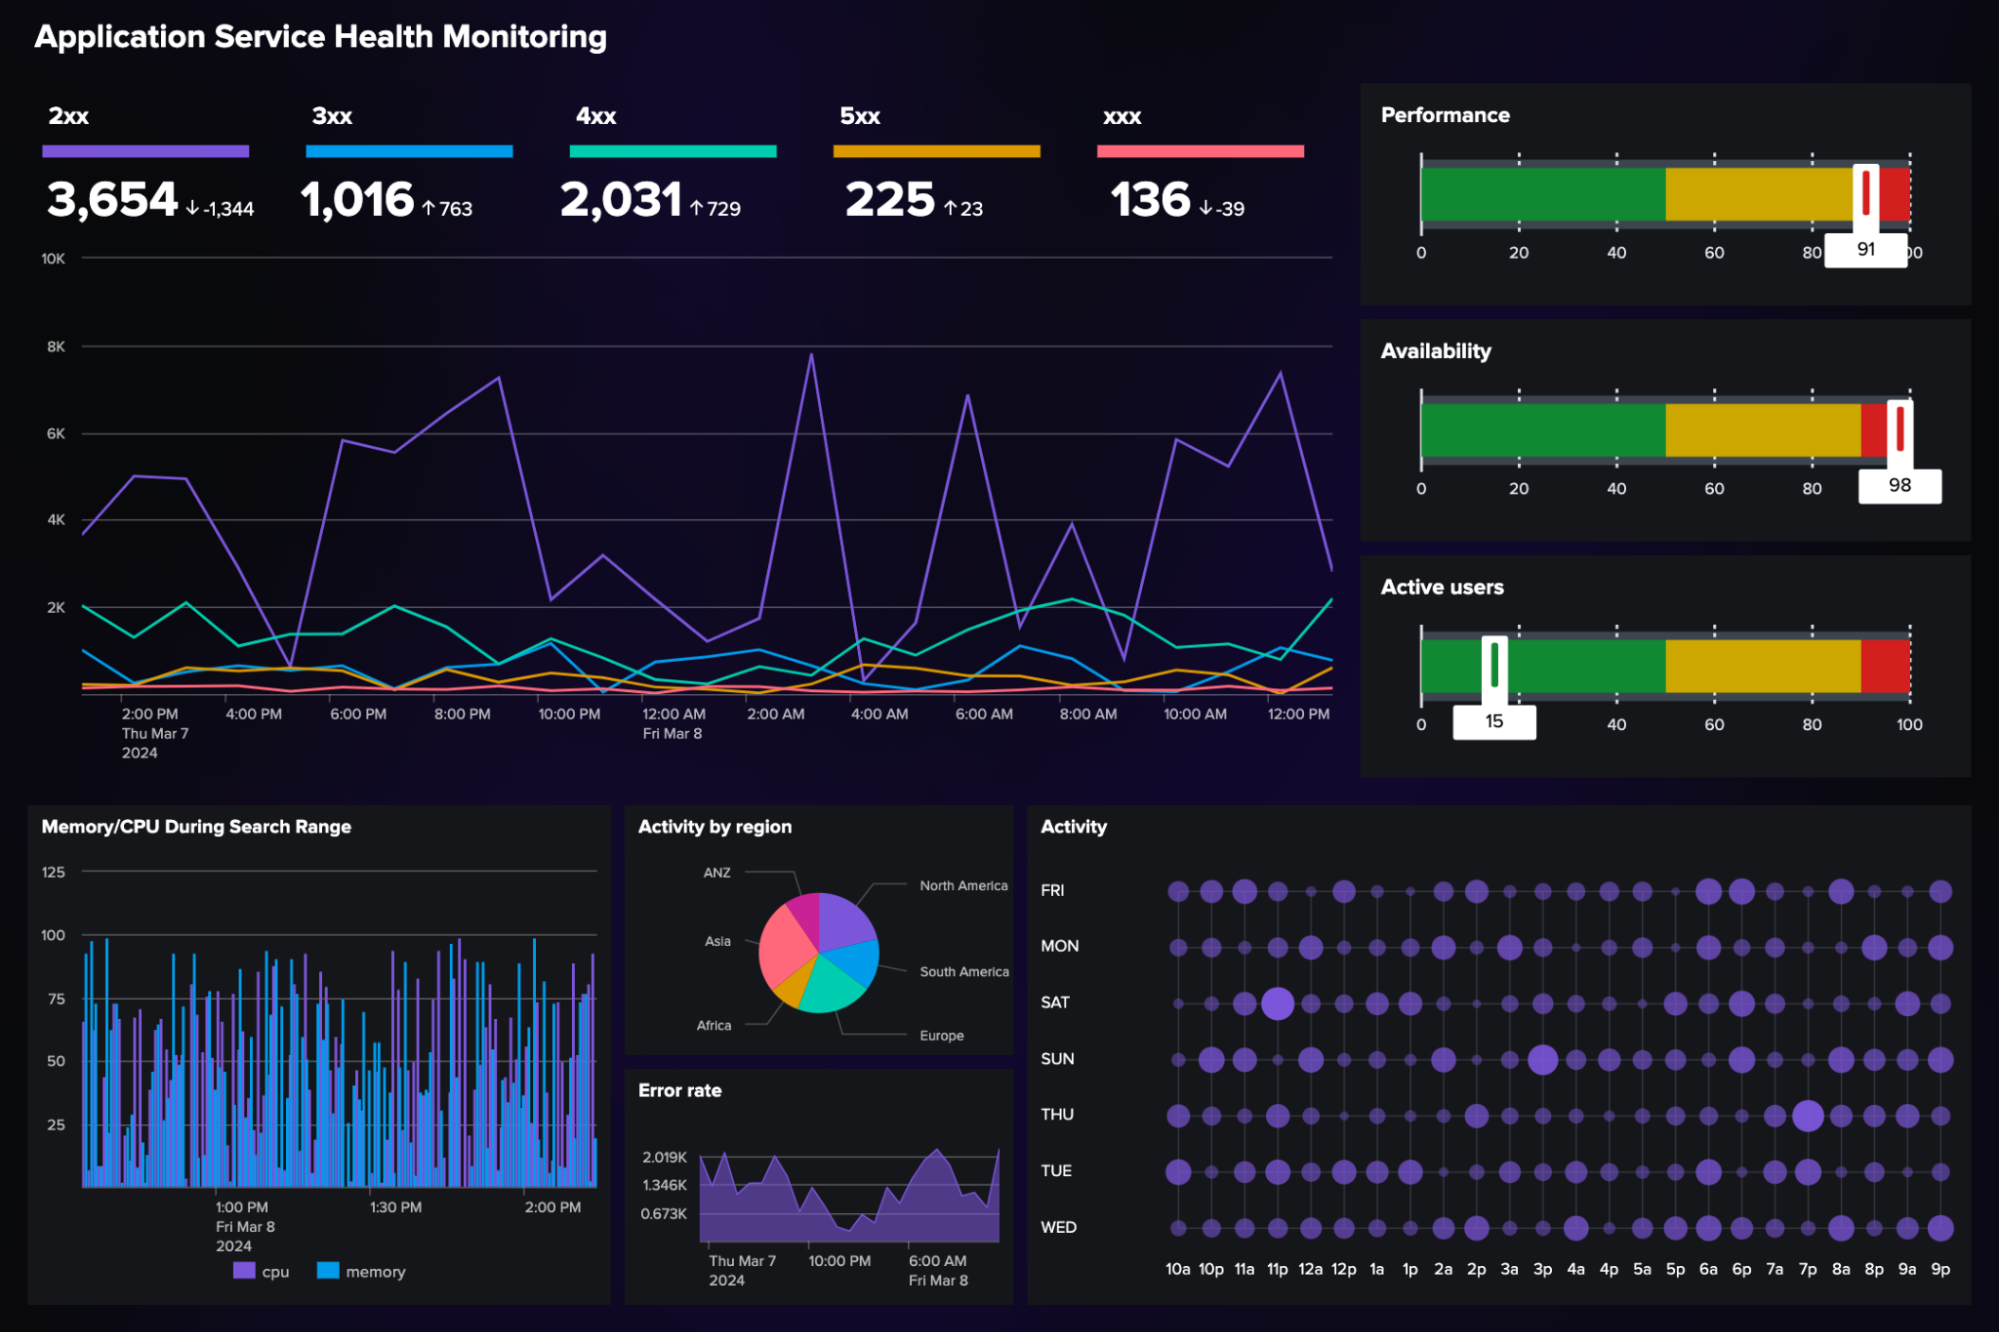
This is an example of an application service health monitoring dashboard which features a straightforward layout that is easy to replicate in both Absolute and Grid layouts.

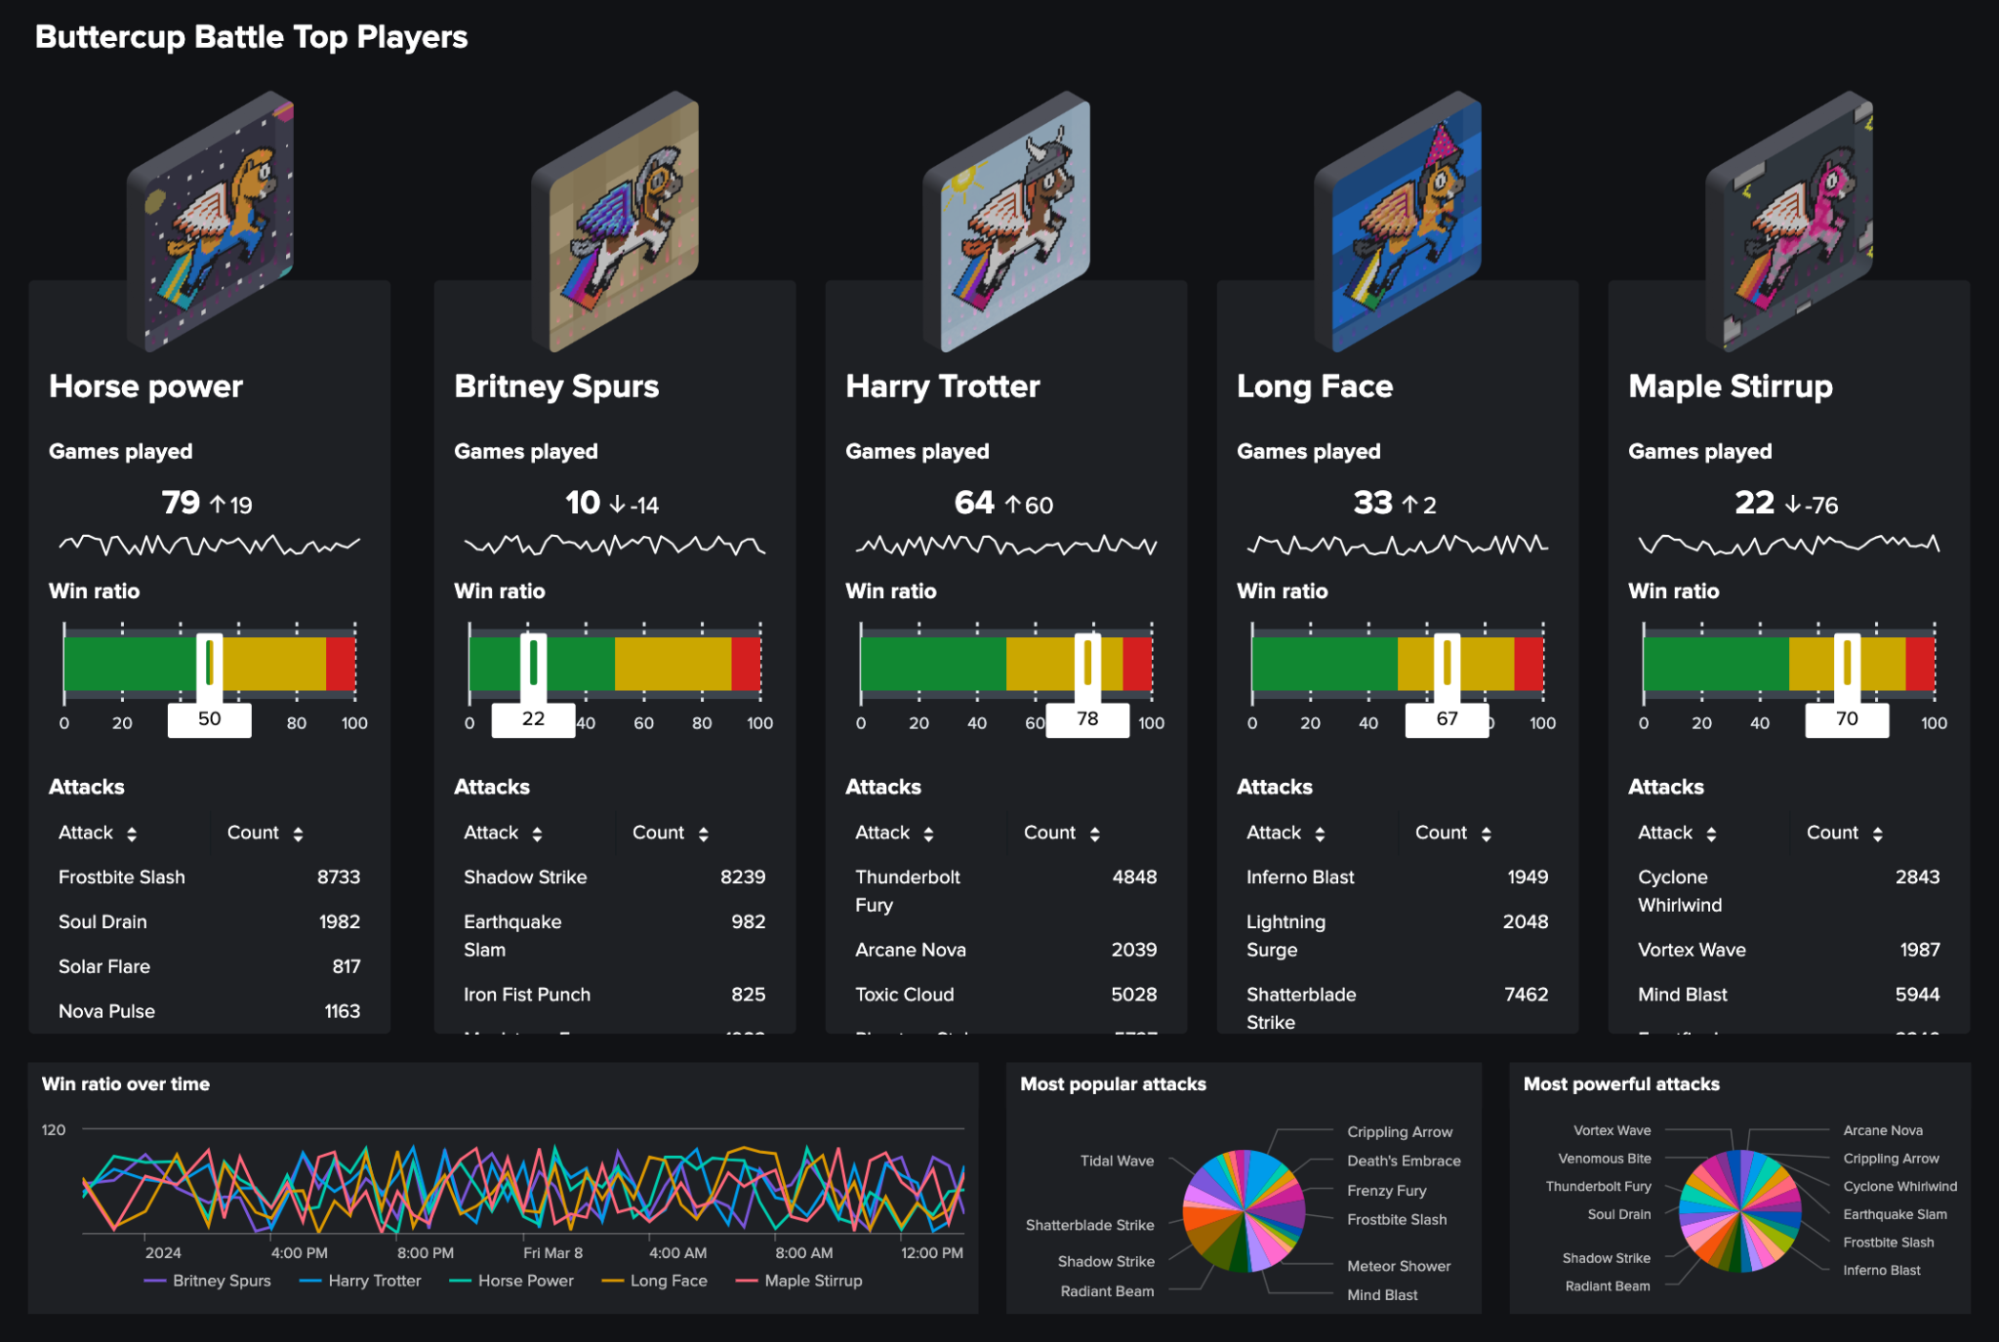
This next dashboard was inspired by our Dashboard Studio based Buttercup Battle game we showcased at .conf23. This example shows one way you can compare multiple entities to one another.
Visualizations Improvements
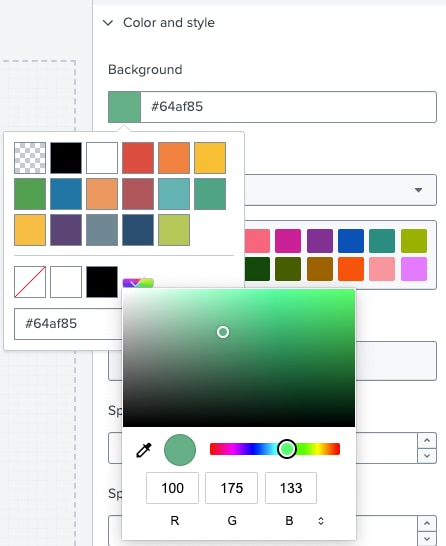
When picking a new color to apply to your charts, you can now use a full color picker from within Dashboard Studio.
You can also use new source code options to specify the color of the title and description in a given panel.
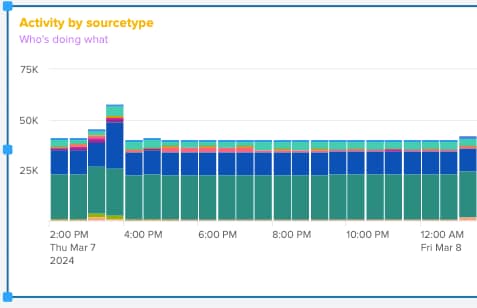
The source code will look something like this:
{
   "type": "splunk.column",
   "dataSources": {
       "primary": "ds_3oyEA5Ie"
   },
   "title": "Activity by sourcetype",
   "description": "Who's doing what",
   "containerOptions": {
       "title": {
           "color": "#fcba03"
       },
       "description": {
           "color": "#b103fc"
       }
   },
    "options": {
       "stackMode": "stacked",
       "backgroundColor": "#ffffff"
   },
   "context": {},
   "showProgressBar": false,
   "showLastUpdated": false
}
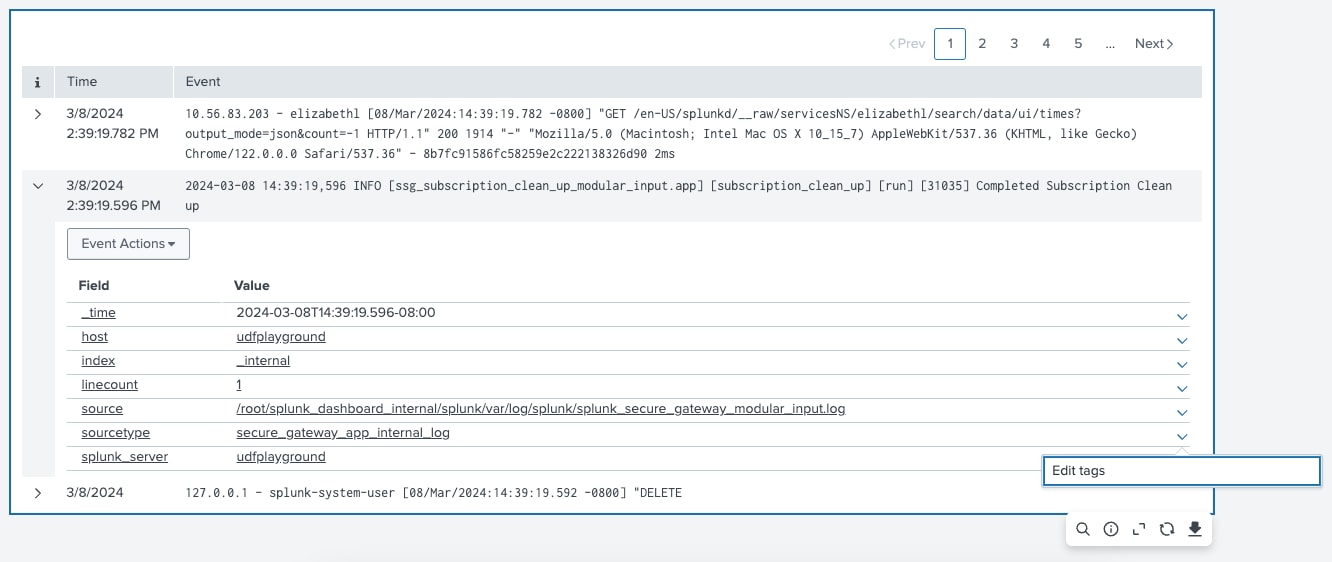
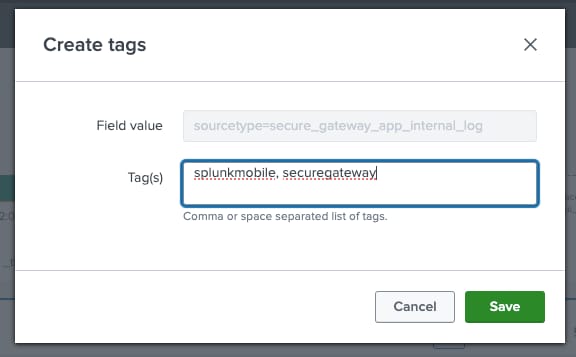
We've also updated the Events Viewer so that you can now edit tags directly from within your dashboard. On a given field-value pair, select "Edit tags" from the Action menu.
Scheduled Export Enhancements
We first released Scheduled Export for Dashboard Studio in Splunk Cloud Platform 9.1.2312, which had a few limitations captured in our release notes.
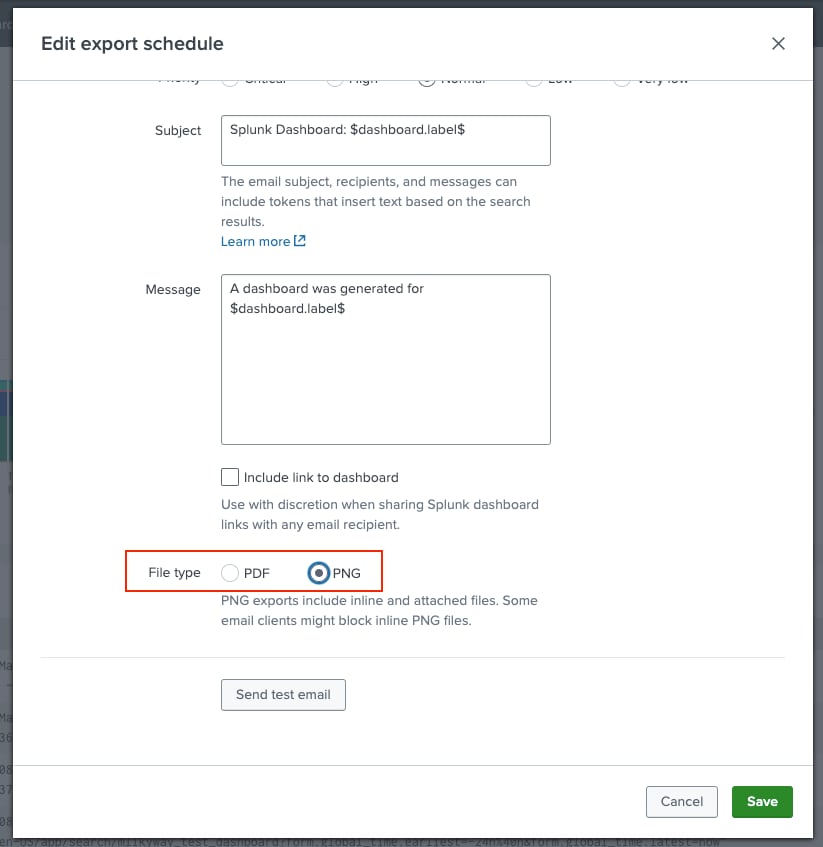
In this latest release, Scheduled Export for Dashboard Studio now supports PNG attachments in addition to PDF.
You will also now be able to include map visualizations and search-based tokens in your Scheduled Export.
Add and Rearrange Multiple Interactions
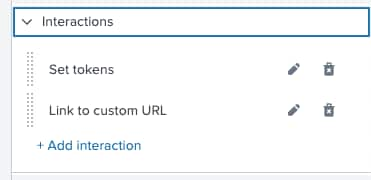
You may have use cases for adding multiple interactions on a given visualization such as setting a token that is used to both filter other panels and passed in a drilldown to a custom URL. We have now introduced UI to allow you to add multiple interactions, and rearrange them.
The order in which the interactions appear is the order in which they will execute. Simply drag and drop to rearrange your interactions.
Coming Soon
Check out Dashboard Studio and send in your feedback through Splunk Ideas, and you might see your feature request listed on a future blog's "coming soon" list! We are continuing to work on new capabilities, which are delivered incrementally with Splunk Cloud Platform and Splunk Enterprise releases.
Next Up….
- Tabbed dashboards
- Trellis for axes charts
- Read-only access for dashboards
Helpful Resources
- New! Dashboard Studio demo
- Dashboard Studio Blogs - Catch up on our other recent updates with Studio
- New! Dashboard Studio Tutorial
- Improving Dashboard Performance and Resource Usage Tech Talk
- Splunk Dashboard Studio Documentation
- Splunk Ideas - Dashboard Studio for feature or enhancement RequestsExamples Hub - Find the Examples Hub from the Dashboards page in Search & Reporting
- Splunk Community - Dashboards & Visualizations for questions
This information is subject to change at any time, at the sole discretion of Splunk LLC and without notice. This roadmap information shall not be incorporated into any contract or other commitment. Splunk undertakes no obligation to either develop or deliver any product, features, or functionality described here.
Related Articles
About Splunk
The world’s leading organizations rely on Splunk, a Cisco company, to continuously strengthen digital resilience with our unified security and observability platform, powered by industry-leading AI.
Our customers trust Splunk’s award-winning security and observability solutions to secure and improve the reliability of their complex digital environments, at any scale.


