Dashboard Design: Getting Started With Best Practices (Part 1)

Every day, dashboards are viewed more than 500,000 times at Splunk. They’re what make the sea of data intelligible and help tell a story when working with a team. However, constant net-new dashboard creation is not necessarily a value-add activity — it’s a workflow to rapidly turn data into doing. Whether it’s just you or a team of 100, the dashboards you share should tell a meaningful story, provide actionable insight to viewers and not have to be duplicated and slightly tweaked to only become outdated a week later. We want to help you create dashboards that can be updated, reused and extended for maximum benefit and efficient insight.
In our .conf22 talk on Dashboard Design and Best Practices we go over a step-by-step walkthrough of how to approach building effective dashboards. This, in addition to the examples and resources we’ve outlined below, aims to provide resources to be expanded in the future.
Dashboard Principles and Best Practices
The first step we outline in our Dashboard Design and Best Practices is understanding the story you want to tell. Your intended audience, purpose and their resulting actions will influence:
- If you need a new dashboard, or can update an existing one
- What template you can use
- Which portions of the template you should update
- The data you need to collect and display
Once you’ve written down and established the story, you may review existing examples of dashboards to copy and adapt. We’ve outlined a few below to give you a heads start and use as a reference framework to follow when creating your own dashboard.
Templates and Examples
The first set of examples we’ll walk through provide templates for monitoring. You can monitor security posture, system operations and more.
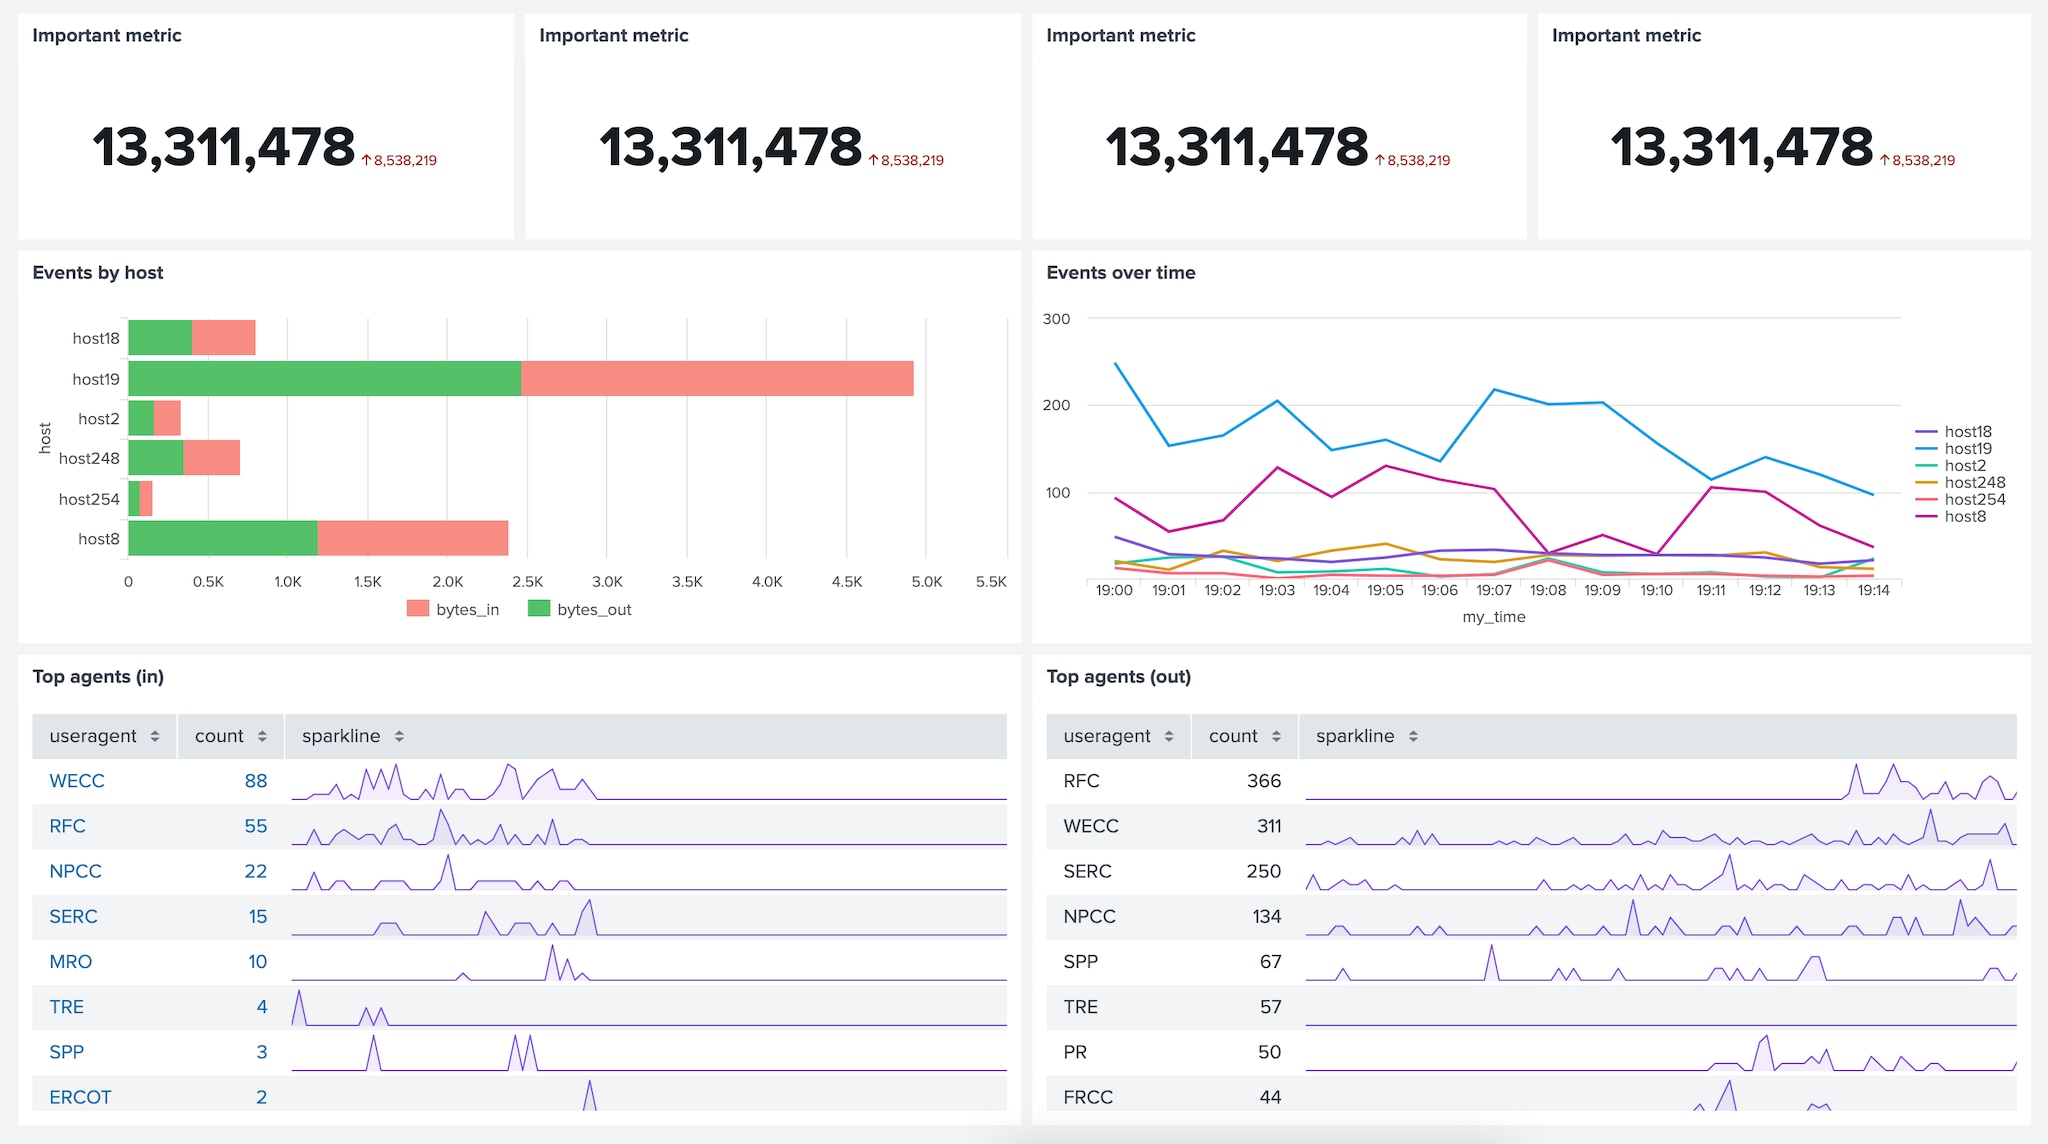
Here we’d like to monitor security posture, taken from Splunk Enterprise Security. Notice the metrics at the top are discrete items we can list side-by-side.

Alternatively, if the items are connected or can be better displayed spatially, you may use the following template. Spatial elements can include choropleth SVGs, maps or even shapes leveraging absolute layout.

Notice the above monitoring examples made use of both grid and absolute layouts. While grid layout groups components naturally, absolute layout requires additional spacing, alignment and can have shapes in the background. Ensure these shapes for grouping are subtle in contrast and have enough whitespace in-between to avoid distracting from the information at-hand. Use grid layout for a simpler set up and absolute layout if you think icons and positioning will be especially helpful for identifying metrics.
Keep in mind that a monitoring dashboard should provide 1) quick context, 2) key information, and 3) indication of action and how to do so if necessary. This is a common workflow for viewers and therefore should be optimized to minimize user clicks and simplify repetitive tasks to increase efficiency in their daily routine. Within one screen view, these examples…
- Include descriptions and metrics at the top of the dashboard to give brief context on the task at hand so that any viewer can understand what they’re supposed to look out for
- Provide insight on these metrics over time, or by category as relevant information to fully understand the current state
- Have detailed, further investigable data at the bottom if action is necessary with corresponding descriptions on how viewers can take action

They also…
- Display only the most necessary components to provide information
- Include inputs which can help filter and cater this same view to multiple cases
- Make use of color to communicate status
- Leverage smart sources to add context about the specific view at-hand
Next Steps
Now that you know some best practices, we encourage you to get building! Please check out our helpful resources below, especially our use case templates that provide a stencil as you get started. If you prefer a more structured way of learning, be sure to check out our dashboard courses. Also keep an eye out for more templates and resources as we continue to expand our tools and use cases.
Helpful resources
- Monitoring template: discrete metrics
- Monitoring template: system metrics
- Dashboard Studio Tutorial
- Dashboard Studio Tech Talk
- Splunk Dashboard Studio Documentation
- Examples Hub - Find the Examples Hub from the Dashboards page in Search & Reporting
- Splunk Ideas - Dashboard Studio for feature or enhancement Requests
- Splunk Community - Dashboards & Visualizations for questions
This blog was co-authored by Tara Yuen.
* This information is subject to change at any time, at the sole discretion of Splunk LLC and without notice. This roadmap information shall not be incorporated into any contract or other commitment. Splunk undertakes no obligation to either develop or deliver any product, features, or functionality described here.
Related Articles
About Splunk
The world’s leading organizations rely on Splunk, a Cisco company, to continuously strengthen digital resilience with our unified security and observability platform, powered by industry-leading AI.
Our customers trust Splunk’s award-winning security and observability solutions to secure and improve the reliability of their complex digital environments, at any scale.


