Convert Scheduled Dashboards to Dashboard Studio in Splunk Enterprise 9.3
This blog post will cover Scheduled Export for Dashboard Studio, what's supported, and how to convert your scheduled Classic dashboards to Dashboard Studio.
Scheduled Export for Dashboard Studio
If you export Classic dashboards, you know that there are a number of limitations:
- The export loses the layout and any styling applied to the dashboard
- You can't use dark mode
- You can't include inputs or other token evaluation
The new scheduled export feature for Dashboard Studio addresses all of these issues.
Layout and Styling
With Scheduled Export for Dashboard Studio, it is finally possible to have your export (PDF or PNG) actually match what the dashboard is supposed to look like. Below is a screenshot showing a dashboard loaded in a web browser (left) and its exported PDF (right).
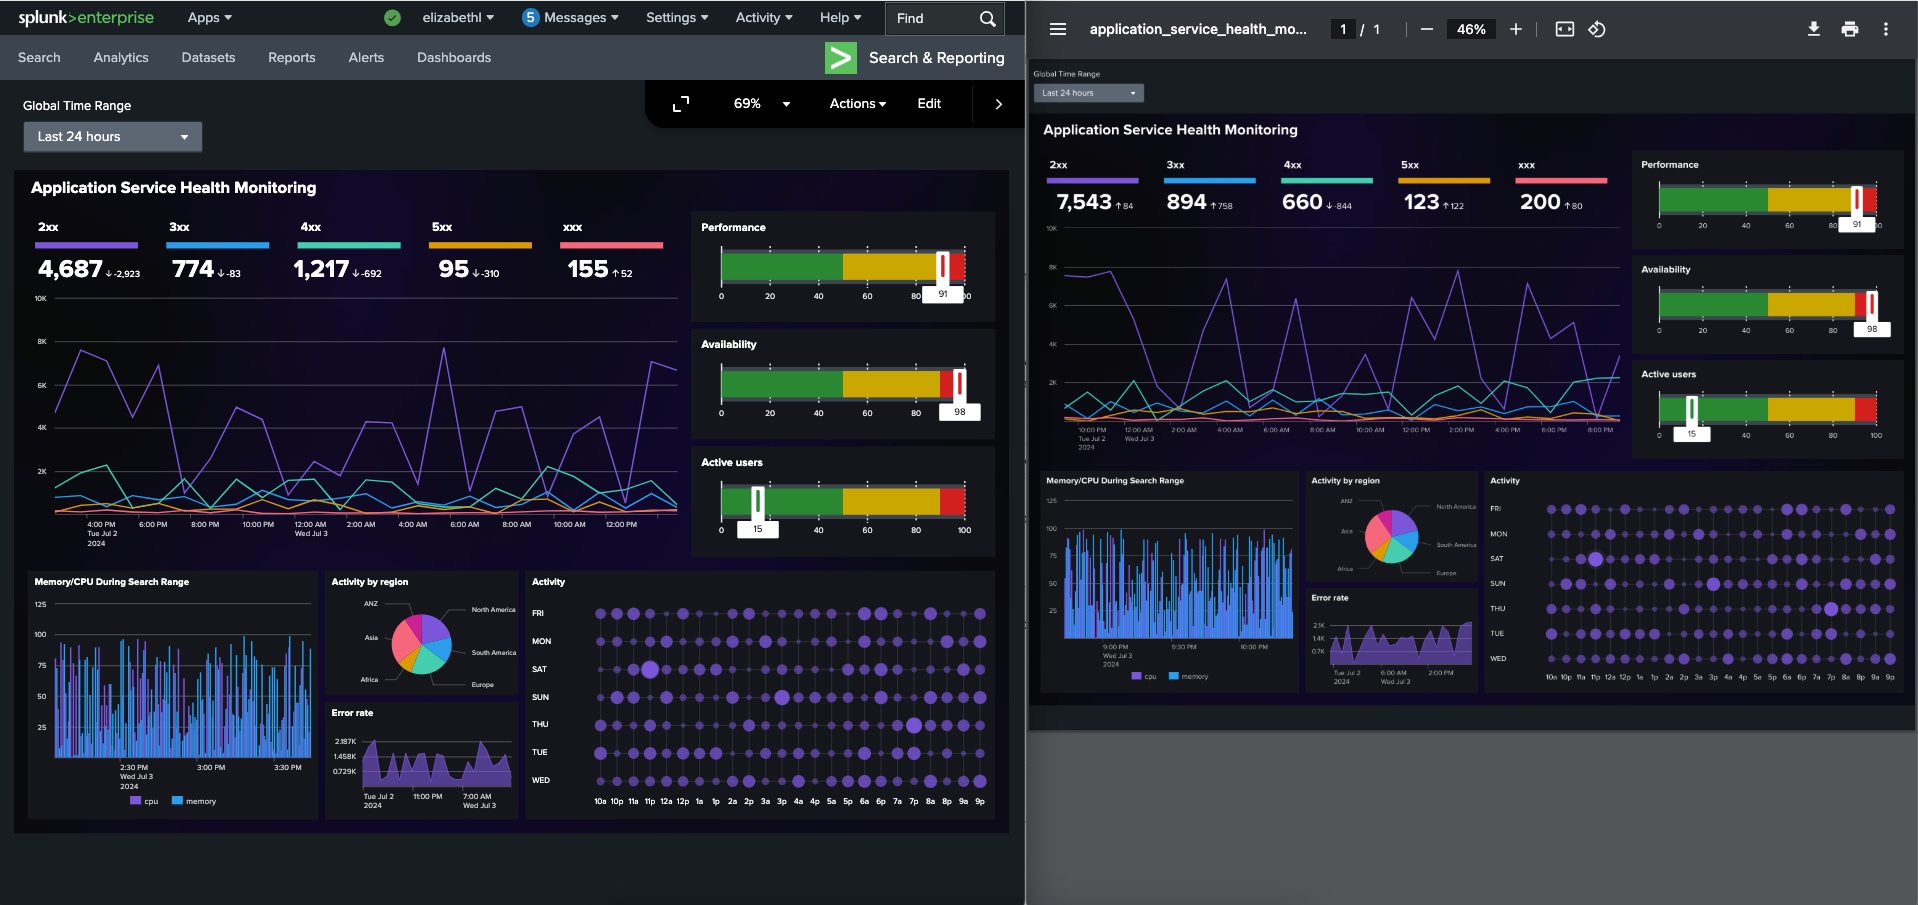
As you can see, the layout and styling is maintained between the dashboard and the export. In particular, you may notice that there are thin, color rectangles and free form text (the title and the status codes) that are present in both, and that this dashboard uses dark mode.
You may notice that the data in the line charts and single values are different — that is because we are running all the searches in the dashboard when we render the export, meaning the data may have updated by the time you reload the dashboard in the browser.
Inputs and Tokens
With Classic dashboard exports, your dashboard has to be fairly rigid and static because token support is limited. You cannot set default tokens or search tokens, you would have to hardcode any values you want to use in the dashboard.
By contrast, Scheduled Export for Dashboard Studio allows you to maintain your dynamic dashboards because it can use tokens set from inputs and search results. Let's talk about the implications of this capability.
With Dashboard Studio, we will resolve any default input values (which can be driven by searches) and tokens set from search results to run the other searches in your dashboard. For example, imagine you have a dashboard which shows occupancy per campus per floor, and you want the export to show the highest occupancy floor.
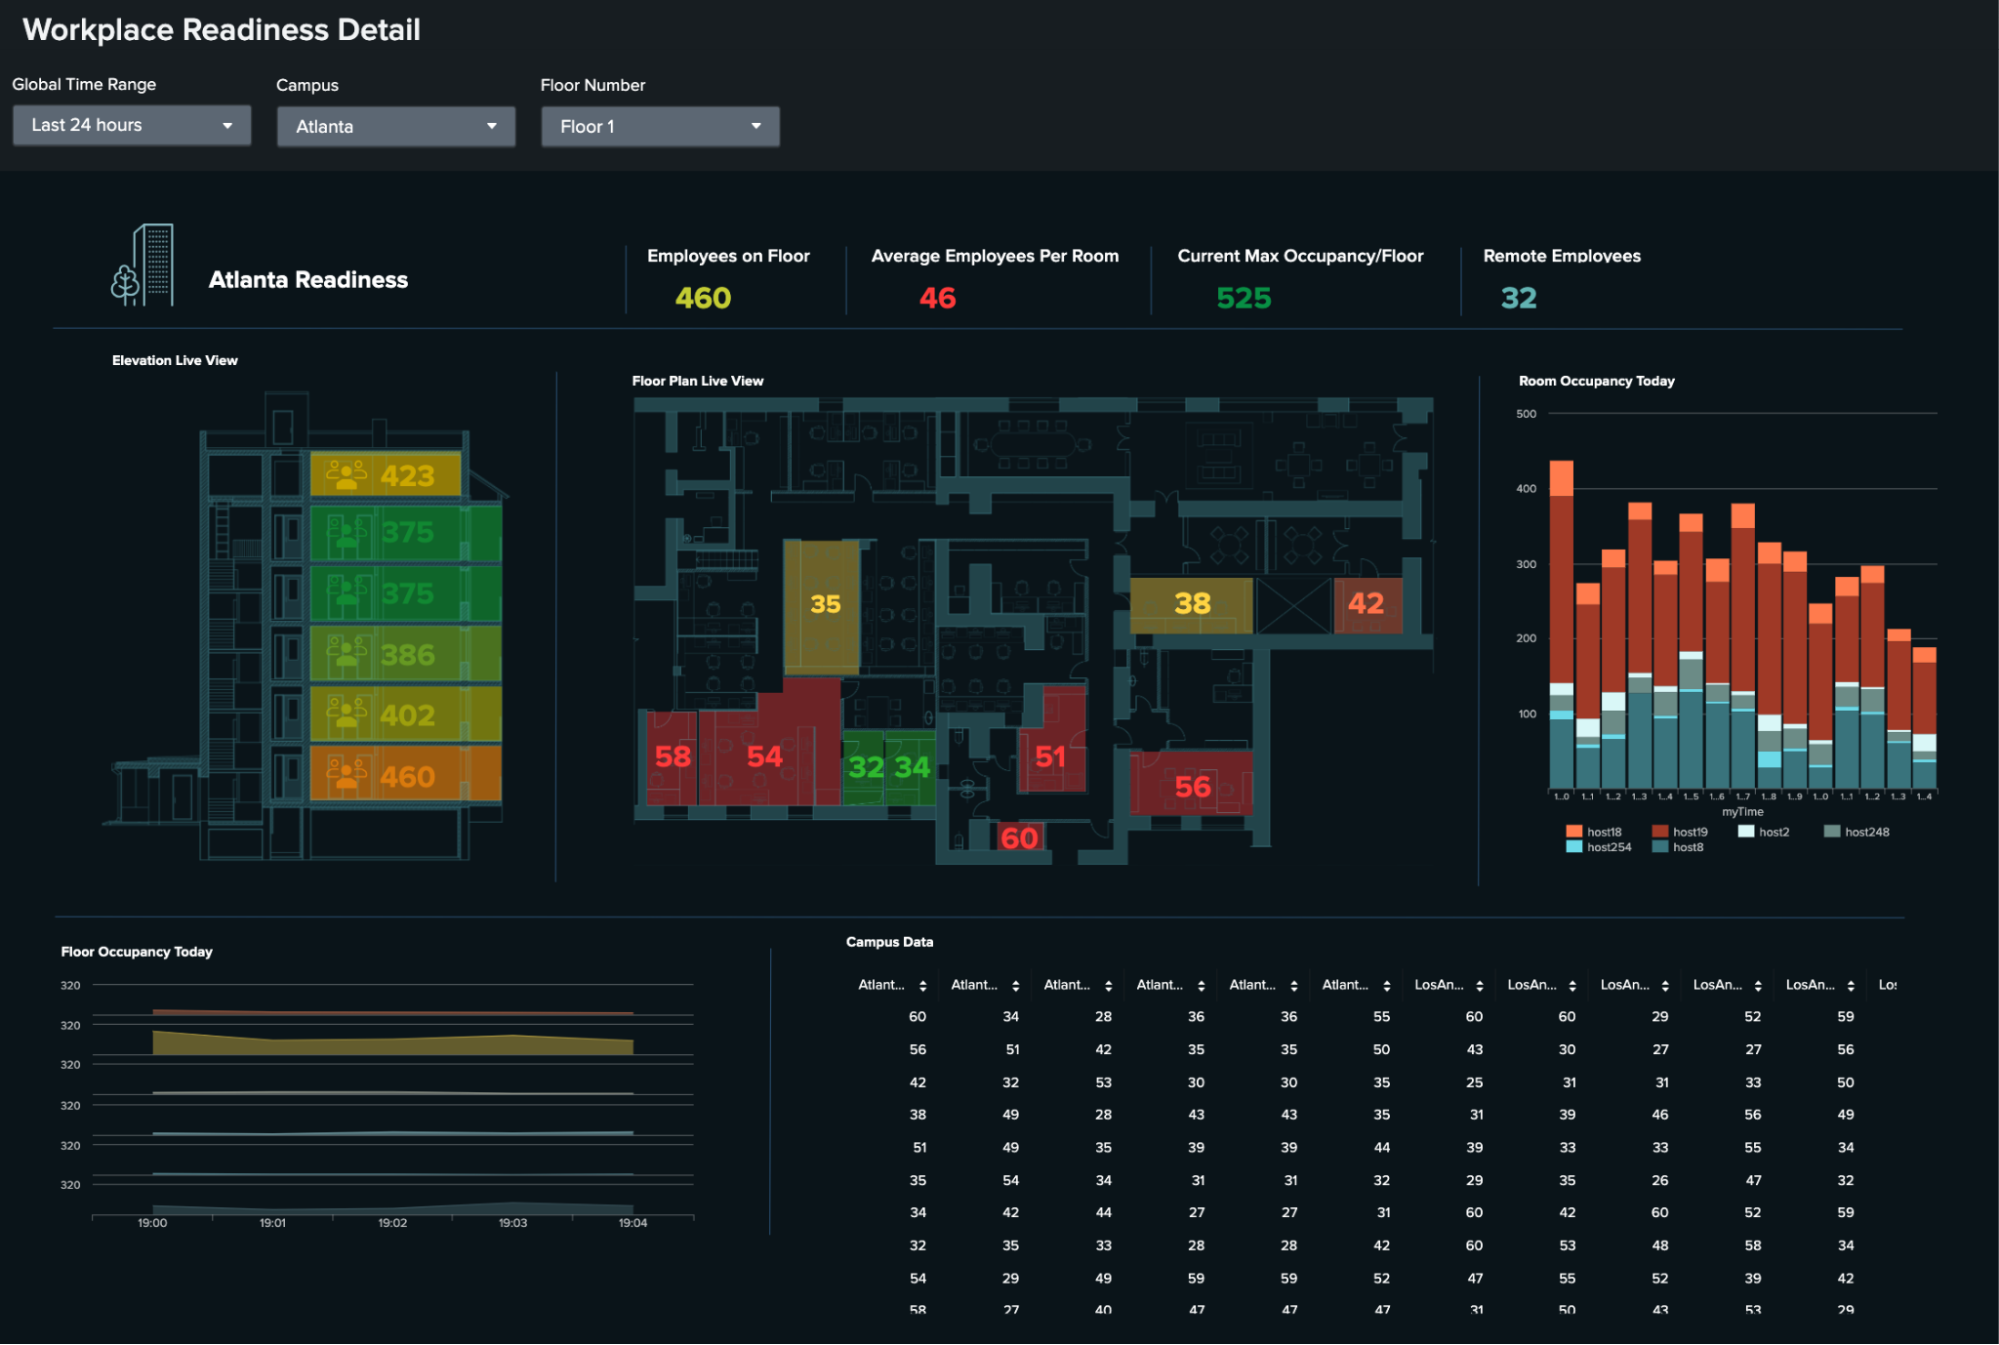
You can structure your input search such that the first value returned is the campus and floor with the highest occupancy at the time. Then those values will be used to populate the dashboard accordingly.
You can also set tokens from search results (and it's a lot easier to do than Classic, see our documentation for more information) and use those tokens throughout the dashboard. This is particularly handy if you need to eval token values, as you can now do so via makeresults searches.
To recap, if you use default input values or set tokens from search results, these can be used throughout the dashboard. One limitation is tokens whose default values are defined in the defaults stanza. These do not currently work with scheduled export, but the workaround would be to set up an input with the same default value and move the input off canvas so it's not included in the export.
Converting Classic Dashboards to Dashboard Studio
If you're ready to convert your scheduled Classic dashboards to Dashboard Studio, it can be done in three easy steps.
First, you'll need to identify all your Classic dashboards with schedules, and we've created a dashboard to help you do that. Look for a new dashboard in the Search & Reporting app called "Scheduled Export is now available for Dashboard Studio".
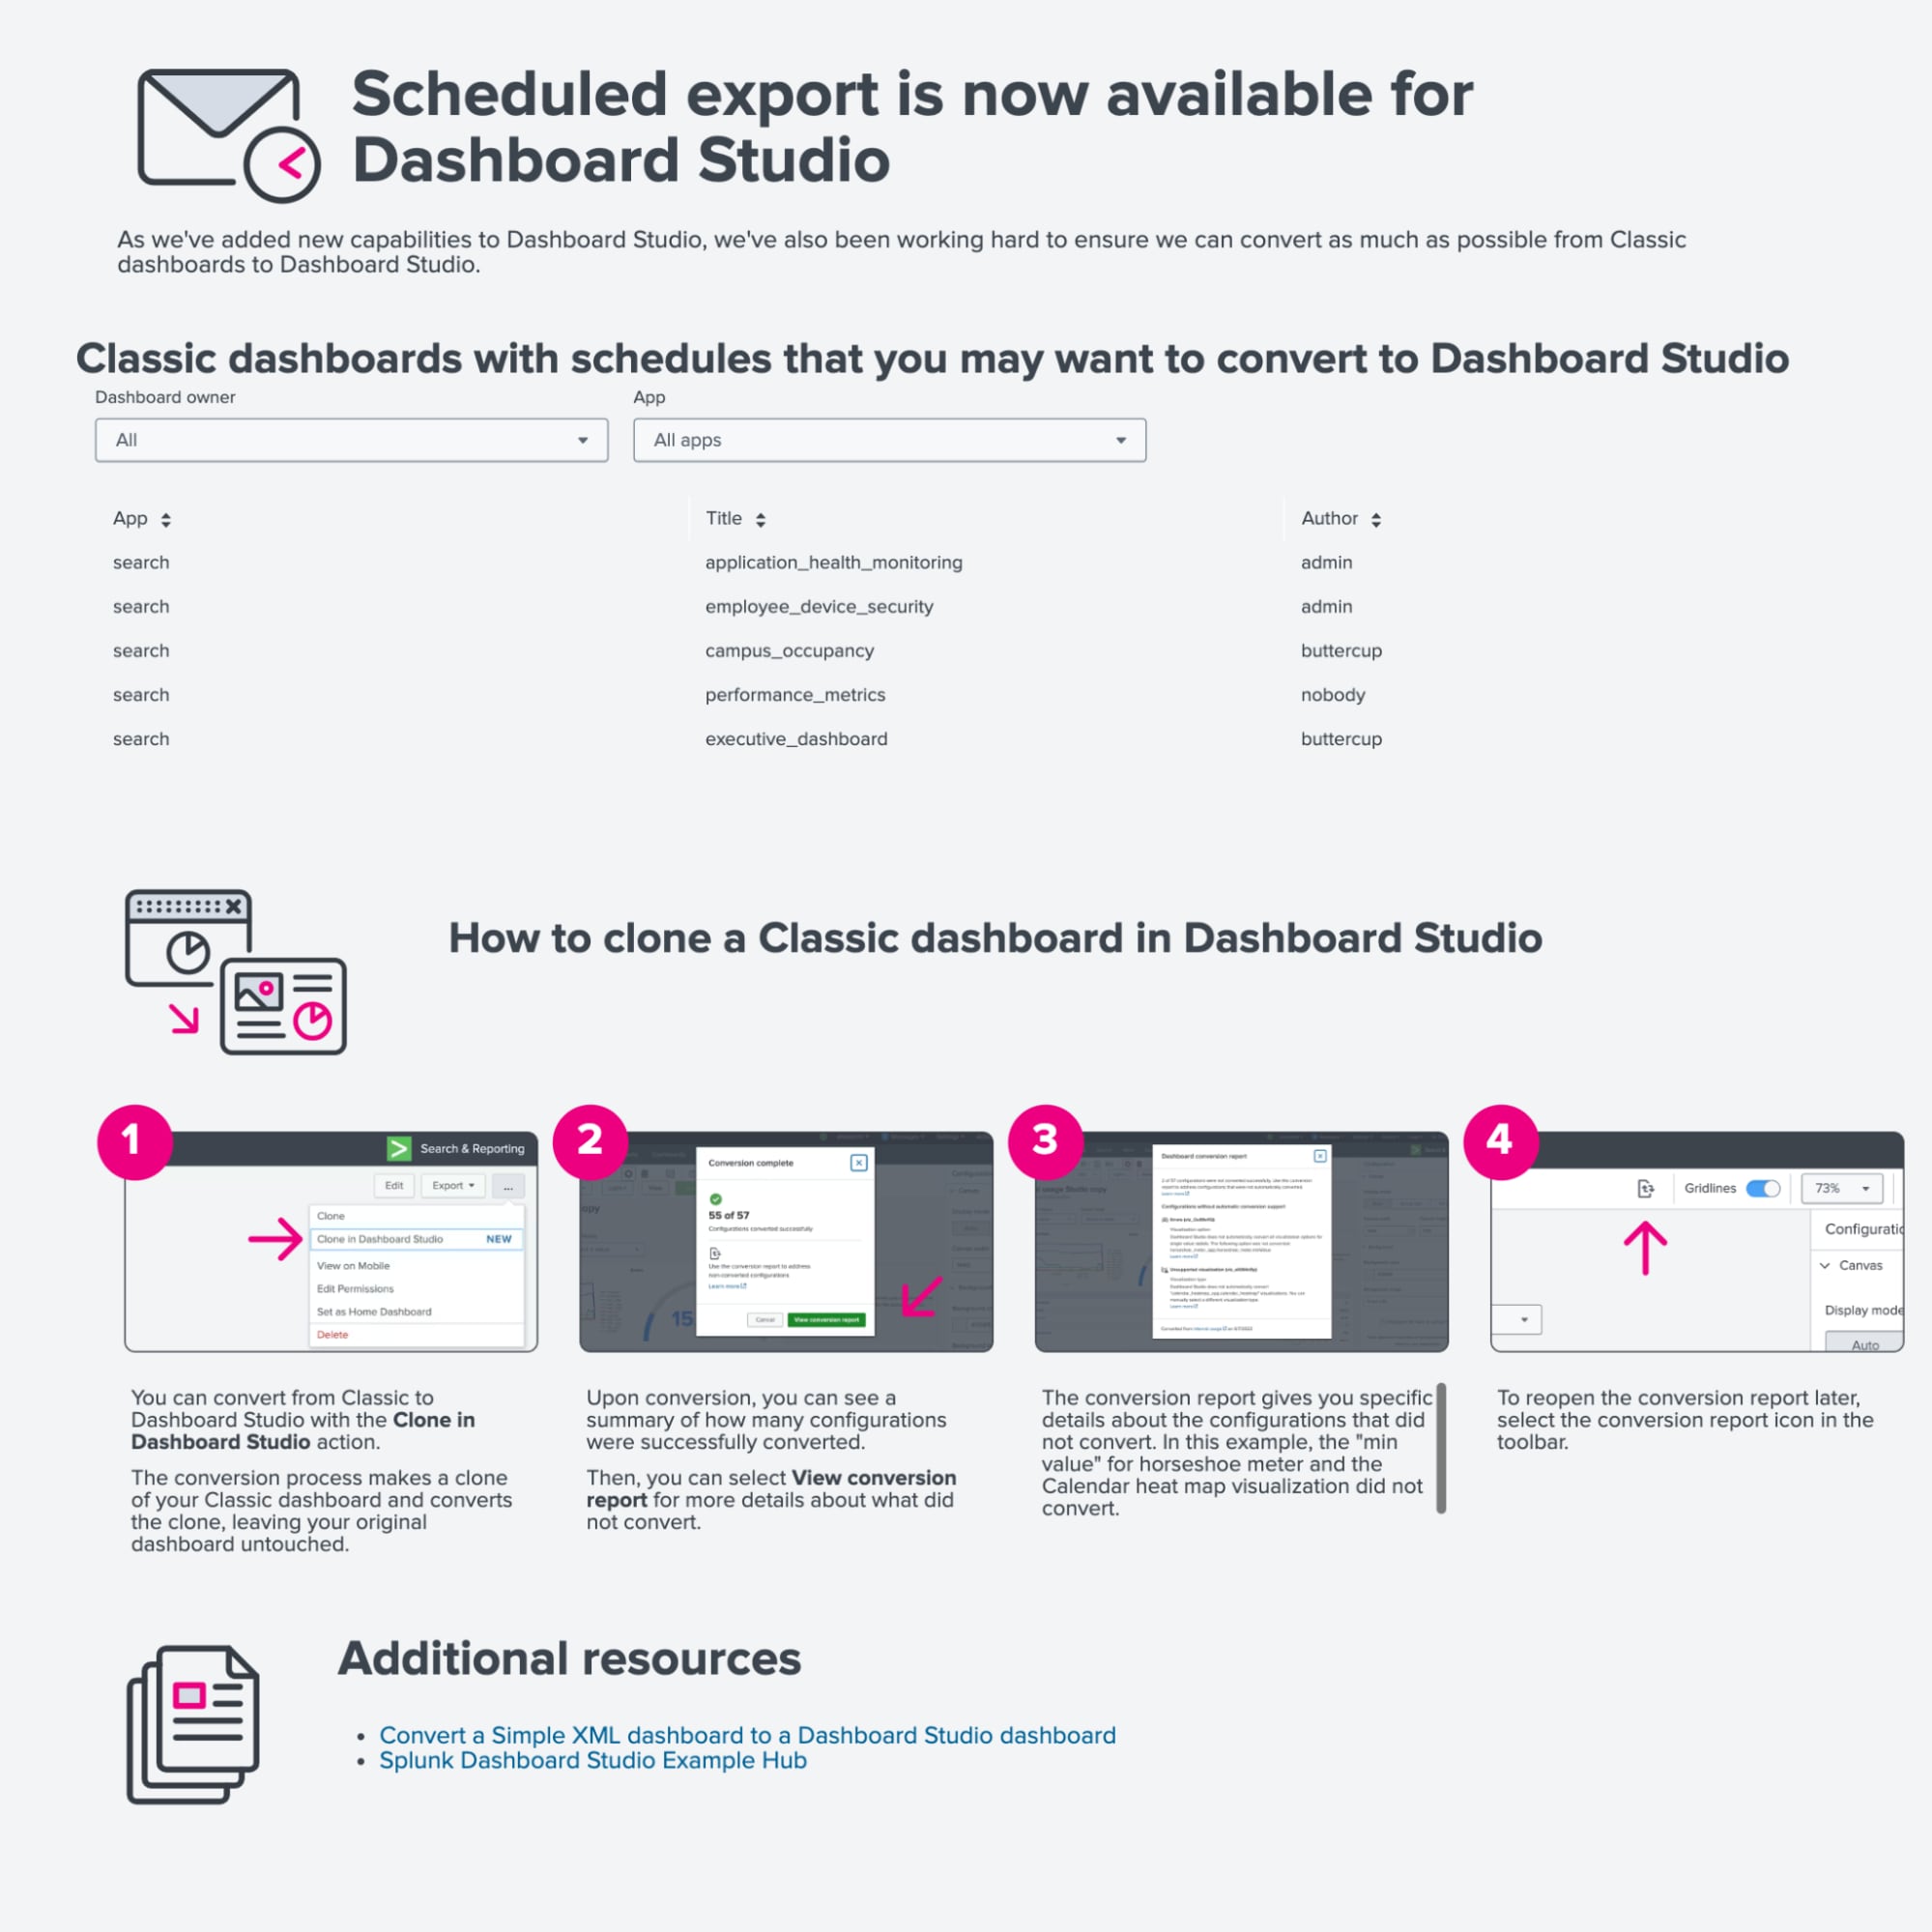
There you will find a list of Classic dashboards with schedules, their IDs, which app they're in, and the author of the dashboard. You can filter for all owners and apps or your own dashboards in the current app. If you click on any of those line items, the dashboard will open in a new tab.
Then, under the … menu, select Clone in Dashboard Studio. Optionally, supply a new name, description, and permissions. Open your new dashboard and check that everything looks as expected.
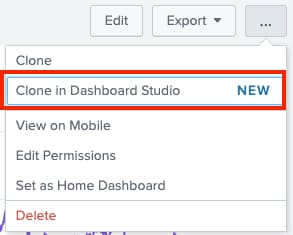
Finally, turn off the schedule on your Classic dashboard and apply the same schedule, recipients, and settings for your new Studio dashboard.
API Exports
Last but not least, we have also added API support to trigger an export of the dashboard, and you can find an example in our docs. You may use the API to generate dashboard exports that you can embed into other applications, replacing the need to manage multiple embedded scheduled reports.
If you have any tooling to export Classic dashboards via the API, make sure to update that tooling to use the Dashboard Studio export API once you convert your dashboards.
Other New Features in Splunk Enterprise 9.3
There are a number of other new Dashboard Studio features included in Splunk Enterprise 9.3 that you can learn about by checking out our release notes and these previous blog posts: Dashboard Studio: Schedule This! and Dashboard Studio: Sweating the Small Stuff.
Coming Soon
Check out Dashboard Studio and send in your feedback through Splunk Ideas, and you might see your feature request listed on a future blog's "coming soon" list! We are continuing to work on new capabilities, which are delivered incrementally with Splunk Cloud Platform and Splunk Enterprise releases.
Next up…
- Tabbed dashboards
- Single Value Radial Gauge
- Version history for Dashboard Studio
Helpful Resources
- New! Dashboard Studio demo
- Dashboard Studio Blogs - Catch up on our other recent updates with Studio
- New! Dashboard Studio Tutorial
- Improving Dashboard Performance and Resource Usage Tech Talk
- Splunk Dashboard Studio Documentation
- Splunk Ideas - Dashboard Studio for feature or enhancement Requests
- Examples Hub - Find the Examples Hub from the Dashboards page in Search & Reporting
- Splunk Community - Dashboards & Visualizations for questions
*This information is subject to change at any time, at the sole discretion of Splunk LLC and without notice. This roadmap information shall not be incorporated into any contract or other commitment. Splunk undertakes no obligation to either develop or deliver any product, features, or functionality described here.
Related Articles
About Splunk
The world’s leading organizations rely on Splunk, a Cisco company, to continuously strengthen digital resilience with our unified security and observability platform, powered by industry-leading AI.
Our customers trust Splunk’s award-winning security and observability solutions to secure and improve the reliability of their complex digital environments, at any scale.


