Making Applied Math Interesting

I have a college friend who after years of working in the IT field decided to become an 8th grade math teacher. This is a noble endeavor. After hearing this, I began to think about what it was like to learn math in my own youth and quickly thought about the usual word problems such as when will two trains intersect if heading at certain speeds at each other or finding the X value given an equation. These type of problem solving skills probably meet the needs of most students, but some want more. In fact, they want their math problems to apply to real world scenarios to make them more realistic and interesting.
This is where Splunk can play a role. Anyone can download a free copy of Splunk and have it installed within minutes on a PC or a Mac. They can import sample data and start using statistical commands to make sense of data so that it can tell a story or deliver trends. The path to entry here is quite open as indexing, searching, and analyzing time series data is a core function of Splunk. With that in mind, let me present an example that any student can use.
Imagine if you will, that you want to examine time series temperature data. Temperature here could be the temperature of your room, the temperature outside, the temperature of cities over time, the temperature of a data center, the temperature of the CPU inside your computer, or even the temperature of stars. Since this temperature term is quite universal, I’ll use this as a the key piece of data to analyze. I’ll deliberately not mention Fahrenheit, Celsius, or Kelvin as the concepts that are being presented can be independent of unit. Let’s start with sample data:
Thu Jan 03 15:16:44 EST 2013 Temperature=15
 Thu Jan 03 15:16:44 EST 2013 Temperature=20
 Thu Jan 03 15:16:43 EST 2013 Temperature=2
 Thu Jan 03 15:16:43 EST 2013 Temperature=12
 Thu Jan 03 15:16:42 EST 2013 Temperature=60
 Thu Jan 03 15:16:42 EST 2013 Temperature=53
 Thu Jan 03 15:16:41 EST 2013 Temperature=55
 Thu Jan 03 15:16:41 EST 2013 Temperature=37
 Thu Jan 03 15:16:40 EST 2013 Temperature=20
 Thu Jan 03 15:16:40 EST 2013 Temperature=52
 Thu Jan 03 15:16:39 EST 2013 Temperature=2
 Thu Jan 03 15:16:39 EST 2013 Temperature=78
 Thu Jan 03 15:16:38 EST 2013 Temperature=51
 Thu Jan 03 15:16:38 EST 2013 Temperature=28
 Thu Jan 03 15:16:37 EST 2013 Temperature=89
 Thu Jan 03 15:16:37 EST 2013 Temperature=100
 Thu Jan 03 15:16:36 EST 2013 Temperature=18
 Thu Jan 03 15:16:36 EST 2013 Temperature=33
 Thu Jan 03 15:16:35 EST 2013 Temperature=91
 Thu Jan 03 15:16:35 EST 2013 Temperature=57
 Thu Jan 03 15:16:34 EST 2013 Temperature=51
 Thu Jan 03 15:16:34 EST 2013 Temperature=89
 Thu Jan 03 15:16:33 EST 2013 Temperature=23
This data could have been generated in real-time or imported from a file or constantly monitored and indexed into Splunk. Notice, there is a timestamp and the data has key value pairs for the Temperature field so the field is already extracted by Splunk. In the interest of time, let’s assume that you’ve already indexed the data after reading the Splunk tutorial, and you now want to perform some statistical analysis over time. The easiest thing to start with may be finding average temperature over time. Back when I was in school, this would have involved writing a program to go through unstructured data and it probably would have taken away from any enthusiasm to move forward with this data for someone who wanted quick results. In Splunk, it’s a simple time chart command called with an average function.
sourcetype=myReadings|timechart avg(Temperature)
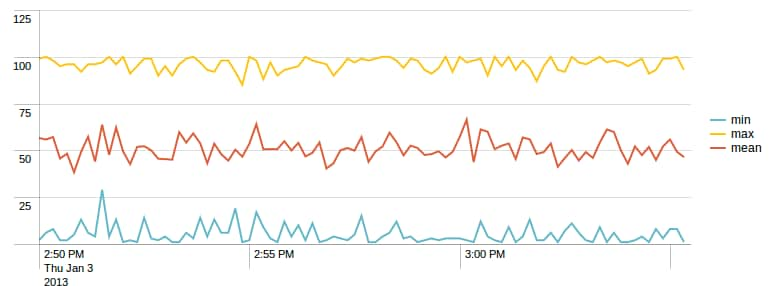
This may not be too impressive, but it does get better. You may next want to find the min, max, and mean of your temperature values over time. Seeing how quickly this can be created in a graph makes it worthwhile with the following functions used with timechart.
sourcetype="myReadings" | timechart min(Temperature) as min max(Temperature) as max mean(Temperature) as mean
The use of “as” above is simply a way to rename a field for better readability.
Now, we can get a little more statistical. What if we wanted to find all temperature readings that were in the top 90th percentile, the top 80th percentile and the top 70th percentile to present them as a graph over time? Time chart works for this again:
sourcetype="myReadings" | timechart perc70(Temperature) as perc70 perc80(Temperature) as perc80 perc90(Temperature) as perc90
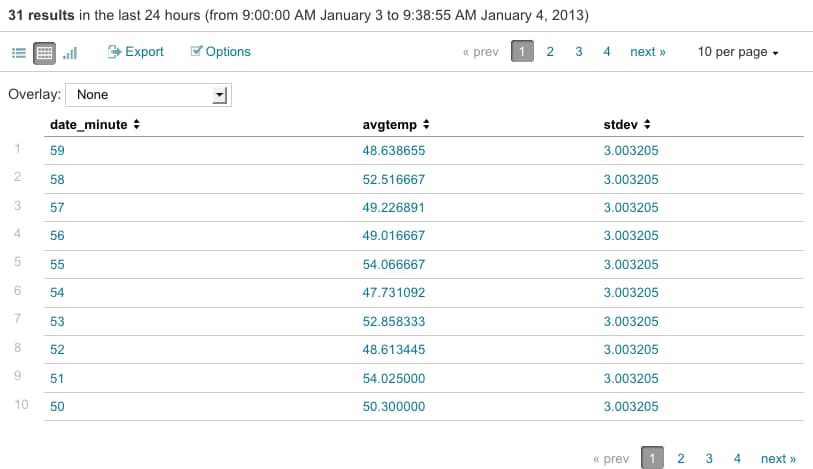
As you can see, there’s a quite a lot of ways to dice your data to find trends over time, which makes this a very applicable math problem that can be visually solved. I’ll present one more example, which may be too much for the average 8th grader, but it will be interesting to math teachers. What if you want to find the standard deviation of all temperatures and then find average values per minute which are greater than 2 times the standard deviation plus an arbitrary number, say 30? This sounds like a lot just to say, but I can show it using the Splunk commands of stats and eventstats below.
sourcetype="myReadings" | stats avg(Temperature) as avgtemp by date_minute|eventstats stdev(avgtemp) as stdev|where avgtemp>(2*stdev+30)|sort - date_minute
This presents a table of outliers that fall outside of two times the standard deviation plus 30.
Again, this may be beyond the scope of middle school math, but it shows that you can use the same tool for more complex uses. In the examples, I’ve used temperature as the field to analyze, but it could have been anything such as velocity, acceleration, sales earnings, sports statistics, etc., that we could have plugged in to analyze. The use of Splunk makes the analysis of Big Data straight forward. Hopefully, this may inspire a teacher or two to try it in the classroom to make applied math more interesting using real world data.
Related Articles
About Splunk
The world’s leading organizations rely on Splunk, a Cisco company, to continuously strengthen digital resilience with our unified security and observability platform, powered by industry-leading AI.
Our customers trust Splunk’s award-winning security and observability solutions to secure and improve the reliability of their complex digital environments, at any scale.


