London to Paris Cycle for Prostate Cancer

In this limited blog series, we will be using Splunk to track a group of intrepid Splunkers as they cycle from London to Paris, raising awareness about prostate cancer and supporting organisations. This journey is not just a physical challenge but also a technology one as well, thanks to the vast number of devices and companies manufacturing hardware. We will leverage the power of Splunk to bring you real-time updates on their progress.
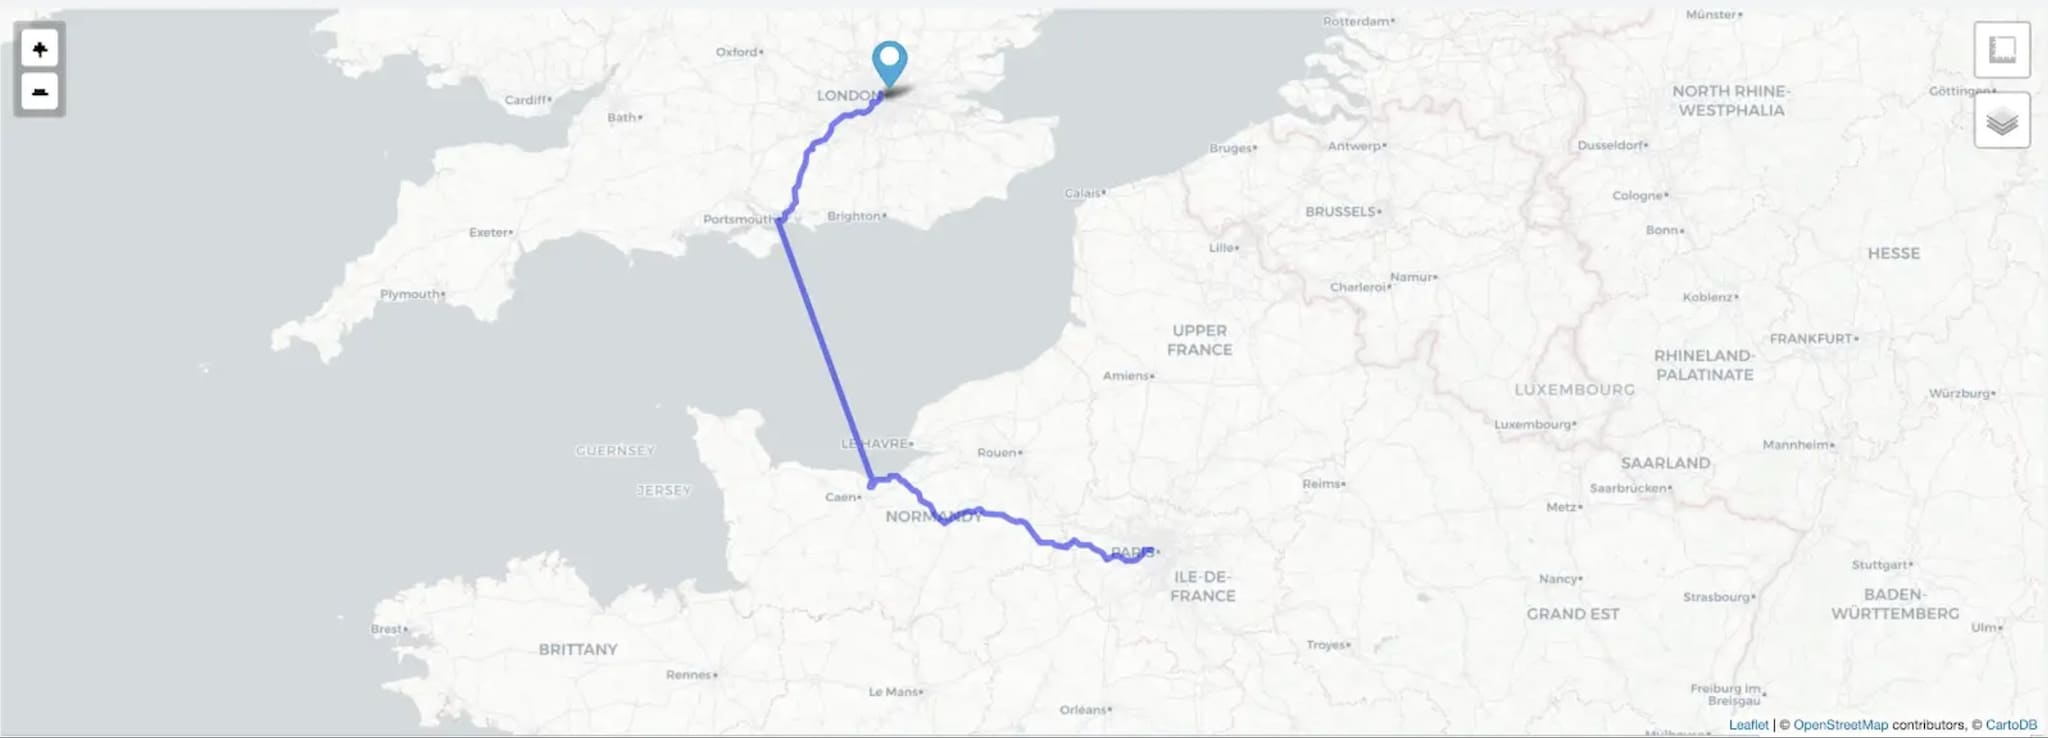
Tomorrow, Tuesday, September the 3rd, 2024, a team of over 20 daring Splunkers will being their arduous three-day cycle. Their route will see them begin in the heart of the English capital, London, from the Splunk Office in Paddington and they will travel all the way to the Splunk office in France's capital, Paris. This epic adventure will cover a staggering 375 kilometers! Traversing some of the most iconic urban landscapes as well as some of the most picturesque countryside that these countries have to offer.

Why Take on This Challenge?
Some of you may be wondering why anyone would willingly choose to do such a leg-achingly tiresome challenge. The answer is simple yet powerful. Prostate cancer awareness. Prostate Cancer is a significant health problem, with statistics showing that approximately 1 in 8 men will be diagnosed with this disease in their lifetime. The impact of this disease affects not only those diagnosed but also their families and communities around them.
The group of wonderful, caring amateur cyclists participating in this ride are motivated by a single joint goal. To raise awareness of prostate cancer and support the organisation Prostate Cancer UK. This phenomenal charity is in a constant battle against prostate cancer in the UK. Their work includes groundbreaking research, campaigning for health policy changes, and providing much-needed support to men and their families/friends. Through their unwavering efforts, Prostate Cancer UK is helping to improve outcomes and quality of life for those affected by this disease.

Together, the riders, support staff and their supporters back home are standing up for dads, brothers, partners, and friends everywhere. By raising awareness and funds, they are contributing to a cause that could save lives and improve the health of men across the UK and beyond.
The Role of Splunk on this Ride
Aside from the Splunk riders' energy and commitment to attempting this arduous challenge, Splunk also plays a crucial role in making this event even more impactful. Splunk Enterprise, a market-leading real-time data analytics platform, allows us to track and analyze the cyclists' progress and share those insights with the world with open dashboards.
Splunk Enterprise is a powerful tool that enables anyone to collect and analyze data from virtually any human-readable source. Traditionally, this might include, as an example, data from applications, servers, network devices, and security systems. You may have seen Splunk used in various industry verticals, particularly in the security space around Security Information and Event Management (SIEM).
However, for this event, we're going into the non-traditional data sources such as cycle computers, heart rate monitors, bicycle sensors, and more. Have you ever seen it used to track cyclists from country to country? And not just track them but display this data on a dashboard that's accessible to anyone, anywhere? Well, now is your chance. By utilizing Splunk's analytical power, dashboard framework, and cloud-native capabilities, we’ve created a system that allows you to follow the riders in real-time. You’ll be able to see their performance metrics, their current location, and how much of the journey they have left. This isn’t just data; it’s a live, breathing representation of their incredible effort.
How We Make It Happen
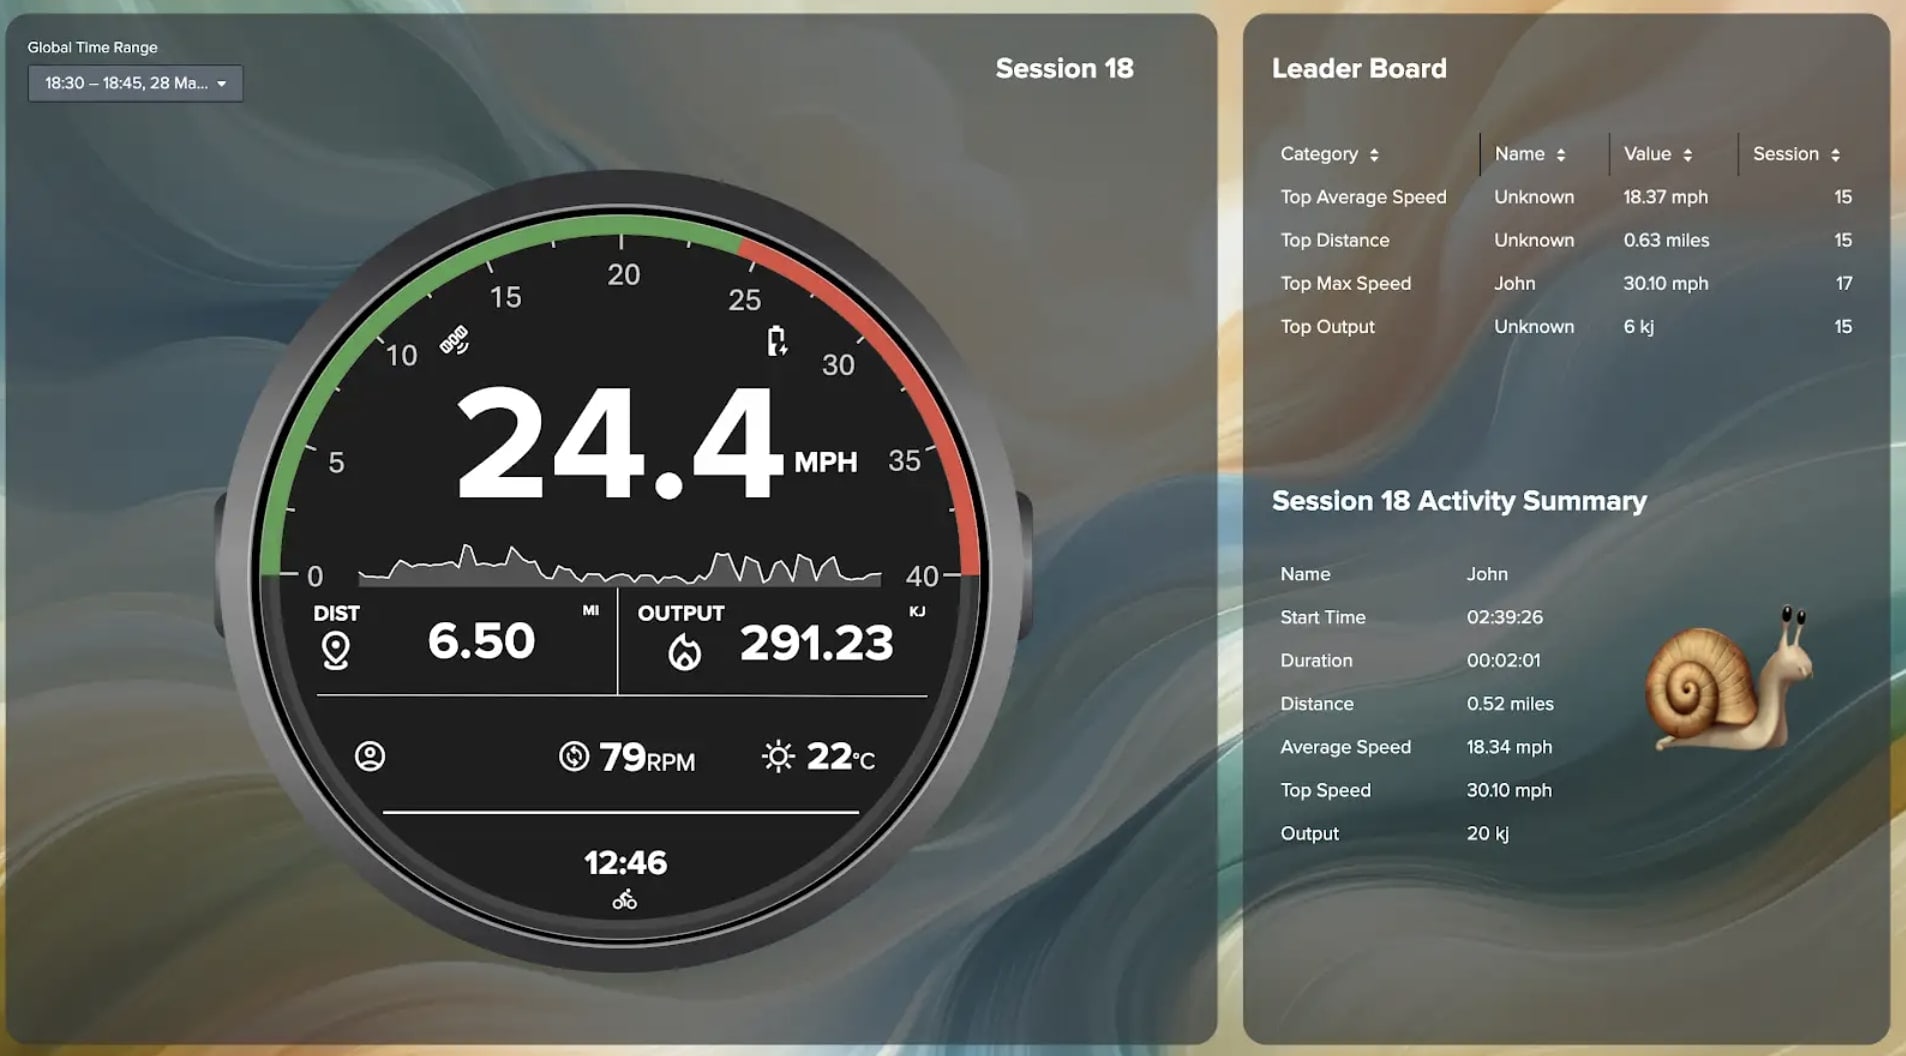
We will cover this more in later blogs, but for now, lets take a little closer look at how Dean Cresswell, a very talented Splunker is doing this. The data from each cyclist’s equipment—whether it's a GPS tracker, heart rate monitor, or cadence sensor—is collected via a mobile app and sent into Splunk over http to Splunk Http Event Collector (HEC). From there, the data is ingested, analyzed, and displayed on a custom-built dashboard in Dashboard Studio. This dashboard doesn’t just show you raw numbers; it presents the data in a way that’s easy to understand and engaging to follow.
For example, you can see how fast the riders are going, their average speed, the elevation of the terrain they’re tackling, how far they have gone and how far they have left, as well as technical pieces like battery percentage and the like. All of this data is updated in real-time, providing a dynamic view of the ride as it happens.Splunk’s capabilities allow us to create alerts and notifications. So, if a riderstops or veers of course as an example, this information can be highlighted and shared instantly.
But it’s not just about tracking the riders. We’re also able to analyze trends and patterns over the course of the ride. For instance, we can identify which segments of the route are the most challenging, based on the collective data from all the riders. This analysis not only helps us understand the riders' performance but also provides insights that could be valuable for future events.

The Human Side of the Data
While the data is fascinating and it's the part I certainly enjoy, it’s important to remember that behind each data point is a person—a person who has trained hard, who is pushing through fatigue, and who is motivated by a cause that means a great deal to them. Over the next couple of days, we will be analyzing the team’s data, looking at how they are performing, and speaking with them about how they’re feeling during this adventure.
This isn’t just a test of physical endurance; it’s also a test of mental strength. We’ll be sharing their stories, their challenges, and their triumphs with you. Through roadside interviews with Mark Brown, you’ll get to hear firsthand from the riders about what it’s like to participate in such a grueling event. We’ll also delve into the camaraderie that develops among the riders as they support each other through the tough moments.

Sharing the Journey with You
We will share this information publicly, so that anyone wishing to follow the riders can see how they are getting on. But that's not all! We will also be sharing snippets of "Splunkiness" in terms of how we get the data, how we analyze it, and how we share this content in such an easy-to-consume way—which I think you have to admit, is pretty cool on all counts.
As you follow the ride, you’ll not only be supporting a great cause but also learning about the incredible capabilities of Splunk Enterprise. Whether you’re a data enthusiast, a cycling fan, or someone who just wants to support a good cause, there’s something in this for everyone.
The Bigger Picture
This ride isn’t just about 20+ people cycling from London to Paris. It’s about raising awareness for a disease that affects millions of men around the world. It’s about using technology to bring people together and share an experience in real-time. And it’s about showing what’s possible when you combine determination, teamwork, and cutting-edge technology.
I think you will all agree, this is a tremendous feat—cycling all that distance, and to have so many riders willing to stand up for a good cause and raise that all-important awareness is simply inspiring. I am humbled to be able to support their efforts by analyzing their data, even if all it does is show their hard work on a page for you all to see.
Join Us on This Journey
So with all of that in mind, I ask you to please visit london2paris.livehybrid.com for the latest data insights and come back here to see part 2 of the blog tomorrow to see how they are getting on. We’ll be updating the dashboard, sharing more insights, and of course, cheering on our riders as they make their way to Paris.
So without further ado, join me in wishing this amazing bunch of Splunkers a good ride, and may the wind be at their back!
See you tomorrow!
Read the recap of a very eventful Day 1 here.
Related Articles
About Splunk
The world’s leading organizations rely on Splunk, a Cisco company, to continuously strengthen digital resilience with our unified security and observability platform, powered by industry-leading AI.
Our customers trust Splunk’s award-winning security and observability solutions to secure and improve the reliability of their complex digital environments, at any scale.


