PEAK Threat Hunting Framework
Hunt smarter, right now. Download The PEAK Framework for free.
Success in threat hunting is vastly different from incident response. Incident responders can measure success in criteria like ticket volume, mean time to close, or escalations.
For threat hunting, the number of hunts vs. incidents is not comparable because hunts take longer, and the average time to complete a hunt can vary wildly. More importantly, most hunts will not result in incidents. We can’t use the same metrics! Our critical metrics of success are our outputs/deliverables and documentation.
Check out the following blogs for more information:
Outputs are submissions to other teams like new or improved detection use cases, escalated incidents, etc. Each hunt is unique and can result in very different outputs.
Documentation is considered both:
In cybersecurity, how to document is less obvious, not often discussed, and difficult to standardize. If it’s not in the ticket, it didn’t happen.
We hope to address the challenge of documentation with our newly developed framework called SNARE. SNARE stands for:
The most crucial aspect of SNARE is applying the concepts with intention. Less crucial are your preferences in recording the information. SNARE is a guide, not a standard operating procedure, and should be experimented with and iterated upon for individual and organizational needs.
Let's look at each concept in SNARE.
Where was I? Where am I?
Snapshot is the principle of recording search queries/syntax. Ideally, you should record the searches that progress your investigation. This includes searches that may not return results, but lead you to the answer.
Be specific with your queries! If you miss a few queries, leverage the `history` command in Splunk to return your searches. Don’t forget you can include comments surrounded by tick marks ``` in your searches for additional context.
When repeated, Snapshot enables the hunter to retrace how they arrived at any point in the investigation, and the added benefit of Reproducibility.
If you escalate to the incident response team, they likely want to validate. You can copy/paste the queries that lead you to your conclusion! Or maybe several months in the future you need to remember what you did or how you came to a conclusion.
Tip: Start using the “earliest” and “latest” modifiers, example below, to further improve reproducibility! The time selector in the Splunk UI is great, but the modifiers make it faster!
What time range? | earliest=01/01/2025:00:00:00 latest=02/01/2025:00:00:00 |
What data source? | index=authentication AND sourcetype=admin |
What event type? | description=”LOCKOUT” |
What user? | email=”thrunter@splunk-by-cisco.com” |
Do you want to build a story?
Narrative is the principle of assigning meaning to your documentation. This should apply to any and all recorded information, like screen captures, tables, and logs.
When you narrate what is happening, your documentation becomes less subjective to the person consuming it. For some users, significant effort may be needed to understand, even for those with technical backgrounds.
What things are you doing?
Actions is the principle of recording the specific steps taken to analyze data. This applies to:
Stating your actions adds context to the Narrative, and can reinforce hunting technique selection. Mentally reframing your analytical process from “spray and pray” queries to “which technique?” can increase the speed at which you think, and ultimately improve hunt efficiency.
Why did you do that thing?
Reasoning is the principle of recording the explanations for your actions, including actions taken and avoided.
You reason throughout your daily life; the same applies to threat hunting! However, reasoning is not a bullet-point action item you check off your threat hunt to-do list. In threat hunting, we want to illustrate the reasoning behind your taking that particular action(s).
Stating your reasoning allows you to revisit your thought process. This will allow you to identify areas of improvement and allow others to understand your approach (to potentially augment their own).
In the worst case scenario, if you miss evidence of an intrusion, you have justification for actions not taken.
Screenshots, tables, raw logs, and highlights
Evidence is the principle of documenting the artifacts that support your investigation, which provides the foundation for your conclusions. This can include the basics like logs, tables, charts, and screen captures, up to system images and snapshots.
You could export and attach your search results as a .csv to your document. You could also create a dashboard to display the results of your searches at a single location, for knowledge sharing or incident escalation!
Evidence strengthens investigative decisions by ensuring that actions are not only explained but also supported by factual data. Evidence combined with reasoning creates a clear and justified investigative process, and is the foundation for all Outputs.
Evidence provides the "what” and Reasoning provides the "why.” With regards to legal proceedings, your documentation may BE the evidence in court.
Tables and screenshots are considered evidence for the hunter’s statement.
This table highlights authentications by IP address 8.8.8.8
_time | description | IP | Location |
20:00:00 UTC | FAILURE | 8.8.8.8 | United States |
20:01:00 UTC | LOCKOUT | 8.8.8.8 | United States |
20:02:00 UTC | SUCCESS | 8.8.8.8 | United States |
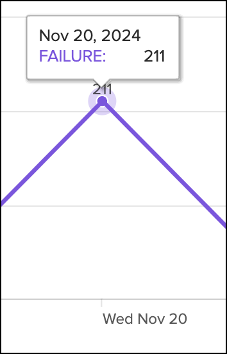
This screenshot highlights authentication failures increasing.
It’s important to recognize that each SNARE principle is intertwined. After recording your search query (Snapshot), you may state the query type (Action) and the results you expect to receive (Reasoning). After the search is complete, you may capture a screenshot or create a table of the results (Evidence), and then explain what the data means to you (Narrative).
Or you may receive 0 results (Evidence), and then brainstorm the root cause (Narrative, Reasoning). You pivot and contact the subject matter expert over chat (Action) and they explain the data is no longer stored in that index (Evidence).
See the example below which contains real threat documentation, scrubbed of identifiable information.
Initial review shows X has a high volume of logs
Timechart search over (default) 30 minutes
index=X
| timechart count by index
57,292,322 events (2/20/25 5:47:00.000 PM to 2/20/25 6:17:00.000 PM)

Results show a high volume of logs returned over 30 minutes
Keeping search within this time range to avoid impacting search performance
Specifying the time range in earliest/latest
earliest=02/20/2025:17:47:00
latest=02/20/2025:18:17:00
Pivot to fieldsummary to observe field values
earliest=02/20/2025:17:47:00 latest=02/20/2025:18:17:00
index=X
| fieldsummary maxvals=5
| where count > 0
| table field count values
| makemv delim="{" values
Fieldsummary shows ~ 3,400 unique fields
Unsure of the best approach for identifying key fields
Search below attempts to separate high count fields of a similar name into bins using loadjob to improve speed created field ‘prefix’, capturing the 1st - 7th character of field name used bin on count field displaying prefixes by bucketized count
| loadjob 1740076815.162909
| eval prefix=substr(field, 1, 7)
| stats count by prefix
| bin count bins=10
| stats values(prefix) as prefix, by count
| sort -count
As you can see, SNARE is a powerful guide for ensuring that your documentation is clear, comprehensive, and trustworthy. We hope it becomes a valuable tool for our fellow threat hunters. Experiment, iterate, and make SNARE work for you!
In summary, here are the key takeaways:


The world’s leading organizations rely on Splunk, a Cisco company, to continuously strengthen digital resilience with our unified security and observability platform, powered by industry-leading AI.
Our customers trust Splunk’s award-winning security and observability solutions to secure and improve the reliability of their complex digital environments, at any scale.

Get the latest articles from Splunk straight to your inbox.
© 2005 - 2025 Splunk LLC All rights reserved.
