Sharing is Not Caring: Hunting for Network Share Discovery

Organizations rely on interconnected systems to store, share and manage information. These ecosystems often incorporate network file shares, which act as repositories of various types of data within an organization. Unfortunately, it is not uncommon for sensitive files to find their way onto these network shares inadvertently with permissions that are too broad or not properly restricted. Although cloud computing provides secure ways to share files, traditional Server Message Block (SMB) network shares continue to play a vital role in many organizations and are not going away anytime soon.
After obtaining an initial foothold in a target network as a low privileged user, red teams and threat actors commonly leverage the network share discovery technique (T1135) to locate and access internal data. System administration scripts, configuration files, backups, and other sensitive files laying on a forgotten file share can aid an attacker to escalate their privileges just like the Lapsus$ threat actor group did last year. Proprietary and confidential information found on network shares can also be leveraged by attackers as a means of extortion, threatening victims with the public release of sensitive files unless a ransom is paid.
Earlier this year, the team at The DFIR Report wrote an insightful blog post detailing multiple detection opportunities. Complementing their work, this post introduces additional Splunk hunting queries specifically designed to proactively detect network share discovery behavior. Alongside these queries, the Splunk Threat Research Team (STRT) also released a new simulation tool we've developed to gain a deeper understanding of the technique.
Be sure to watch the accompanying video, where we provide a live demonstration of the technique simulation and showcase the hunting queries in action.

Why You Should Care
A wide array of threat actors such as the operators of IceID, Emotet and BumbleBee malware families as well as actors like UNC961, Conti and Maze have been found to incorporate this technique as part of their operations, making it an important attack vector that demands attention. Identifying unusual access patterns or changes in file share activity may be one of the key opportunities defenders get to identify an ongoing breach. Security teams can leverage the resources highlighted in this blog to simulate and proactively hunt for this common technique within Windows Active Directory networks.
Technique Simulation
In order to effectively develop detection strategies, our first step is to simulate the technique in a lab environment. This allows us to observe its behavior and capture the resulting telemetry for analysis. In enterprise networks that span thousands of hosts, adversaries are forced to automate the discovery process. As highlighted by the The DFIR Report team, Invoke-ShareFinder is a common tool frequently employed by attackers to execute this technique. However, adversaries might choose to use alternative tools or even develop custom ones.
Rather than focusing on a specific tool, our approach was to simulate generic behaviors with custom code. This decision allowed us to explore and understand the underlying mechanisms of the technique, rather than being confined to the characteristics of a particular tool.
SharpShareFinder
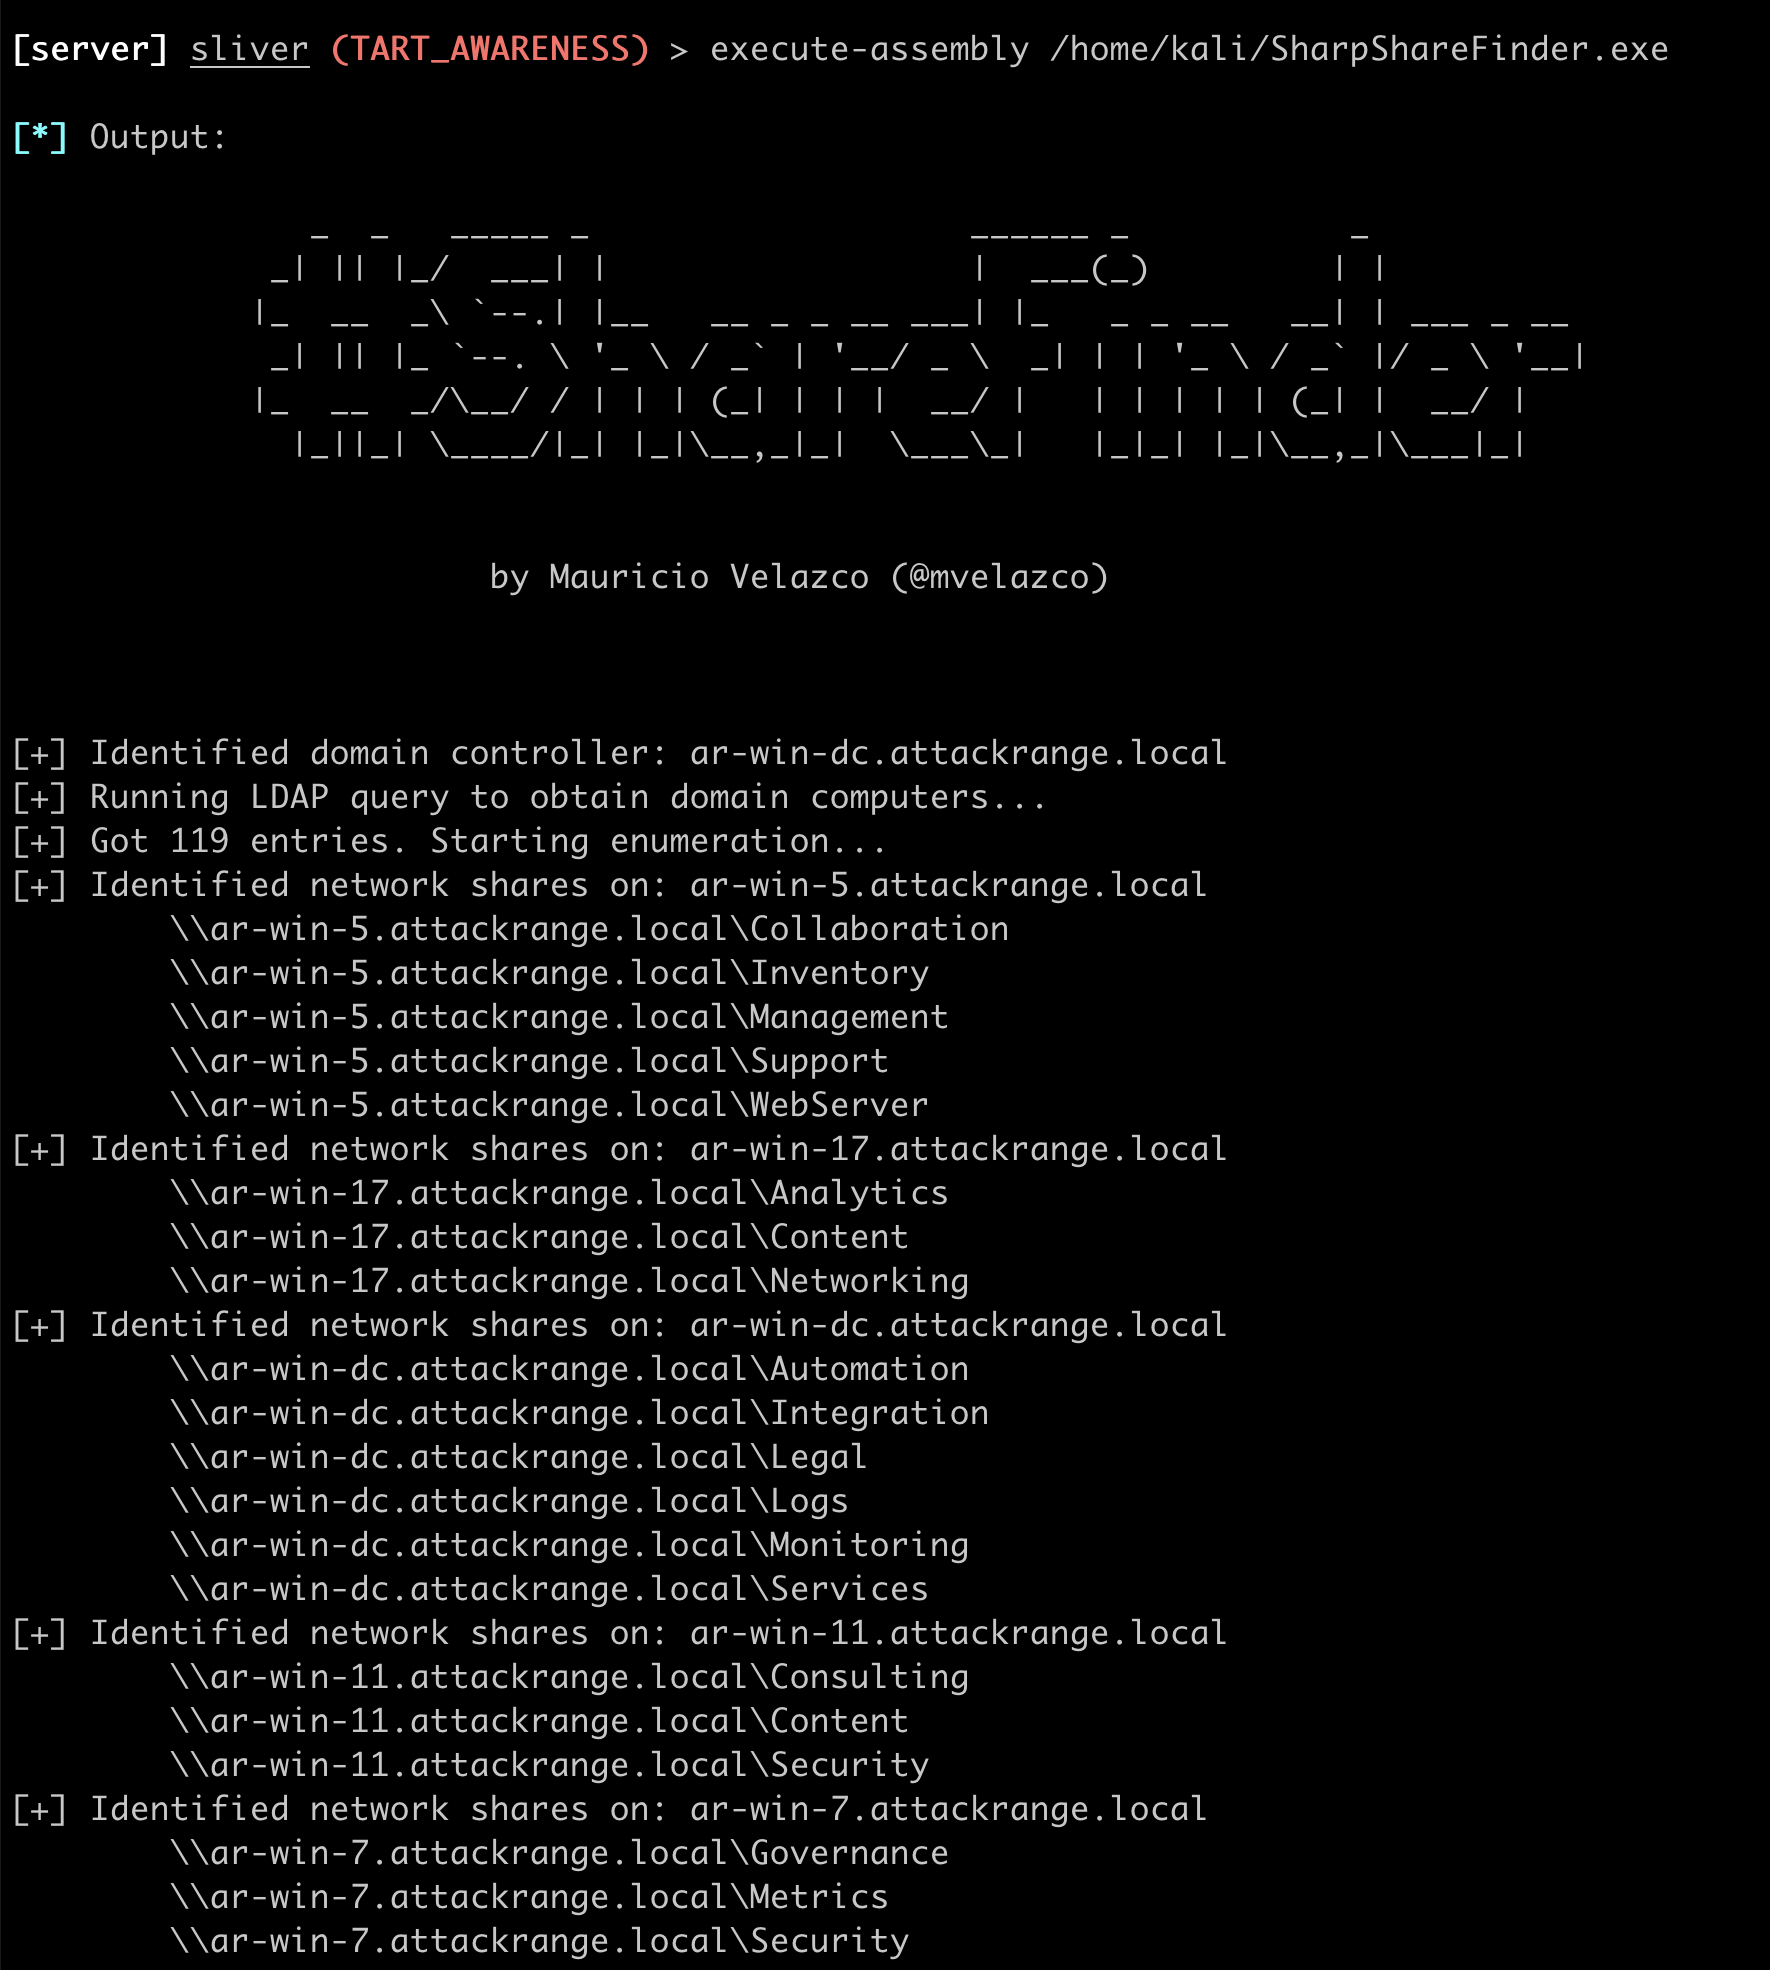
SharpShareFinder is a minimalistic network share discovery tool designed for Windows Active Directory networks. Written in C#, it employs a three-step process to achieve its goals. First, it identifies a domain controller using the DsGetDcName function exported by NetApi32.dll. It then uses this DC to enumerate all domain-joined computers through the Lightweight Directory Access Protocol (LDAP). To perform this task, It leverages functions exported by Wldap32.dll, such as ldap_init and ldap_search_st.
Finally, SharpShareFinder enumerates and prints all available network shares for each identified host. To do this, it relies on the NetShareEnum API function, also exported by Netapi32.dll, the same method utilized by tools like Invoke-ShareFinder.
By relying solely on native Windows functions and system DLLs, SharpShareFinder emulates tactics that an attacker might execute, leveraging readily available system resources. In its current iteration, the tool takes a direct and aggressive approach, enumerating shares on all identified hosts without delay. This 'noisy' behavior is intentional, designed to simulate and detect those attackers who are more brazen in their actions. While this straightforward approach mirrors the actions of a subset of real-world adversaries, future versions of SharpShareFinder will incorporate functionality to make the tool stealthier, allowing for simulations of more covert attack techniques.
Lab Environment
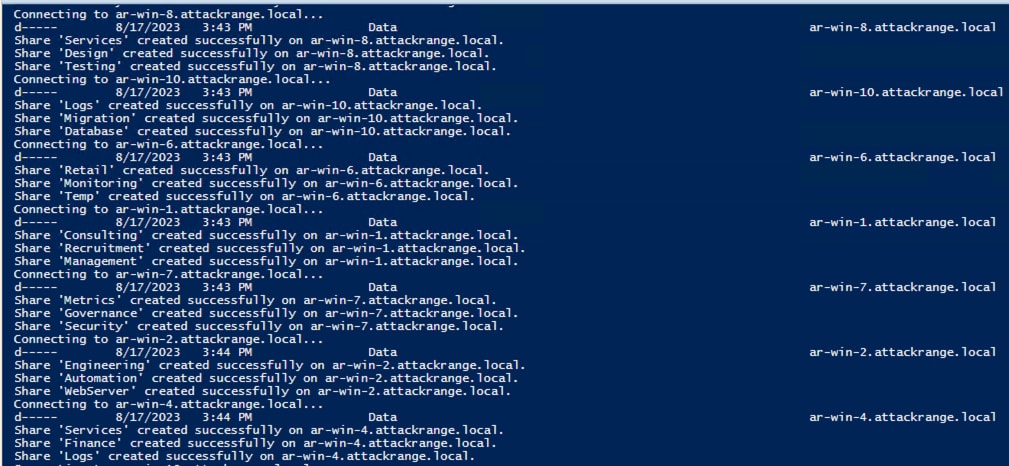
To replicate a small corporate setting for the study of network share discovery techniques, we built an Active Directory (AD) lab environment using the Splunk Attack Range. This environment was composed of 20 domain-joined endpoints running a mix of Windows Server 2019 and 2022, a Splunk server and a Kali Linux host. The Splunk Universal Forwarder is installed and configured on all endpoints by Splunk Attack Range. To populate the environment with “insecure” network shares, the team wrote a short script, CreateSharesOnDomainComputers.ps1, that uses PowerShell remoting and the New-SmbShare commandlet to create shares across the domain.
Hunting for Network Share Discovery
This section introduces hunting queries that can be used in Splunk to identify behavior potentially associated with the network share discovery technique. These queries were developed through the simulation and analysis of the technique in a lab environment, ensuring their relevance and effectiveness. They can be used for on-demand threat hunting exercises as well as ongoing security monitoring.
To effectively utilize the methods described in this section, specific logging requirements must be met. Properly ingesting the following security audit policy subcategories on domain controllers and domain-joined endpoints is required for the hunting exercises:
- Audit Kerberos Service Ticket Operations
- Audit Logon
- Audit Special Logon
- Audit File Share or Audit Detailed File Share
The hunting analytics introduced in this blog post leverage two powerful Splunk commands: stats and bucket ( or bin ). The 'stats' command allows us to calculate various statistics on the events, providing insights into patterns and anomalies. Meanwhile, the 'bucket' command helps us divide the data into different time chunks or intervals, enabling a more granular analysis of events within specific time spans.
Like any other hunting exercise, the analytics introduced here will help you learn more about your environment and refine your understanding over time. In the initial iterations, you may primarily identify expected behavior, such as system administrators connecting to multiple servers or vulnerability scanners conducting weekly scans. However, as you continue to analyze the data and add known hosts and users to allow lists, the focus will shift to identifying unexpected or suspicious behavior.
Computer Service Ticket Requests
In an Active Directory network, consuming services always involves requesting Kerberos tickets and network share enumeration is not an exception. While simulating the technique, the STRT observed the attacking user requesting Kerberos service tickets (event code 4769) using the target computer names in the ServiceName field. Additionally, the TargetUserName and IpAddress fields within this event helped us pinpoint the source computer and identity performing the discovery.
As an adversary enumerates network shares in a large network, they will have to request multiple kerberos tickets in a short period of time. Hunting for scenarios where a user is requesting a large number of computer service tickets for different endpoints can be a useful clue in identifying suspicious activity.
Leveraging the Splunk Query Language, we can create a table to identify this behavior.
index=win EventCode=4769 ServiceName="*$" TargetUserName!="*$"
| bucket span=5m _time
| stats dc(ServiceName) AS unique_targets values(ServiceName) as host_targets by _time, EventCode,
  IpAddress, TargetUserName
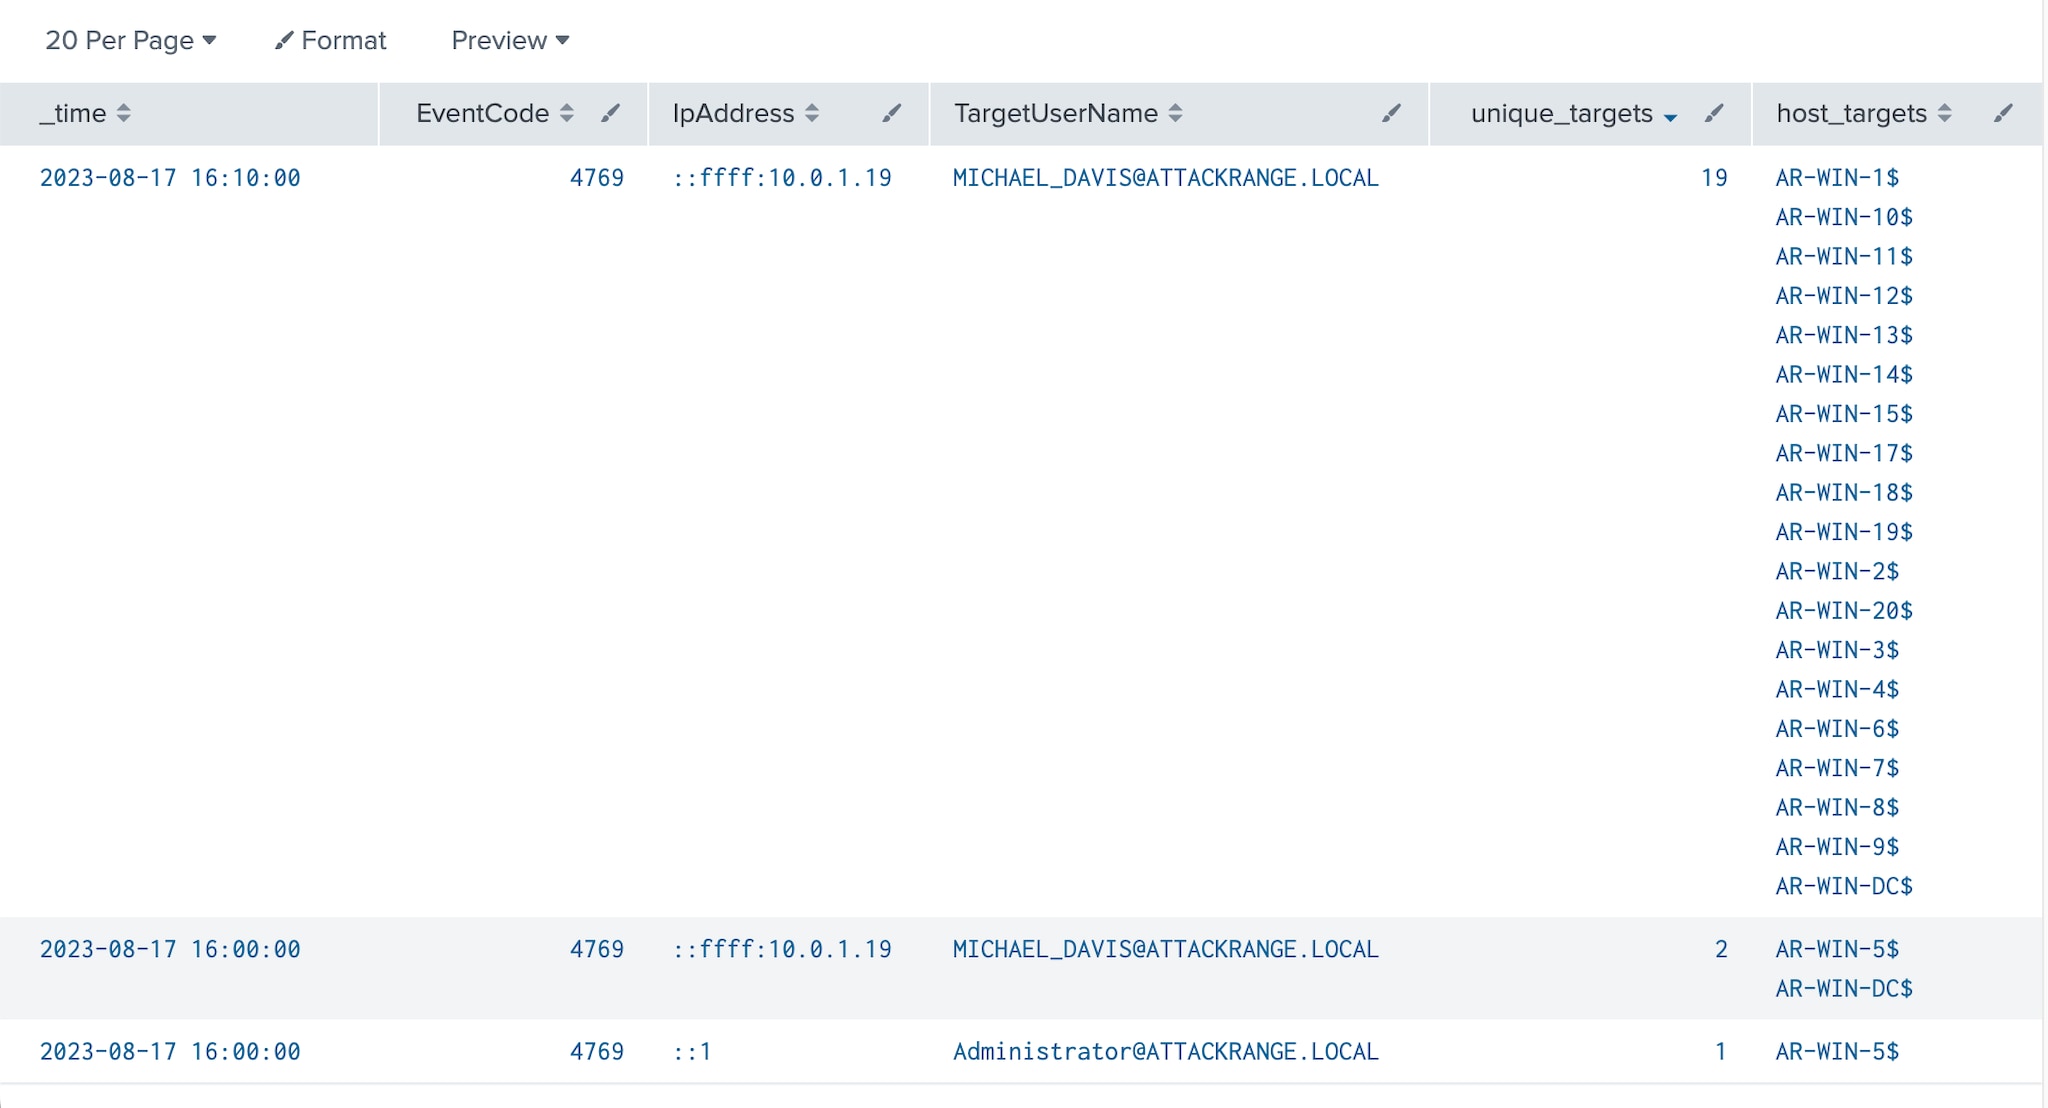
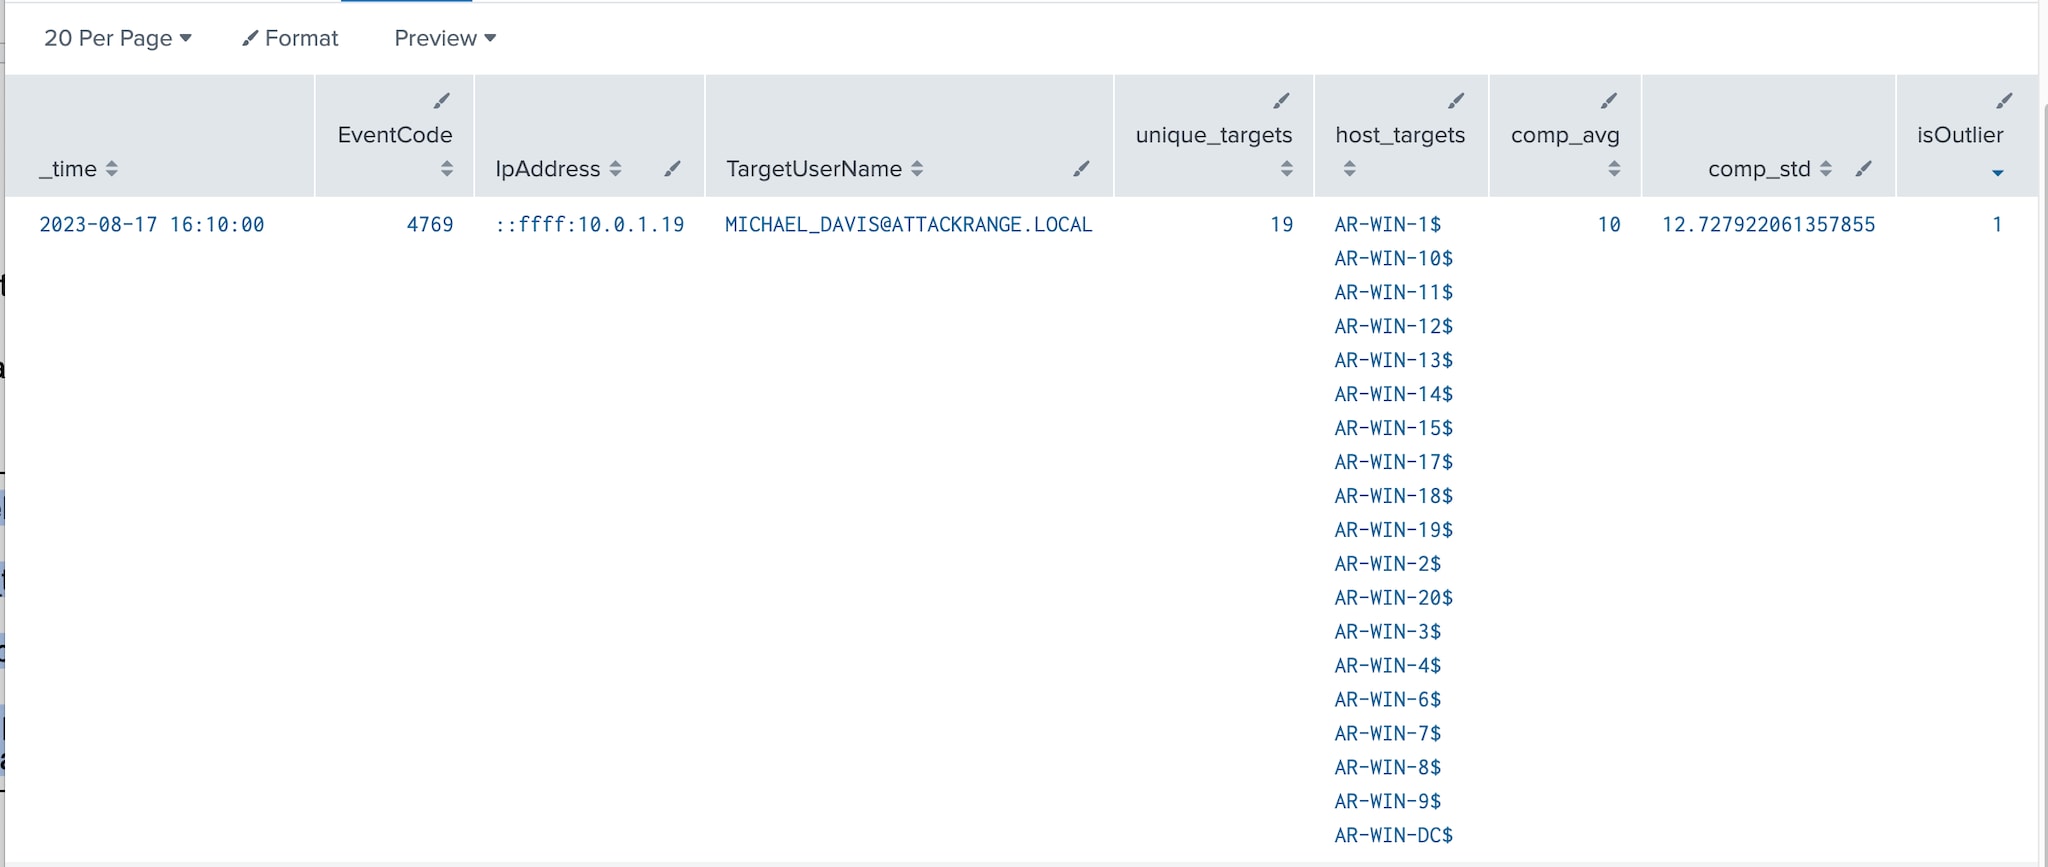
The query above can be used to identify unusual behavior based on the unique number of target computers the source requests tickets for. A slight change in the query can help us leverage a statistical approach such as the standard deviation and the three-sigma rule to identify outliers.
index=win EventCode=4769 ServiceName="*$" TargetUserName!="*$"
| bucket span=5m _time
| stats dc(ServiceName) AS unique_targets values(ServiceName) as host_targets by _time, EventCode,
  IpAddress, TargetUserName
| eventstats avg(unique_targets) as comp_avg , stdev(unique_targets) as comp_std by IpAddress,
  TargetUserName
| eval upperBound=(comp_avg+comp_std*3)
| eval isOutlier=if(unique_targets >5 and unique_targets >= upperBound, 1, 0)
Rapid Authentication
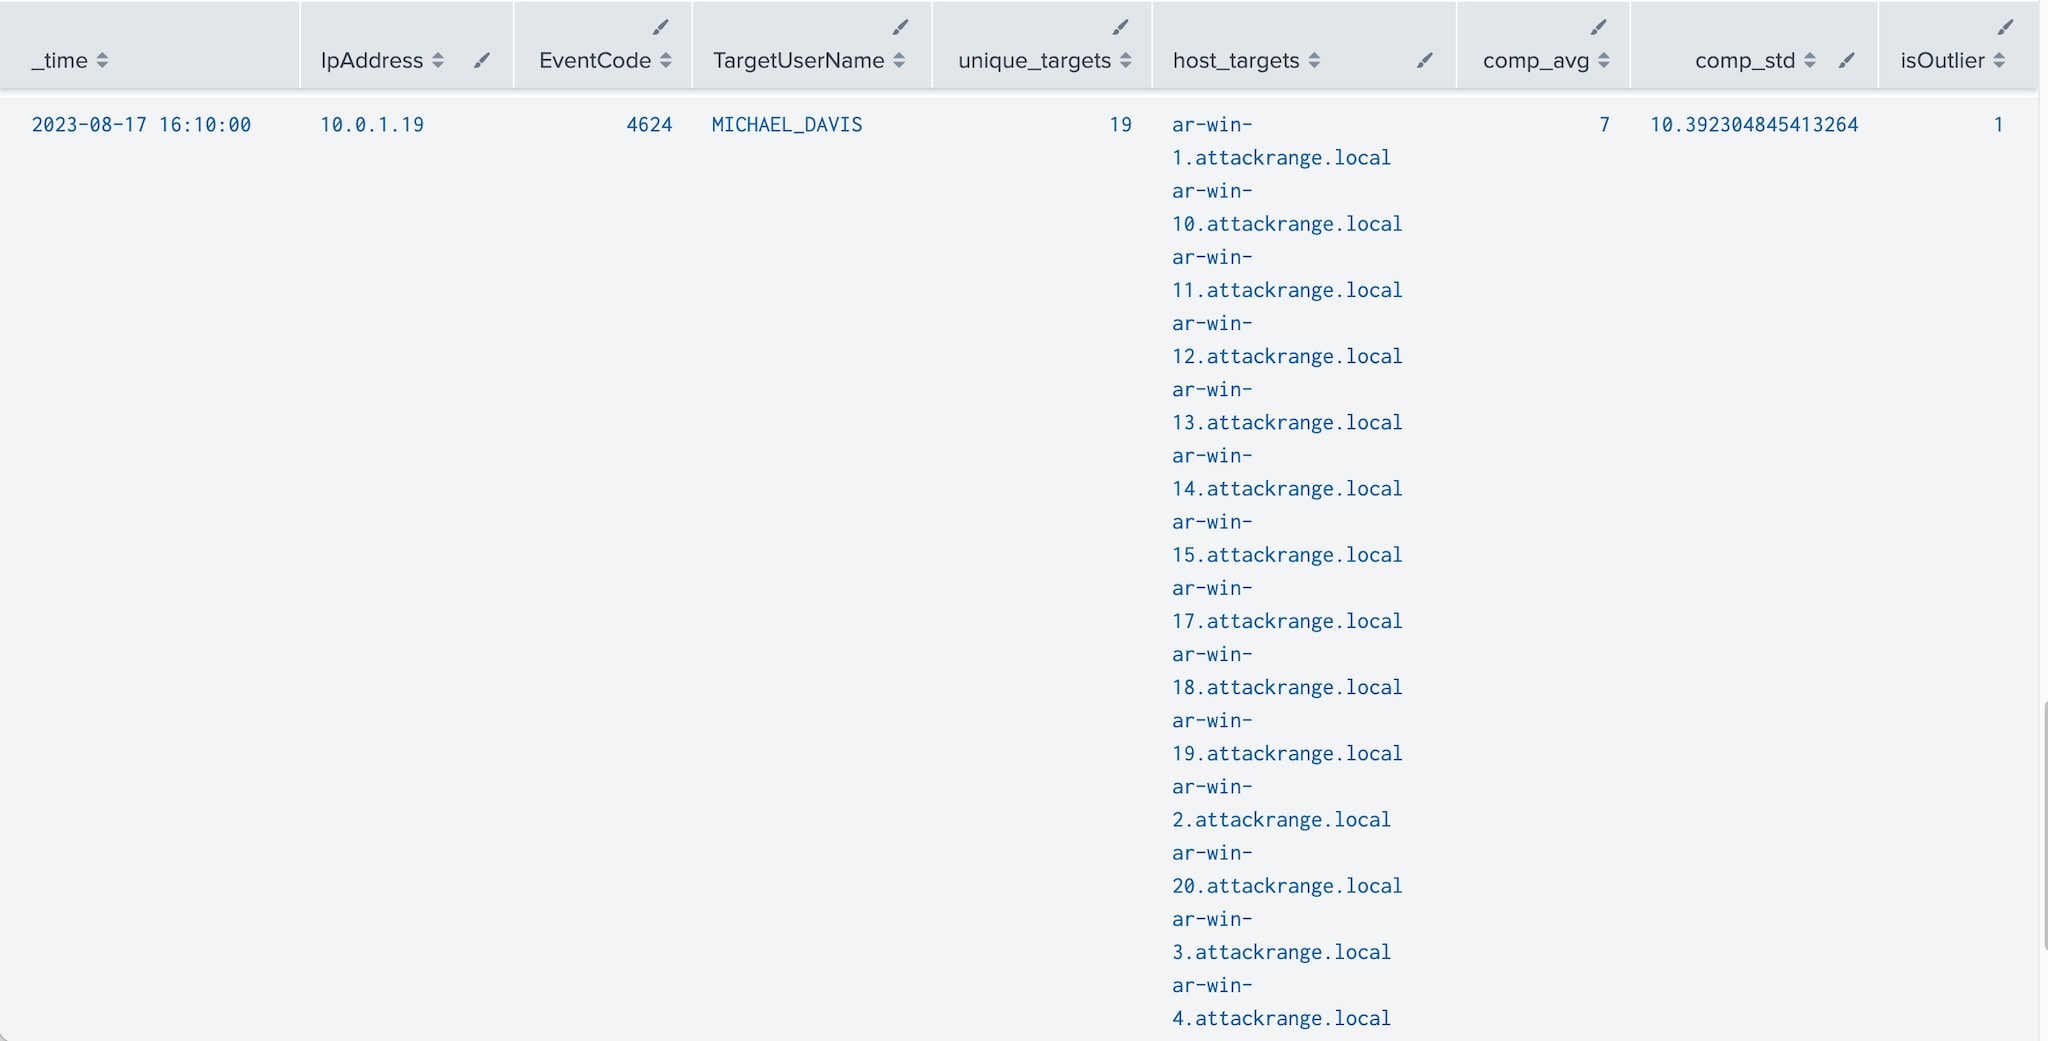
In order to enumerate all available shares on domain targets, the NetShareEnum API function authenticates to the remote endpoints using the SMB protocol. This successful authentication will generate a 4624 event on all target endpoints. Assuming security teams are ingesting authentication events across their Windows fleet, this behavior provides an interesting hunting opportunity. As 4624 events also contain the TargetUserName and IpAddress fields, we can leverage Splunk to identify one source successfully performing rapid authentication across a large number of hosts.
index=win EventCode=4624 LogonType=3 TargetUserName!="ANONYMOUS LOGON" TargetUserName!="*$"
| bucket span=5m _time
| stats dc(Computer) AS unique_targets values(Computer) as host_targets by _time, EventCode, IpAddress,
  TargetUserName
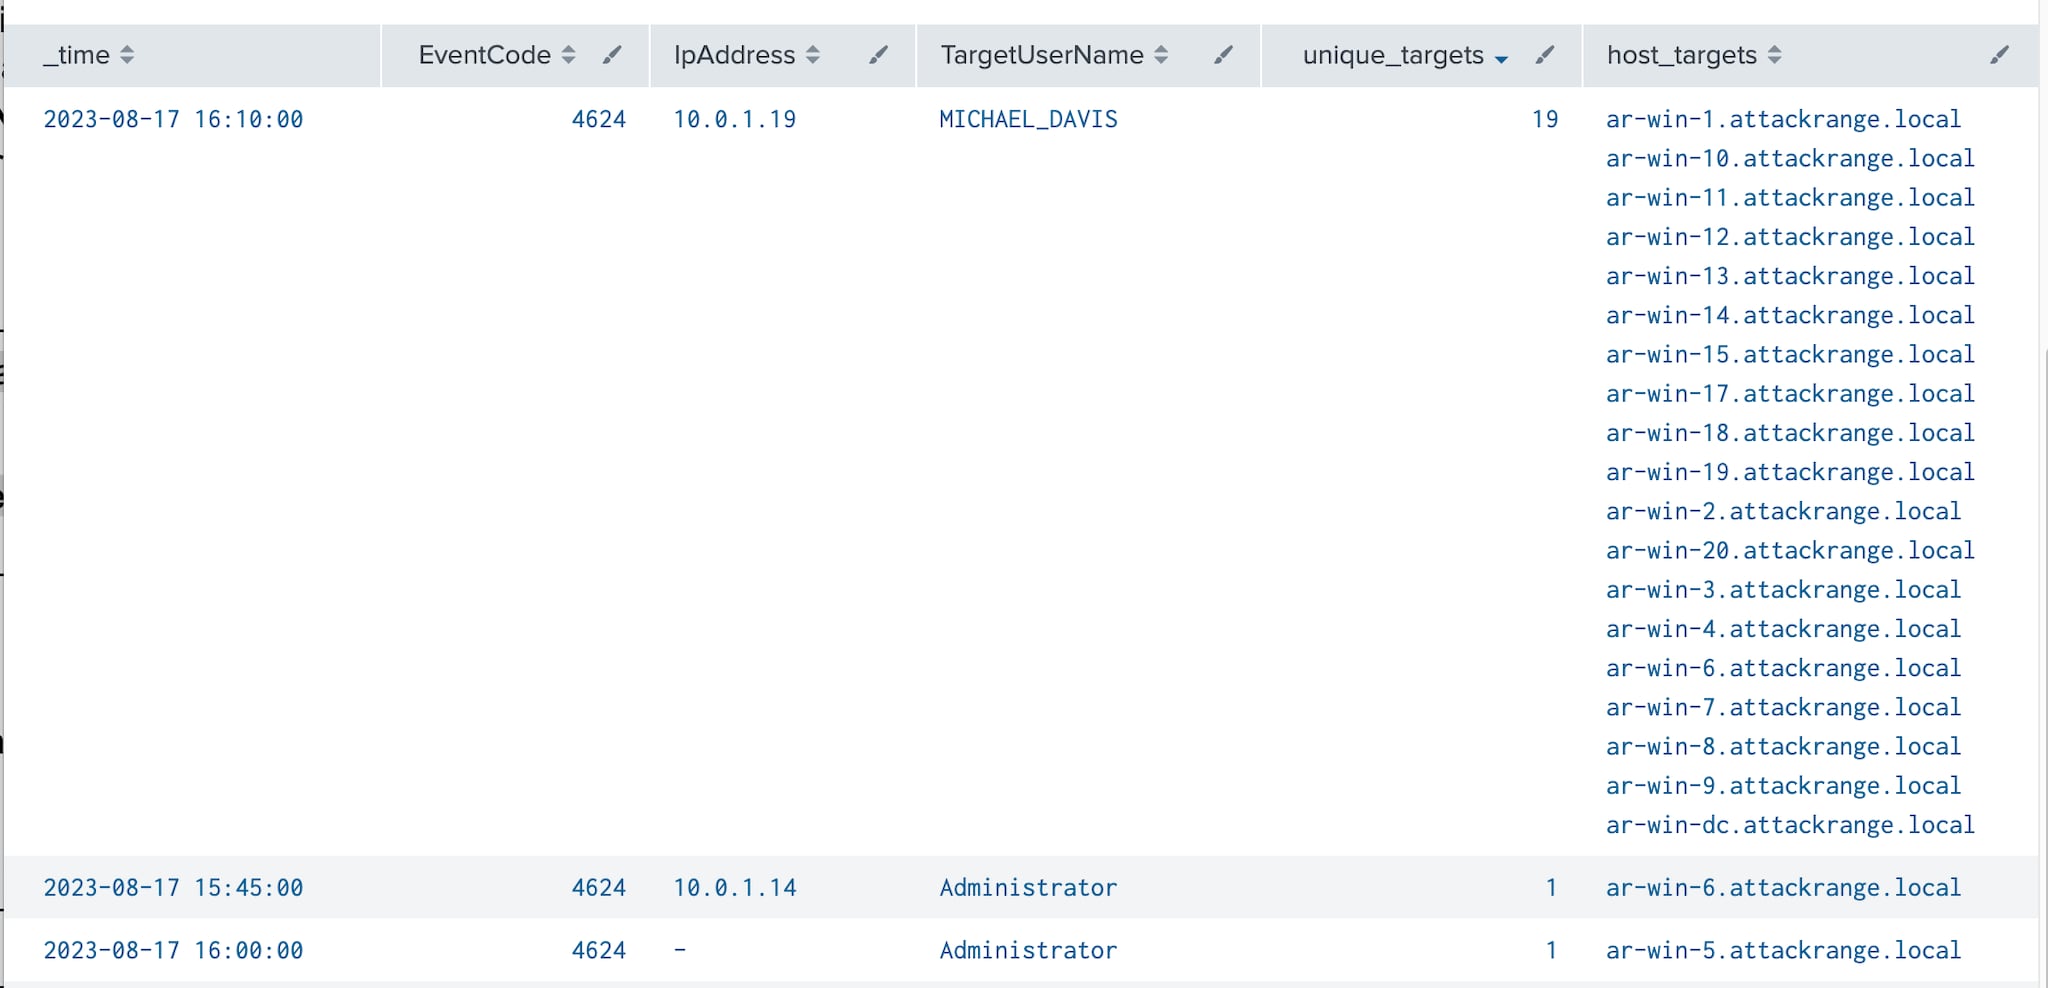
Once again, we can modify the query to leverage the standard deviation and detect outliers statistically.
index=win EventCode=4624 LogonType=3 TargetUserName!="ANONYMOUS LOGON" TargetUserName!="*$"
| bucket span=5m _time
| stats dc(Computer) AS unique_targets values(Computer) as host_targets by _time, EventCode, IpAddress,
  TargetUserName
| eventstats avg(unique_targets) as comp_avg , stdev(unique_targets) as comp_std by IpAddress,
  TargetUserName
| eval upperBound=(comp_avg+comp_std*3)
| eval isOutlier=if(unique_targets >5 and unique_targets >= upperBound, 1, 0)
IPC$ Share Access
Through the testing and execution of the technique, the team learned that the NetShareEnum API actually leverages Microsoft Remote Procedure Call (MSRPC) services and calls the NetShareEnumAll function to enumerate shares. This interaction happens using named pipes over the SMB protocol. Specifically, the srvsvc named pipe is used as the communication channel between the client and server as shown below.
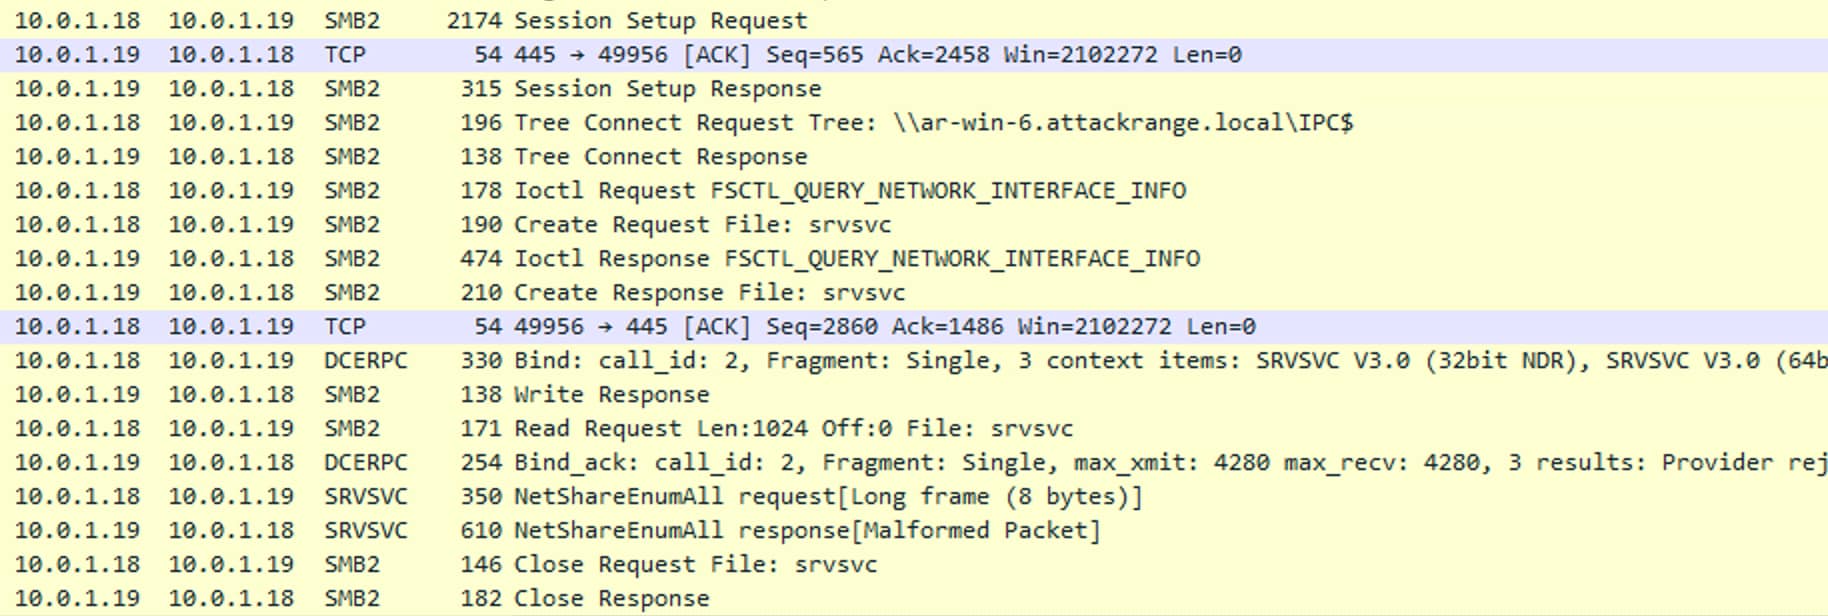
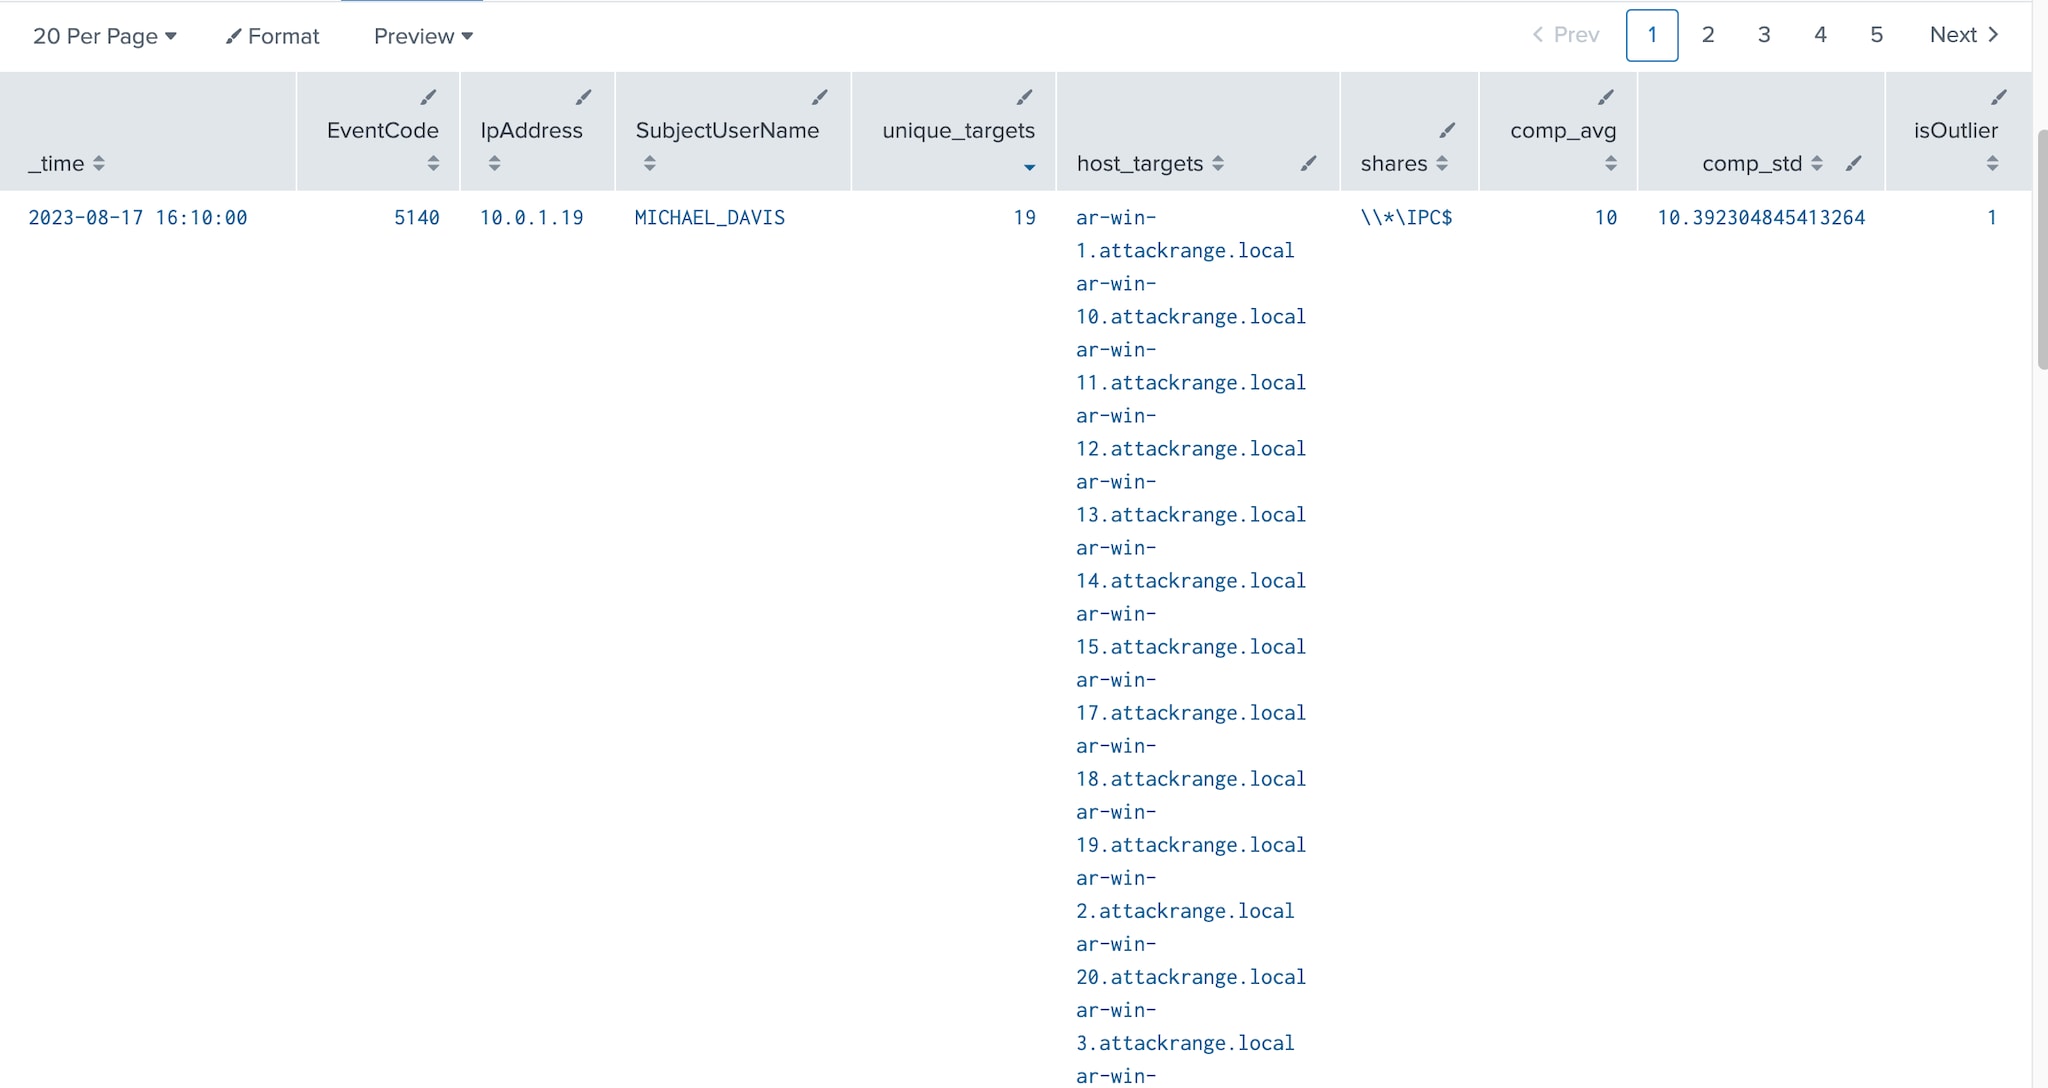
Since named pipes are only reachable from the network via the IPC$ administrative share, identifying a source computer accessing the IPC$ share across multiple hosts in a short period of time may be a sign of an adversary abusing the NetShareEnum API to enumerate shares. To detect this activity, event IDs 5140 or 5145 can be leveraged. These events also provide the IpAddress and SubjectUserName fields that can be used by hunters to identify the source of the enumeration as seen below.
index=win EventCode=5140 OR EventCode=5145 ShareName="\\\\*\\IPC$"
| bucket span=5m _time
| stats dc(Computer) AS unique_targets values(Computer) as host_targets values(ShareName) as shares
  by _time, EventCode, IpAddress, SubjectUserName
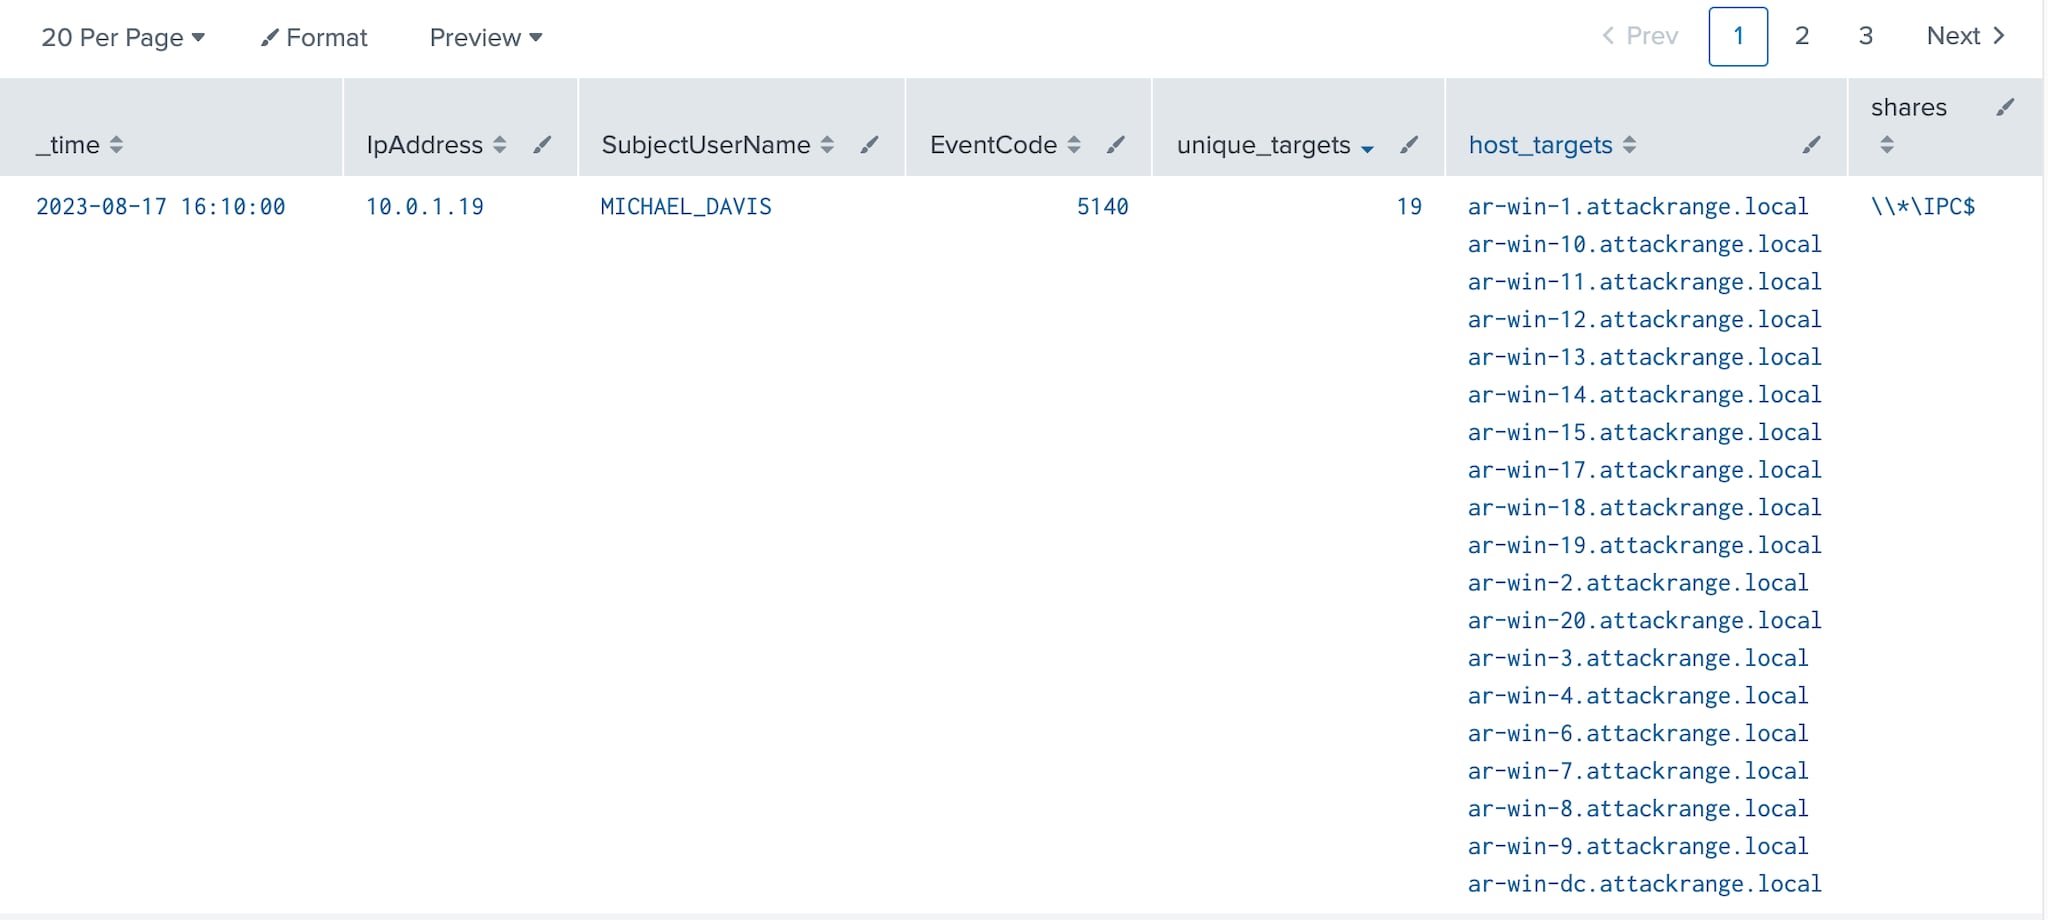
Like the queries above, we can leverage the standard deviation and detect outliers statistically using Splunk.
index=win EventCode=5140 OR EventCode=5145 ShareName="\\\\*\\IPC$"
| bucket span=5m _time
| stats dc(Computer) AS unique_targets values(Computer) as host_targets values(ShareName) as shares
  by _time, EventCode, IpAddress, SubjectUserName
| eventstats avg(unique_targets) as comp_avg , stdev(unique_targets) as comp_std by IpAddress,
  SubjectUserName
| eval upperBound=(comp_avg+comp_std*3)
| eval isOutlier=if(unique_targets >5 and unique_targets >= upperBound, 1, 0)
Special Privilege Logons
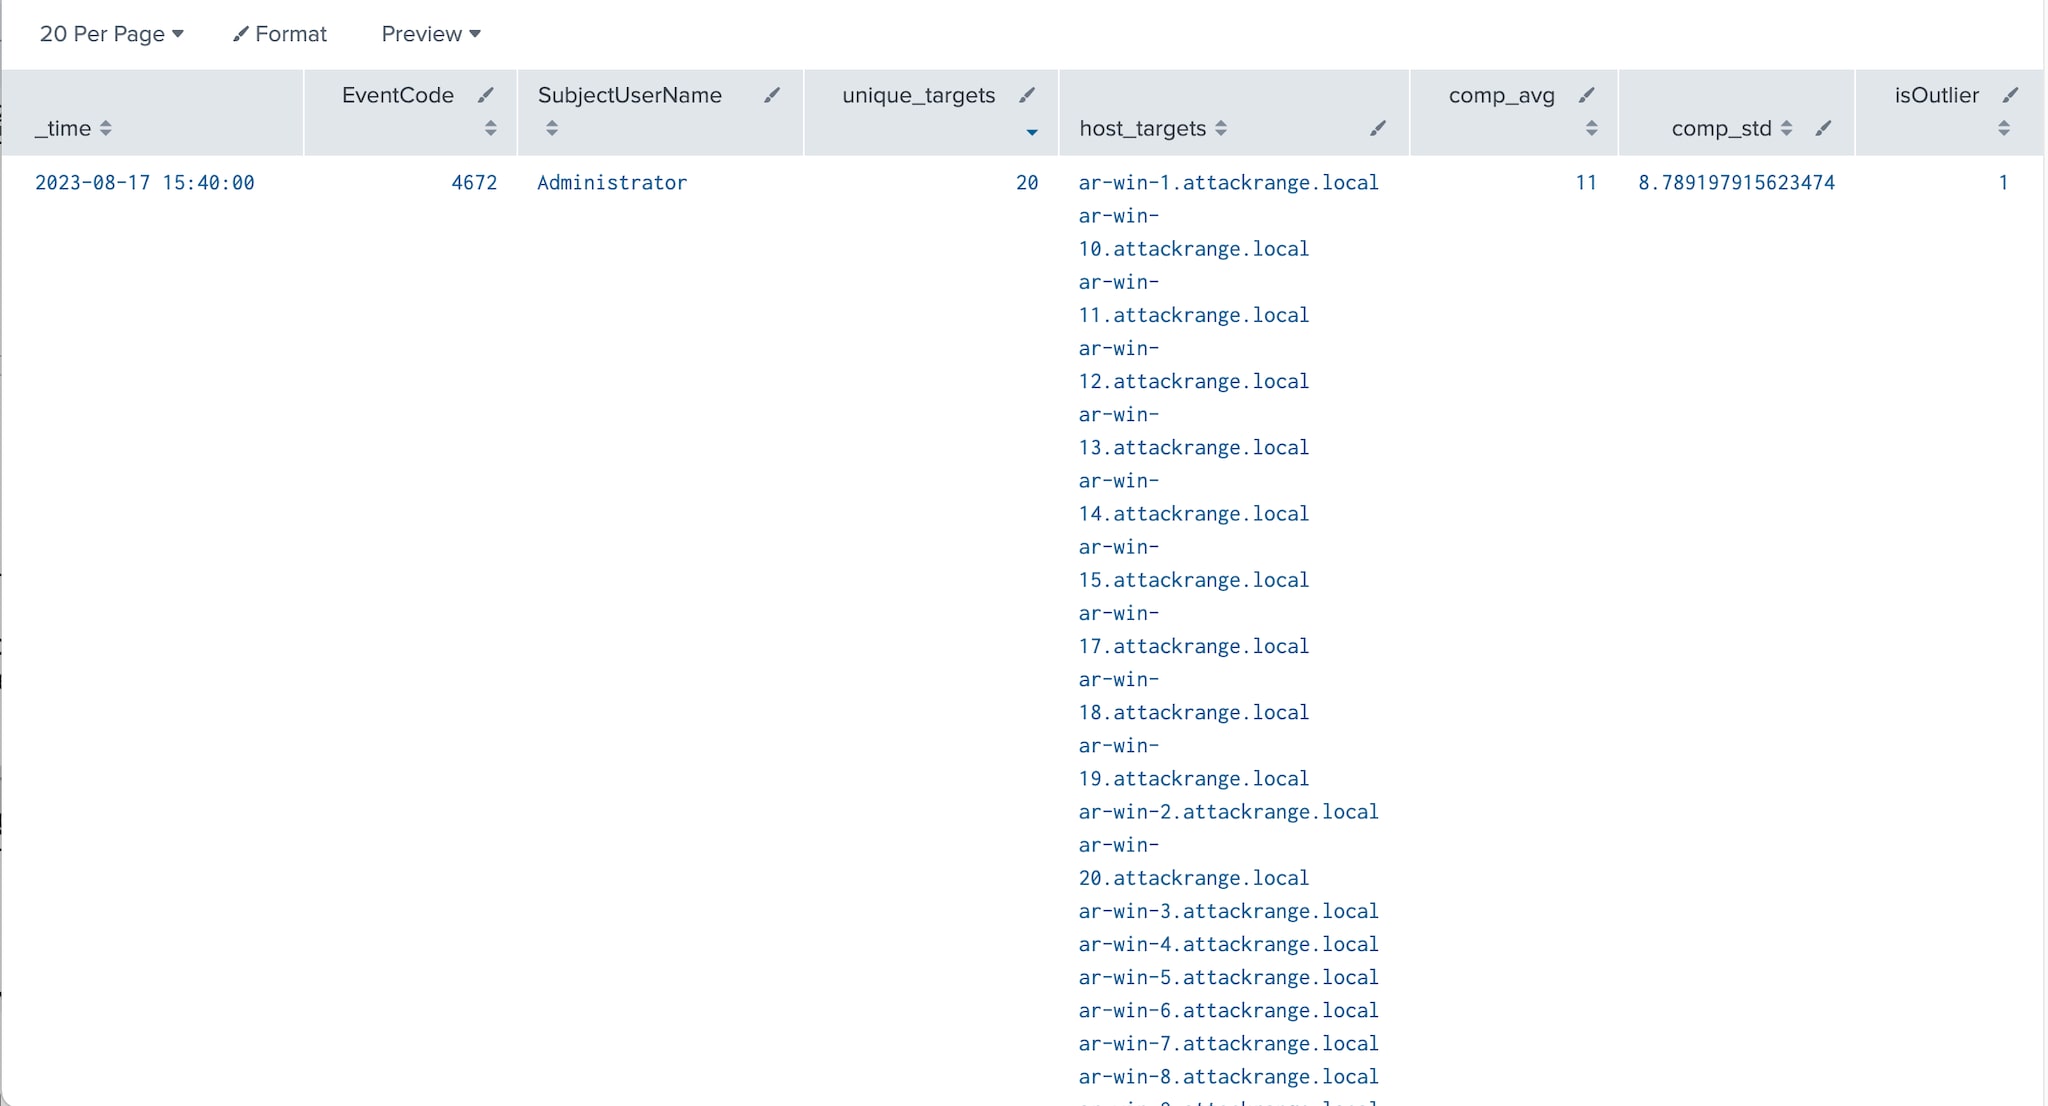
When enumerating shares on a remote host, authentication is required, as identified in the previous hunting queries. In Windows, when a user logs on with elevated privileges, event ID 4672 is recorded to log the special access. This event can be a key indicator when an adversary performs network share enumeration after having obtained privileged access, often in search of sensitive data. In such scenarios, multiple 4672 events may be generated across various hosts in a short period of time, providing a pattern that can be leveraged for detection.
Since 4672 is a locally logged event, the source IP address of the attacking computer will not be identified. However, the user logged in the event in the SubjectUserName field can be leveraged by hunters to identify the source of the discovery.
index=win EventCode=4672 AND NOT(SubjectUserName IN
 ("DWM-1","DWM-2","DWM-3","LOCAL SERVICE","NETWORK SERVICE","SYSTEM","*$"))
| bucket span=5m _time
| stats dc(Computer) AS unique_targets values(Computer) as host_targets values(PrivilegeList)
  as privileges by _time, EventCode, SubjectUserName

The final query leverages the standard deviation to identify outliers.
index=win EventCode=4672 AND NOT(SubjectUserName IN
 ("DWM-1","DWM-2","DWM-3","LOCAL SERVICE","NETWORK SERVICE","SYSTEM","*$"))
| bucket span=5m _time
| stats dc(Computer) AS unique_targets values(Computer) as host_targets values(PrivilegeList)
 as privileges by _time, EventCode, SubjectUserName
| eventstats avg(unique_targets) as comp_avg , stdev(unique_targets) as comp_std by  SubjectUserName
| eval upperBound=(comp_avg+comp_std*3)
| eval isOutlier=if(unique_targets >5 and unique_targets >= upperBound, 1, 0)
Closing Thoughts
In today's complex cybersecurity landscape, understanding the nuances of network share discovery is not just beneficial—it's essential. This post has aimed to arm you with actionable Splunk hunting queries and introduced our custom simulation tool, SharpShareFinder, to deepen your understanding and bolster your detection capabilities
The hunting queries provided in this post are designed to detect an adversary's rapid connections and authentications to multiple endpoints in a short period of time, a behavior necessary for listing network shares. However, this pattern is not exclusive to network share discovery; it's also indicative of lateral movement, a common tactic adversaries use to execute code on remote endpoints. This multi-purpose functionality makes them a valuable addition to your security toolkit.
Finally, the analytics described in this blog post, including many more, are part of the Active Directory Privilege Escalation analytic story, available with all of our other analytic stories at research.splunk.com.
Related Articles
About Splunk
The world’s leading organizations rely on Splunk, a Cisco company, to continuously strengthen digital resilience with our unified security and observability platform, powered by industry-leading AI.
Our customers trust Splunk’s award-winning security and observability solutions to secure and improve the reliability of their complex digital environments, at any scale.


