Reduce False Alerts – Automatically!
Analysts rely on User and Entity Behavior Analytics (UEBA) tools to track anomalies, investigate incidents, and respond to cybersecurity threats. However, the varying nature of user and entity behaviors across different organizations means that predetermined thresholds often fail to account for unique baselines. Even within the same environment, temporal variations can cause significant differences in monitoring signals. For example, there is a contrast between regular workdays and weekends, work hours and off-hours, and holiday seasons, etc. Additionally, user behavior and device usage across different applications introduce further uncertainties into detection models. Consequently, it is extremely difficult, if not impossible, to entirely prevent false alerts from these detection tools. The situation becomes even more frustrating when false alerts, previously flagged by analysts, reoccur. This is inevitable because anomaly detection tools typically draw conclusions based solely on input data without incorporating analysts’ feedback on reported anomalies.
To address this issue, a new offline batch model, the "False Positive Suppression Model," has been introduced in the Splunk User Behavior Analytics (UBA) tool. This model learns from analysts' feedback by utilizing their tagging operations on false alerts. It vectorizes the anomalies into representation vectors through a self-supervised deep learning algorithm. The model then ranks new anomalies and automatically flags those with high similarity to previously tagged false alerts. By incorporating user feedback, the model continuously improves its accuracy in reducing false alerts. In this blog post, we will delve into the techniques used in this model to understand better how to utilize this functionality and demonstrate its effectiveness in reducing false alerts using a demo dataset.
Understanding the Model
As illustrated in the diagram of the false positive suppression model below, analysts can access anomaly information through the user interface (UI) table, which lists anomalies and threats. They can tag alerts as false positives directly through the UI. For Splunk UBA, this process involves tagging the anomaly and adding it to a dedicated "False Positive" watchlist. Once this user feedback is stored in the SQL database, our model utilizes this tagged data from analysts to assess whether new anomalies are also false alerts. To achieve this, the system integrates human feedback into its ranking process. This integration is facilitated by a user feedback learning module, creating an automated loop for suppressing false alerts. As analysts continue to provide feedback, the system becomes increasingly proficient at distinguishing between true and false anomalies, enhancing the accuracy of threat detection and minimizing false positives.
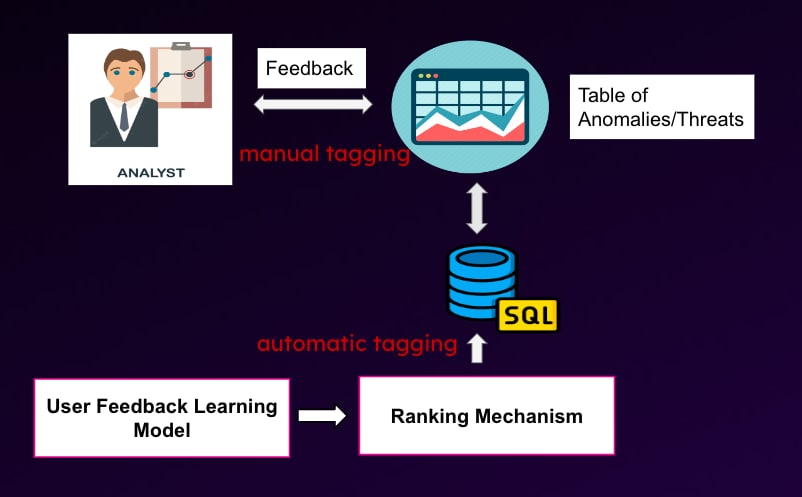
The model generates text from crucial data fields, such as user/entity ID, detection rules/models, feature names and their values, and metadata like descriptions. This text is then used to train representation vectors from raw data without labeling, a process known as self-supervised learning. After training, these vector representations capture the semantic meaning of predefined anomalies, enabling us to rank the similarity between new anomalies and user-tagged false alerts. Anomalies ranked in the top-N or exceeding a given similarity threshold are automatically flagged as false positives.
Using a self-supervised deep learning algorithm to convert anomalies into representation vectors has the advantage of not requiring labeled data. Additionally, this vectorization process transforms complex data points into a structured format for efficient analysis. The model can better capture the relationships and similarities between different alerts by representing anomalies as vectors. This numerical representation allows for comparing new alerts against the existing database of tagged false positives, ranking new anomalies based on their similarity to previously identified false alerts, thus making automatic suppression feasible. Such automatic suppression significantly reduces repeated false positives. This proactive approach helps analysts focus on genuine threats rather than recurring false alarms, avoiding false alert fatigue.
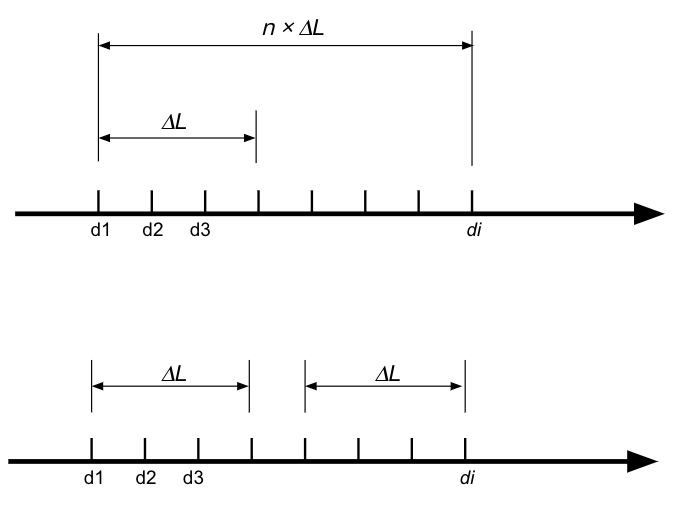
One of the key advantages of the False Positive Suppression Model is its ability to learn and improve incrementally. As depicted in the accompanying figure, there are two main approaches to handling data over the time period  . The first approach involves using all available data points across this period, which can lead to significant computational resource limitations. The second approach involves training the model at intervals of
  and disregarding all previous data, which can result in the loss of valuable information. Instead, the False Positive Suppression Model employs a sliding window mechanism. This approach ensures an overlap between consecutive data slices used for model training. By doing so, the model can incrementally learn from new data while retaining crucial insights from previously learned data, preventing the complete loss of past knowledge. This iterative learning process enables the system to adapt to evolving behaviors and emerging patterns. Consequently, the model remains effective over time, continuously refining its ability to suppress false positives and accurately detect true positives.
This model is set to run every day at 3:30 am, following the execution times of cron jobs of all other offline models, ensuring it can effectively collect and process all the anomalies generated daily by these models. The anomalies produced by streaming models and rule-based detections up to this point will also be processed daily. The sensitivity of automatic false positive suppression can be adjusted using a parameter called thresholdSimilarity, which is defined for this model through the model registry. The default value of thresholdSimilarity is 0.99. Users can increase this value for stricter detection of false positives or choose a smaller value for less strict suppression.
Experiments
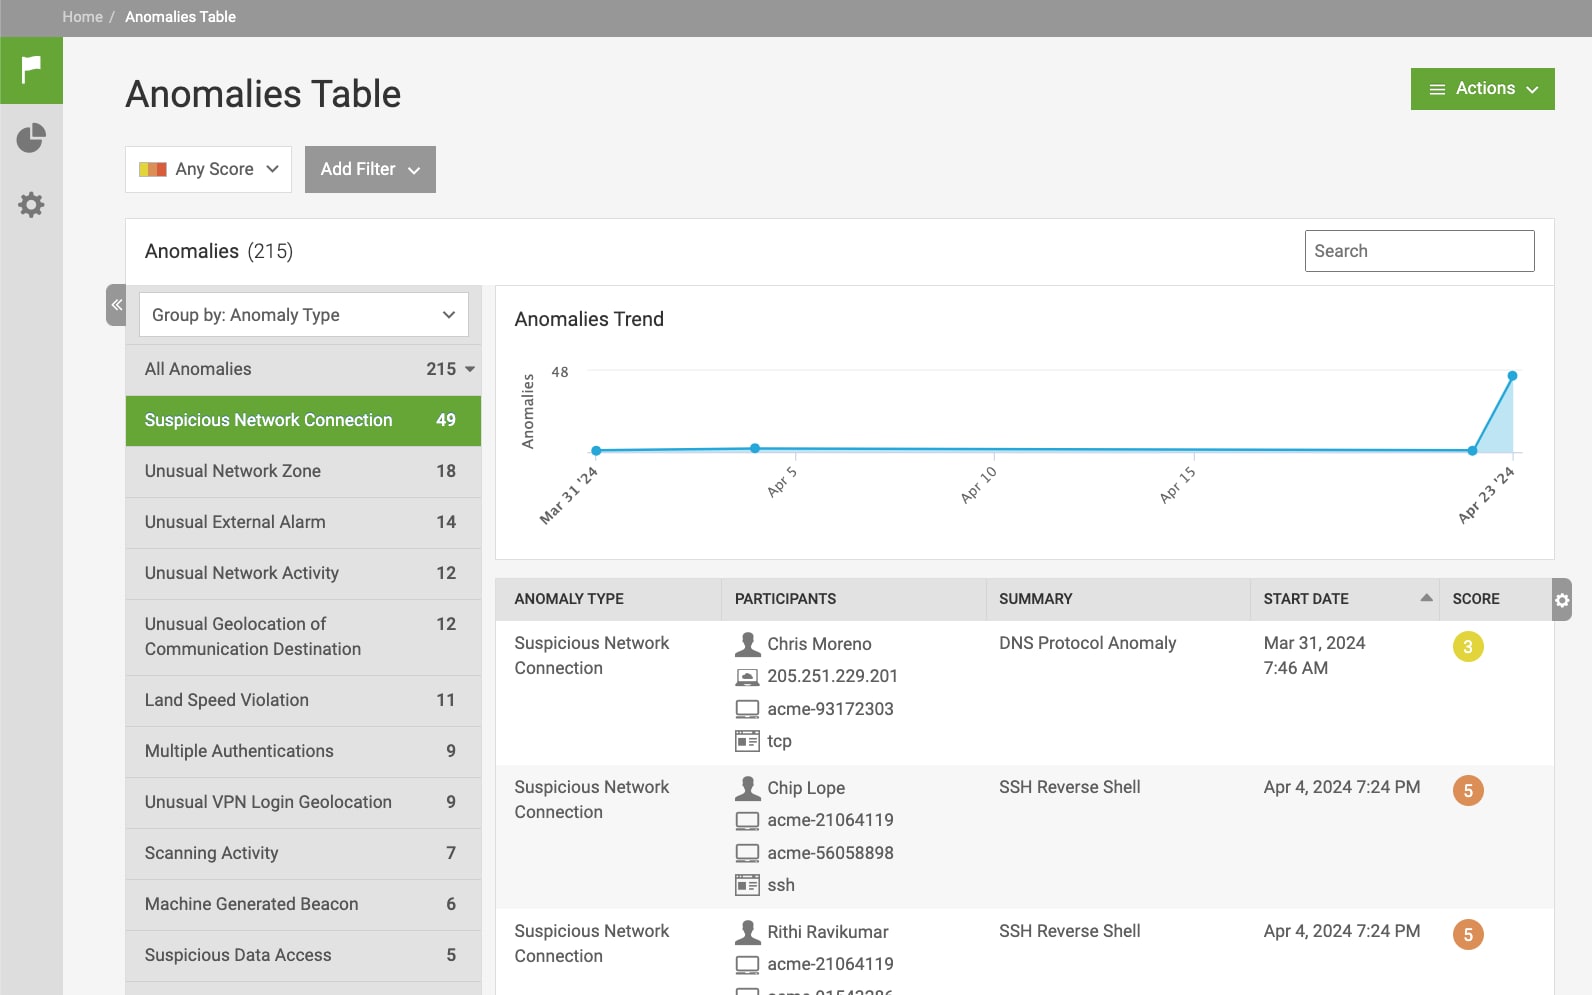
To demonstrate the capabilities of the False Positive Suppression Model, we will use a demo dataset to illustrate its effectiveness in reducing false alerts. As shown in the figure below, this dataset generates 215 anomalies, including 49 Suspicious Network Connection anomalies, over two weeks starting from March 31, 2024. These anomalies are artificially created, meaning that an analyst would have to address these 49 false alerts in a real-world scenario.

Now, if on day one, the analyst conducted an investigation on the DNS Protocol Anomaly incurred by device acme-93172303, as shown in the below figure, and tagged it as a false positive by adding it to the watchlist, afterward, the model consistently identified similar false positives over the subsequent days, flagging 37 out of 49 anomalies in the Suspicious Network Connection category as false positives based on learned human analyst tagging operations.
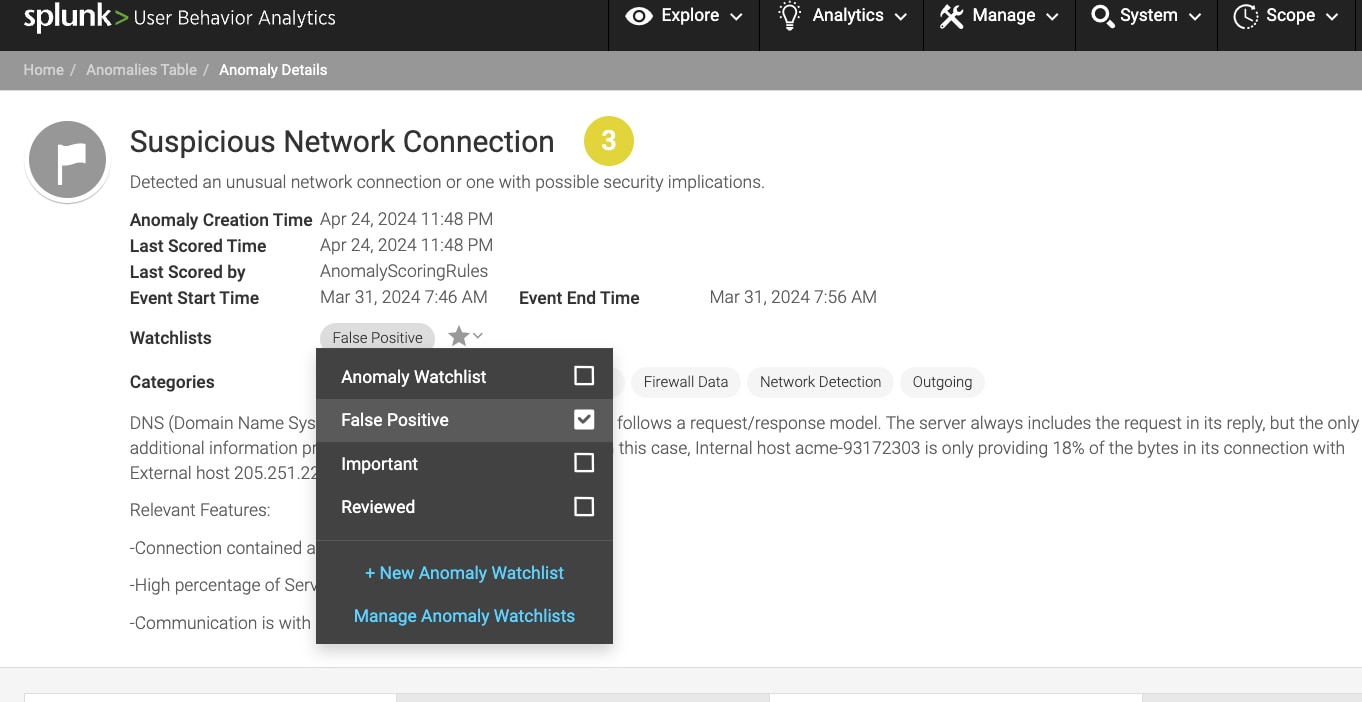
Rather than concealing these detected false positives, they are intentionally marked with a tag, ensuring users can still view them when necessary to prevent overlooking true positives. It's important to note that not all anomalies within the same categories are flagged as false positives; for instance, those summarized as "SSH Reverse Shell" differ notably from the original analyst-tagged "DNS Protocol Anomaly." This divergence is expected and verifies that the model is functioning effectively to a certain extent.
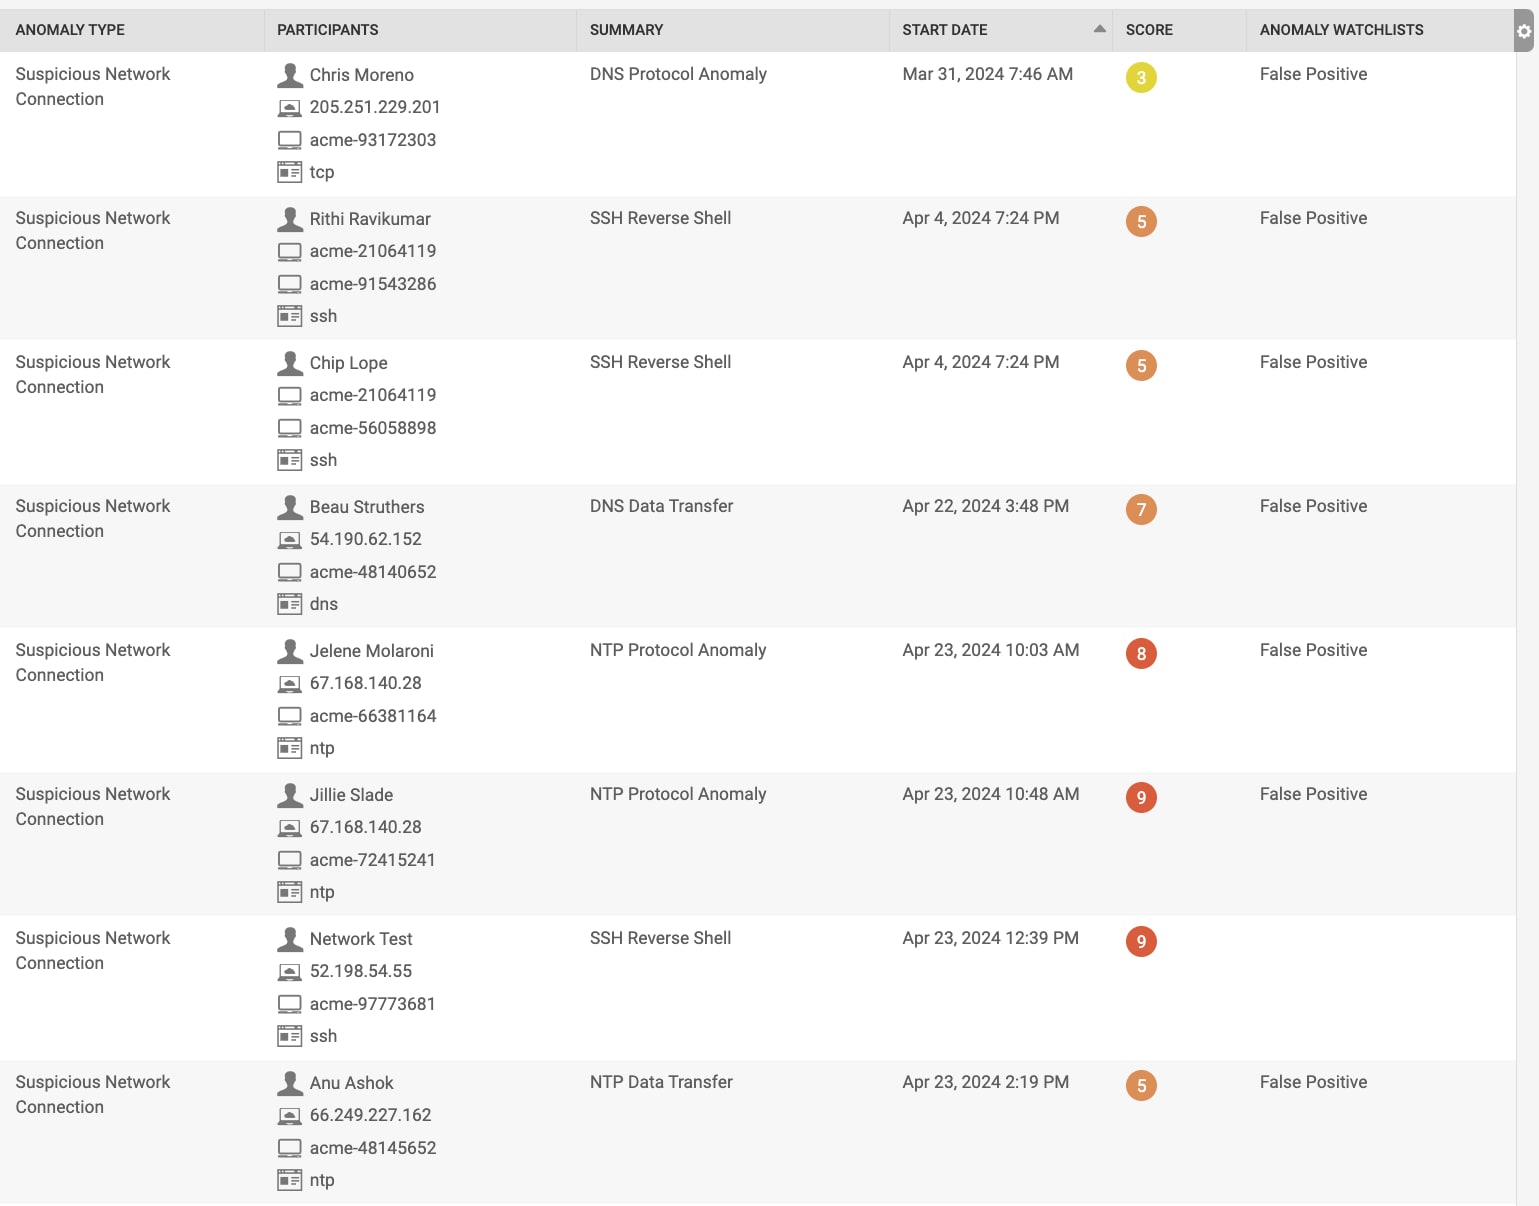
It's important to clarify that the false positive suppression model can only learn from users' tagging of false positive operations and cannot learn from untagging operations. Consequently, if users untag a false positive from anomalies, the automatically tagged false positives by this model, learned from users' tagging operations, cannot be subsequently untagged. Users then have to untag these automatically tagged false positives manually when necessary.
If you want to learn more about this model, refer to Splunk UBA documentation at: https://docs.splunk.com/Documentation/UBA.
Feedback
Any feedback or requests? Feel free to put an issue in Splunk Ideas, and we’ll follow up. Alternatively, join us on the Slack channel. Follow these instructions if you need an invitation to our Splunk user groups on Slack.
Acknowledgments
Special appreciation is extended to the Splunk Product Marketing Team for their invaluable support throughout this project.
Related Articles
About Splunk
The world’s leading organizations rely on Splunk, a Cisco company, to continuously strengthen digital resilience with our unified security and observability platform, powered by industry-leading AI.
Our customers trust Splunk’s award-winning security and observability solutions to secure and improve the reliability of their complex digital environments, at any scale.


