Embracing Observability Tools to Empower Security Incident Response

Companies spend a huge amount of their budget trying to build, manage, and protect cloud environments. Since there is no industry standard for sharing data feeds between development and security, each team is on an island trying to figure out how to keep their side of the room clean. The most robust security incident response teams understand the incredible value of using observability telemetry for security workflows, but are unsure how to make it happen in practice. In this blog, we’ll look at how OpenTelemetry and observability tools can help bridge the gap.
If we could wave a magic wand and give every security team access to this data tomorrow, they could immediately understand how new connections between services, or changes in topology, might be an indication of compromised or altered application behavior. At a glance, security incident responders could use this data to do things like:
- Visualize newly inferred endpoints and identify whether they are safe or malicious external APIs.
- See new database connections and visualize how they work within the larger environment to better understand the threat at hand.
- Understand parent-child identifiers and reconstruct interactions as they move through the application stack so you can more quickly identify and understand malicious behavior.
There are four main reasons that most companies haven't quite figured out how to use observability data for security use cases:
1. Security teams simply lack visibility into cloud native environments
Visibility is inherently an issue with cloud environments. However, since software engineers are the ones developing our business-critical applications, they have adopted innovative ways of achieving the context and telemetry needed to sift through these ephemeral conditions by practicing observability.
Yet today, the concept of "observability" isn't talked about much in the security industry—not in the way that modern operations practitioners tend to talk about it, anyway. Identifying how a service works can take an extended period of working with the operations teams, trying to determine the flow of requests through microservices through logs, or worse, having to rely on active inspection of network flows for debugging.
By adopting observability practices, security incident responders stand to gain huge leverage against threats in the cloud environments that they protect. Being able to quickly determine the flow of requests and data in an environment can really accelerate resolution time.
 2. There is no blueprint for security incident responders to collaborate effectively with developers
We can see the benefits of gaining access to the holy grail of telemetry… but how do we get there when there is no muscle memory for data sharing between teams?
Security incident responders currently rely on their own tools for cloud security and hand it off to developers once they’ve gone as far as they can in an investigation. But even finding out who owns that service on the DevOps side can be difficult, so it’s usually a group Slack or email to “turn that off.” This may solve one immediate problem, but this simple request doesn’t take into account any hits to customer experience or overall application health.
By harnessing new data streams already used by developers, a security team could take the guesswork out of incident response. Instead of seeing something funny on a container and sending a directive, they could follow the trail, understand where the container fits into the entire service configuration, and potentially infer vulnerabilities elsewhere throughout the application.
3. Lack of shared standards for telemetry lead to clunky handoffs
The same challenges currently faced by security teams were first encountered by the engineering teams responsible for developing and hosting cloud applications; and the concept of observability was adopted. Unlike monitoring, which implies an outside-in approach to visibility, an observability practice uses telemetry and context to understand how your application is working in production—no matter the environment. All of this data has security-relevant information, but in order to provide context where security works, they might need to adopt a similar standard for ingesting and processing telemetry.
The easiest way to do this is by using lightweight telemetry platforms such as OpenTelemetry (OTel), which has instrumentation libraries that collect detailed information from within a running application or serverless function. This allows for nuanced use cases that contain a wealth of observability information that also is highly relevant for security practitioners in the form of metrics, traces, and logs from multiple data sources, including OTel receivers, instrumented code for application and infrastructure monitoring, script-based synthetic tests, and Real User Monitoring.
The best part? All of this telemetry is automatically organized at ingest to auto-generate service maps, directed troubleshooting, as well as events such as Kubernetes deployments, container image details, or topology data that provides visibility into how services interact with one another.
4. It seems cost prohibitive, but doesn’t have to be
When companies hear “send observability telemetry to security,” they might start to see dollar signs. And for good reason! With the explosion of cloud applications, we are all running into a data collection issue—it is often not financially feasible to collect 100% of the logs, especially given the exploding masses of cloud application logs.
But in reality, there is an opportunity to reduce costs AND make observability data available to the security incident response team. Firstly, developers are already ingesting metric and trace data that could actually reduce log ingest volume (as logs can also be converted into metrics in some scenarios). Additionally, there may be some duplication between logs ingested for observability and security purposes, so there's an opportunity to further reduce log ingest.
 Let’s See Observability Help Security in a Real-world Scenario
With modern observability tools, your cloud and containerised environments feed observability telemetry back automatically, building a full understanding of who's talking to what, where and when, all the time. Yes, as a security professional, this means you're sometimes going to have to use another tool to find some of the answers you need—but as the players in recent Boss of the SOC (BOTS) events have found—it's not scary at all!
OTel and the OpenTelemetry protocol (OTLP) provides a standardized framework designed to create and manage data such as traces, metrics, and logs. It is vendor- and platform-agnostic, which means that it is being rapidly adopted by a range of platforms. Crucially for practitioners, OTel provides a wide variety of rich data in standard formats.
The OTel Collector, like the Splunk Forwarder, is a flexible tool for collecting and accepting data from many sources. It’s designed for cloud-native or containerised environments and there are many modules tailor-made for every situation. In an environment where O11y has been adopted, it may already be running in the environments that you're trying to secure, so the security team won't be asking for a new agent to be installed—maybe you can remove your specific agent if duplicate collection is going on! Due to the aforementioned standardized logs, your Splunk admins will have less work getting data in as well.
Cost is always a concern with running any platform, and it's easy for us to say "just get all the data"—but the platform-wide visibility that these tools provide, with automatic service mapping and code-level trace investigation, can mean that security AND operations teams spend less time finding that specific bad raindrop in the cloud. As operations and security teams work from the same platform, there's a reduction in overall collection costs as well.
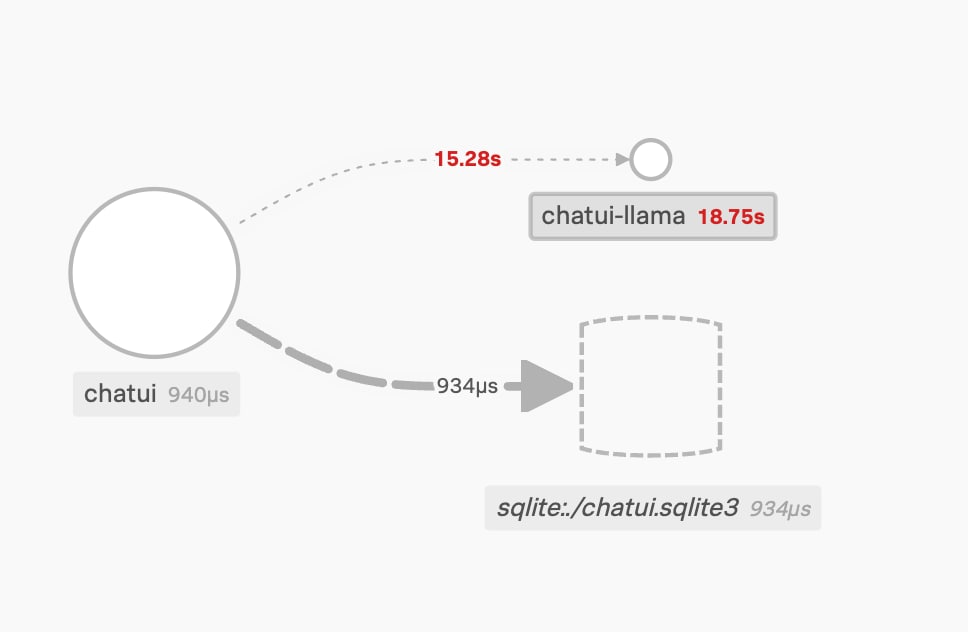
As an example of the visibility that you can get, here’s our example organization’s chat platform running on a normal day. The frontend talks to the database backend and also to the Large Language Model service, providing responses as needed.

Service map, showing connections between elements in our system.
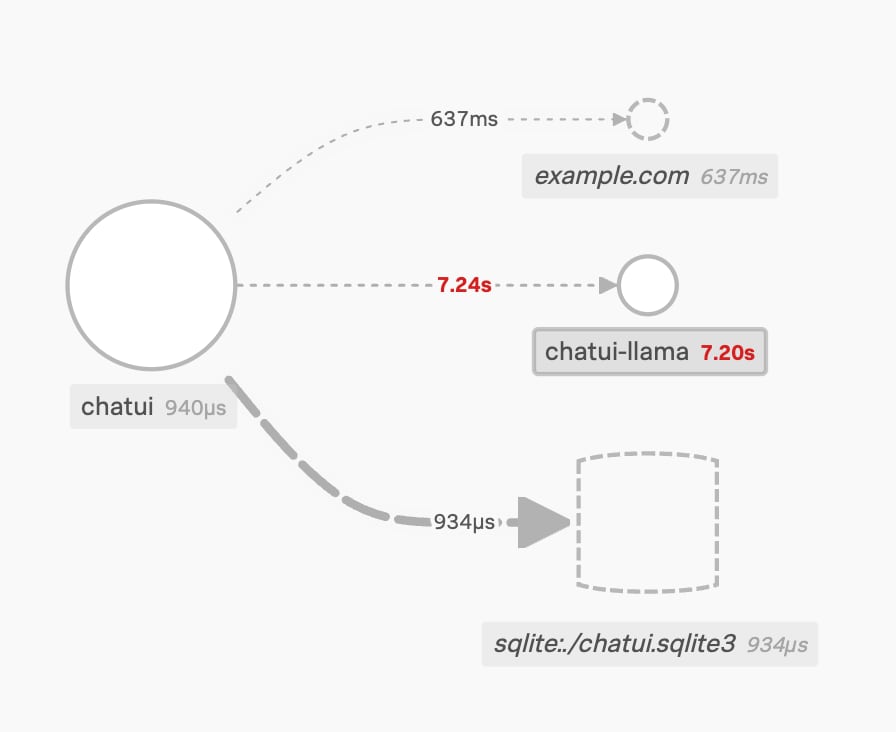
A connection to a new endpoint appears! Now our frontend’s connected to example.com, a service we aren’t receiving telemetry from (note the dashed outline).

The service map updates, showing the new connection.
We should investigate if it’s supposed to be there, as external services may indicate a compromise. Drilling into the trace for that one call, you can identify that it’s made a call to an external service, and that the server it connected to returned a successful result in 637ms.

Zooming in on the trace in Splunk Observability Cloud
Typically, due to a lack of visibility, the context would have been lost or not available (other than maybe the network logs and DNS lookup). Not only do we have the specific call, the timings, and the result, we now know where in the codebase to look! The “handle_job” annotation shows the name of the function, picked up automatically by the OTEL auto-instrumentation. This can dramatically reduce the time spent finding the information to investigate incidents, reducing the time that organizations are impacted.
Gone are the days of relying on tracking down IP addresses to find a host; OTel integrations also identify the specific host and container (or serverless execution environment) where a particular trace executed, providing that deep context that incident responders require to complete their tasks. Instead of a “big hammer” approach of turning off a whole service, you’ll be able to target exactly what’s affected.

Go Forth and Be More Secure!
Whether you’re concerned about maintaining business-critical services, protecting revenue, or stretching budget as far as possible, you can see that the benefits of building muscle memory for collaboration between developers and Security practitioners can be incredibly valuable to any company. With any luck, the growing interest in this topic will catch on so we can continue to bridge the gap and help teams collaborate in action.
Read more about the benefits of adopting OpenTelemetry.
As always, security at Splunk is a family business. Credit to authors and collaborators: Melanie Macari, James Hodgkinson
Related Articles
About Splunk
The world’s leading organizations rely on Splunk, a Cisco company, to continuously strengthen digital resilience with our unified security and observability platform, powered by industry-leading AI.
Our customers trust Splunk’s award-winning security and observability solutions to secure and improve the reliability of their complex digital environments, at any scale.


