Building At-Scale User Behavior Analytics for Splunk UBA: Enhance Performance of Account & Device Exfiltration Models

In our previous blog of this series, we presented typical strategies to prevent the whole UBA system performance from downgrading at an early stage. Then, we introduced a sample notebook to demonstrate how to validate data and monitor models to gain insights into the scalability of UBA clusters. In this blog, we will discuss how the scalability performance of Account and Device Exfiltration models can be achieved in Splunk UBA V5.4.0.

Figure 1: Suspicious data movement detected by account and device exfiltration model
UBA addresses data exfiltration by combining multiple batch models and security rules. Among these, the Account and Device Exfiltration models, driven by machine learning, have been identified to encounter recurring scalability issues. The Account Exfiltration model constructs user profiles to identify malicious data movement behaviors, considering various types of data transfer per account, while the Device Exfiltration model concentrates on monitoring device activities, especially the volume of traffic leaving the network, to detect data transfers per device. Both models analyze HTTP/Firewall data, processing inter-firewall-zones LAN transfers and WAN transfers to countries that deviate from standard behavior patterns.
The volume of outgoing traffic analyzed by the two models is derived from multiple data sources, such as firewall logs, web proxy logs, or email logs that contain information on outgoing bytes. By default, the models process the past month’s history of daily network activities for users and devices to establish behavioral baselines for configurable peer groups (default: OUGroup). Such baselines enable the immediate detection of malicious behaviors, even for those newly created accounts or devices. However, dealing with substantial volumes of 30-day history data on network traffic collected within an hourly integration interval poses a huge scalability challenge for both the models and UBA clusters.
Dealing with exceptionally vast datasets, the primary challenges observed included prolonged execution times (>2 hours) and substantial disk/memory spills. In Splunk UBA 5.4, Account and Device Exfiltration models (V2.0) have incorporated several strategies to effectively mitigate the previously encountered scalability issues, with plans to extend some of these solutions to other models. In the new version, customers can adjust the minimum mathematical anomaly score (threshold), the minimum suspiciousness threshold (anomalyScoreThreshold), and the maximum number of anomalies (anomalyCountThreshold) from their model registration and configuration file (ModelRegistry.json). This configuration prevents the model from crashing due to over-threshold EPS and invalid data streaming, which results in generating an excessive number of anomalies for UI output. In most cases, customers won’t need to tune this parameter.
The models are further enhanced by leveraging Spark optimization techniques. Notably, we have refined the source code to enable the strategic persistence of frequently accessed data frames in memory. This approach significantly boosts performance by minimizing redundant operations and expensive recomputations of intermediate results. Moreover, we ensure optimal resource utilization by unpersisting these large data frames in a timely manner when they are no longer required, thereby freeing up valuable memory resources for other tasks. Additionally, during the cyber contextual enrichment process, we introduced a new User Defined Function (UDF) to restrict the number of anomalies that have suspiciousness scores lower than user-defined thresholds. Furthermore, enhancements have been made to various Spark aggregation and pivot transformations. For example, the spark performance is significantly enhanced by explicitly defining the distinct values present within the columns used for pivoting.
In parallel, we implemented an optimization by capping the size of list aggregations. This measure prevents excessive resource consumption and potential performance bottlenecks associated with large collection sizes. We also optimized Spark's resource allocation and execution strategy by reducing the complexity and uncertainty in the data transformation process and ensuring efficient memory management. These optimizations are particularly beneficial in large dataset scenarios, where execution planning and resource management are critical for performance and scalability. Extensive performance tests have been conducted to demonstrate the effectiveness of these optimizations.

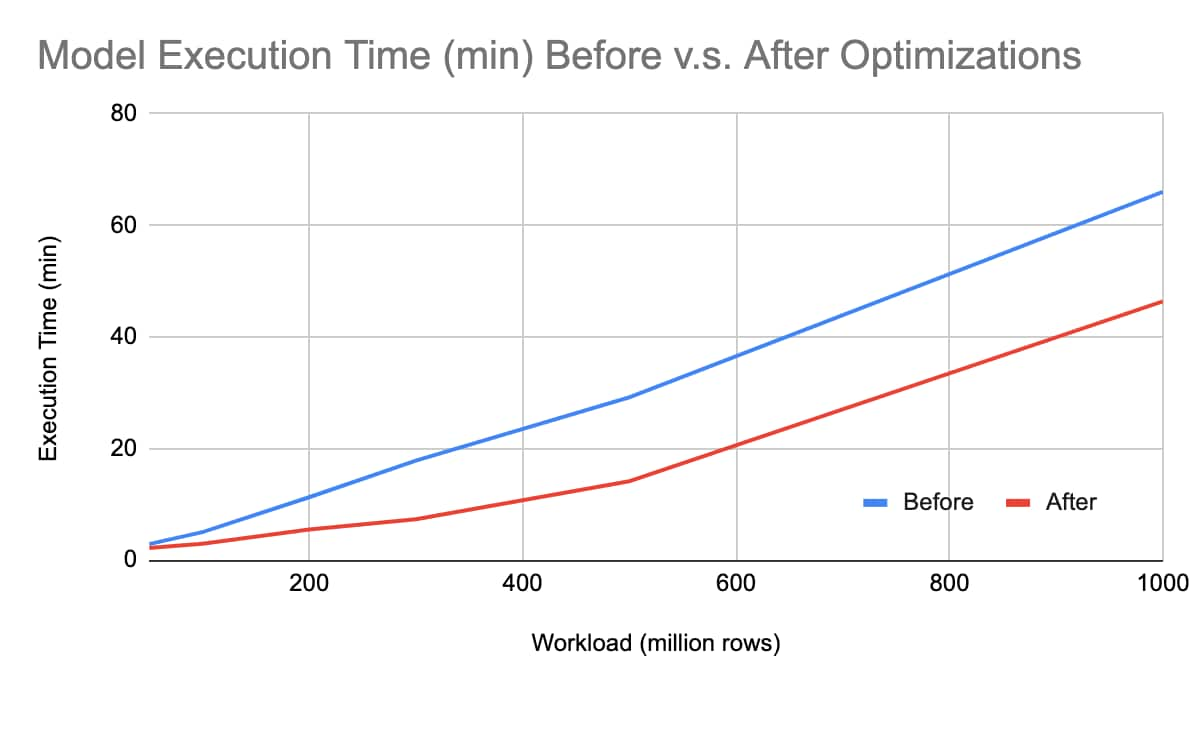
Figure 2: Model execution time before and after optimization
Our performance tests were conducted on a 10-node UBA cluster, utilizing Splunk UBA default Spark cluster settings. We conducted performance tests across multiple scales from 50, 100, 200, 300, 500 million to 1 billion records. As depicted in Figure 2, the averaged model execution time exhibits improvements between V2.0 and V1.0, showcasing enhancements of 24.04% (50 million records), 41.75% (100 million records), 51.15% (200 million records), 58.78% (300 million records), 51.51% (500 million records) and 29.74% (1 billion records).
 |  |
Figure 3: Max shuffle write and read size before and after optimization
There are also significant improvements in Max Shuffle Write/Read size, which improved from the previous version 62.07/67.81% (50 million records), 66.68/71.60% (100 million records), 65.65/70.23% (200 million records), 70.51/74.24% (300 million records), 67.39/70.63/% (500 million records) and 65.77/71.50% (1 billion records).
 |  |
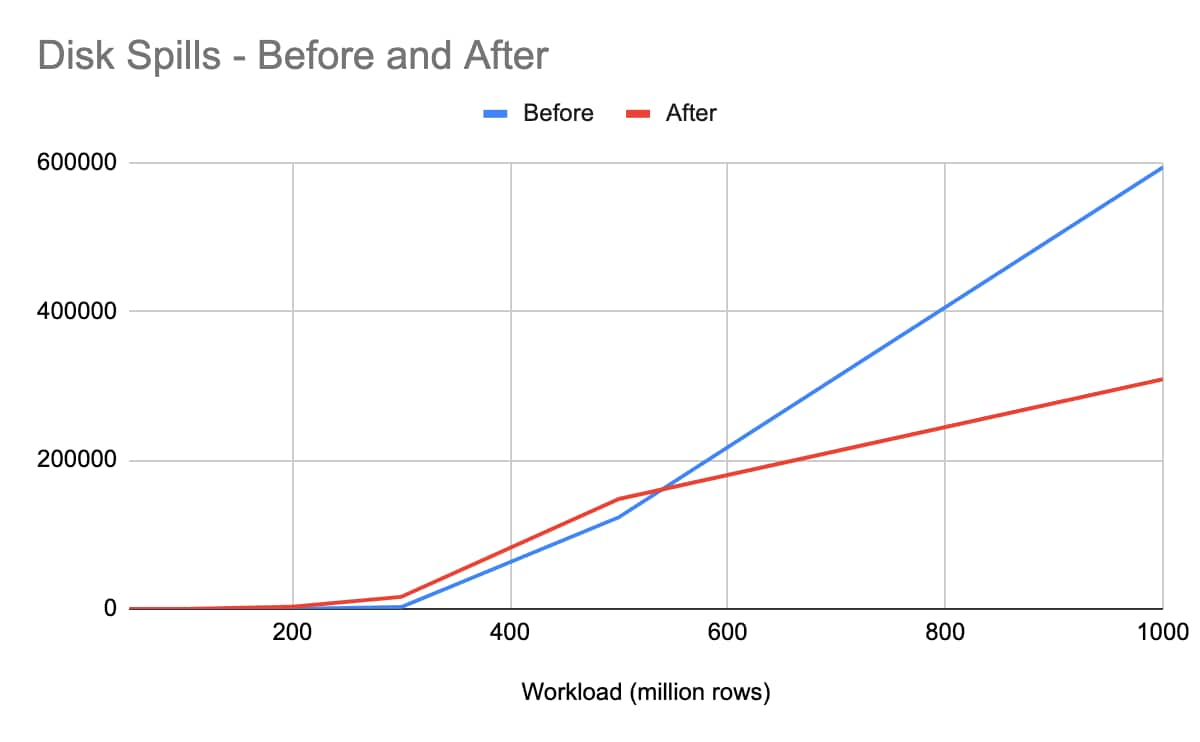
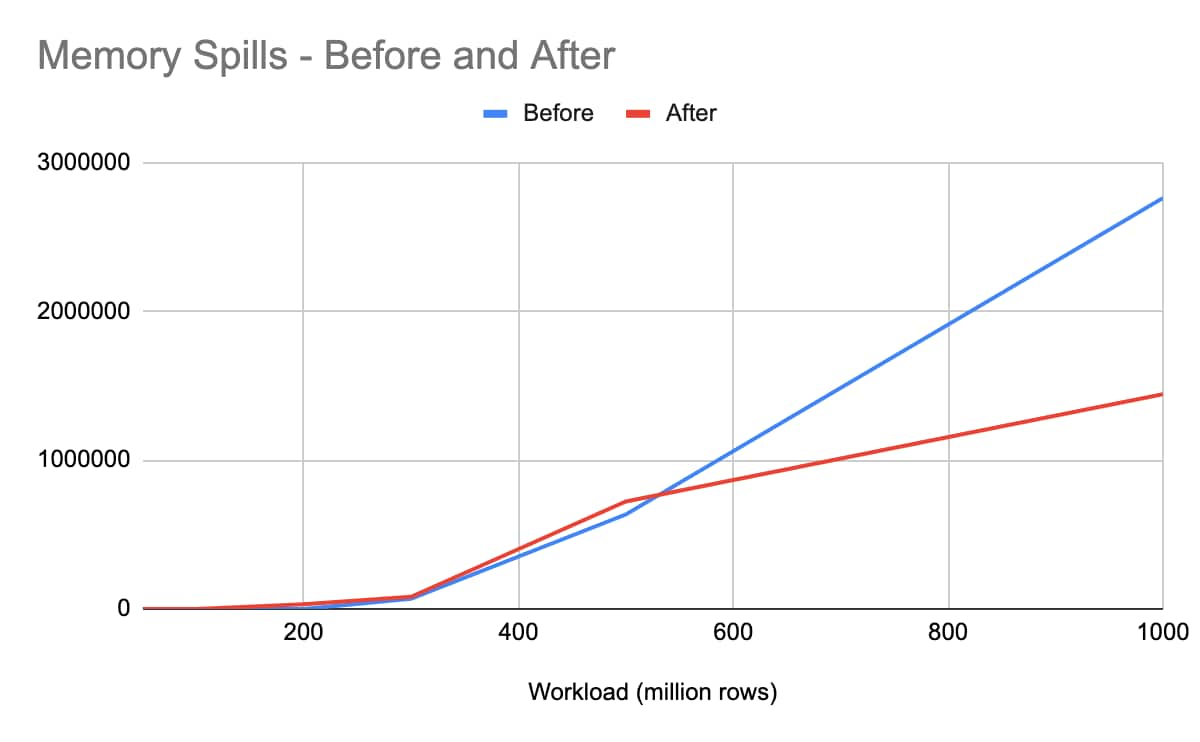
Figure 4: Disk and memory spills before and after optimization
Regarding Max Disk/Memory Spills, no disk/memory spills were observed for 50 and 100 million records. Although disk/memory spills slightly increased for 300 and 500 million records in the new version, shuffle write/read performance improved 47.99%/ 47.75% from 1 billion records and above.
For the Device exfiltration model, the execution time demonstrated a 23.72% improvement with the optimization for 50 million records and a 38.17% improvement for 300 million records. Shuffle write/read performance showed improvements of 57.30/56.42% at 50 million records and 52.34/62.92% at 300 million records. No disk/memory spills were observed at the 50 million scale.
We also tested the performance with parameter tuning. A couple of parameters may significantly affect the number of anomalies.
threshold
Adjusting the threshold (e.g., from 0.01 to 0.05) may significantly reduce the number of anomalies. Typically set at no more than 0.05, this threshold determines the p-value. Lowering the threshold may limit the model's ability to generate fewer anomalies.
baselineDays
Reducing this parameter (e.g., from 10 to 5) can significantly decrease runtime by reducing the amount of historical data to be processed. However, with such a short time frame, the baseline behaviors may not accurately reflect the true patterns.
anomalyScoreThreshold
Lowering this parameter (e.g., from 1 to 3) may decrease the number of anomalies, which is especially useful when many anomalies with identical scores are generated. However, this parameter should be tuned cautiously.
anomalyScore
Maintaining the baseline score value is generally recommended. Altering this parameter can have a cascading impact on other parameters.
anomalyCountThreshold
This parameter limits the maximum number of anomaly outputs. Setting a reasonable value (e.g., 1000) helps avoid an excessive number of outputs flooding logs due to invalid data.
minFeatureThreshold
This parameter specifies the minimum number of days a norm measure has been calculated for an entity. This tuning should be aligned with baselineDays; decreasing this parameter further when baselineDays is decreased is not recommended. Increasing this parameter may reduce anomalies and enhance algorithm precision.
In this blog, we discussed scalability challenges in UBA account and device exfiltration models, highlighting substantial enhancements implemented to improve their scalability significantly. We also discussed parameter tuning influencing model performance results. In Splunk UBA V5.4, we also improved the scalability performance for UBA time series models such as Unusual Volume of File Access Related Events per User Model, Unusual Volume of Data Uploaded per User/Device Model and Rare event models.
Special thanks to Che-Lun Tsao from the Splunk Performance Scalability Reliability team for his valuable contributions to this blog and his dedication on building UBA performance test framework.
Related Articles
About Splunk
The world’s leading organizations rely on Splunk, a Cisco company, to continuously strengthen digital resilience with our unified security and observability platform, powered by industry-leading AI.
Our customers trust Splunk’s award-winning security and observability solutions to secure and improve the reliability of their complex digital environments, at any scale.


