
Digital Resilience Pays Off
How resilient is your organization? Learn how to mature your digital resilience with this free guide.
In Splunk Cloud Platform 9.3.2411, we’re excited to announce support for publish dashboards, the button input, as well as a number of small enhancements that will level up your dashboarding experience.
Customers often build powerful dashboards filled with key insights and data, perfect for sharing with stakeholders. However, given the sensitive nature of the information housed in Splunk, customers have frequently requested a secure way to share dashboards without granting full access to their Splunk environment. In fact, it’s our top voted feature request on Splunk Ideas!
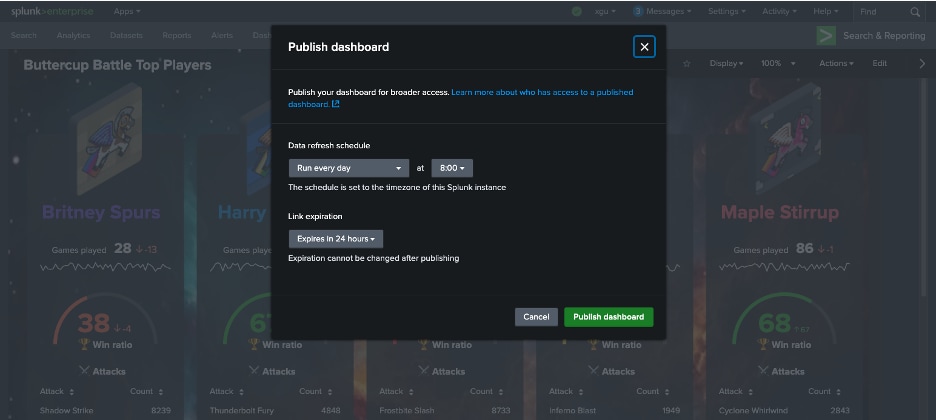
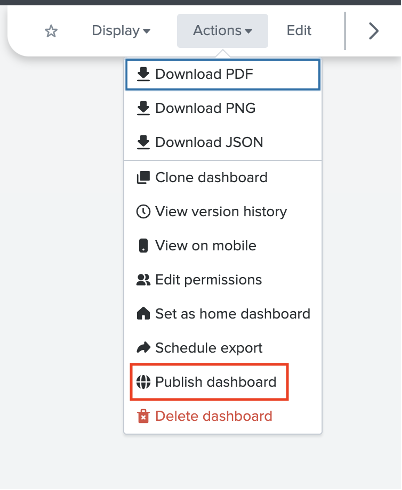
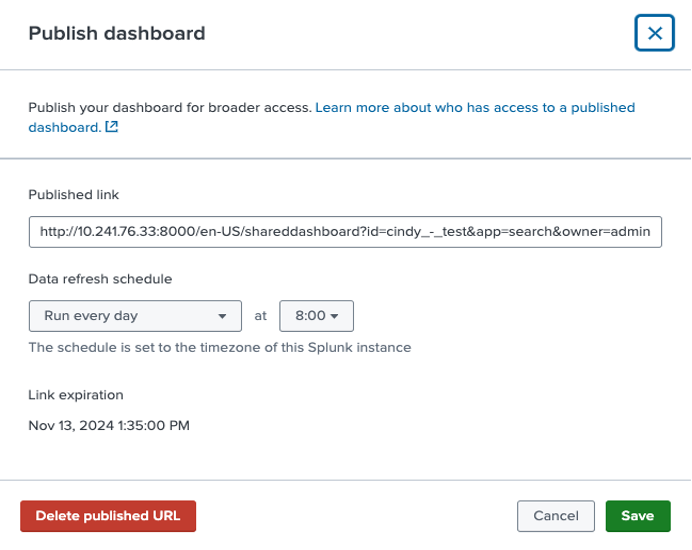
Starting in Splunk Cloud Platform 9.3.2411, you will be able to publish your Studio dashboards from the “Actions” dropdown. Publishing a dashboard provides a way for viewers to access a dashboard without logging in.
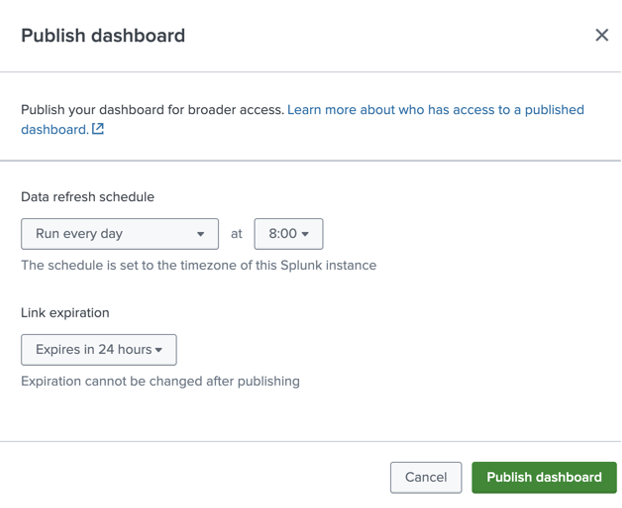
In the “Data refresh schedule” dropdown list, you can select how frequently you want the dashboard’s data to update. You can also set an expiration date for the published dashboard link. After the selected expiry date, the link will automatically deactivate, ensuring the dashboard is no longer accessible.
And that’s it! Once the dashboard is published, you can copy the published dashboard’s URL to share with your dashboard viewers.
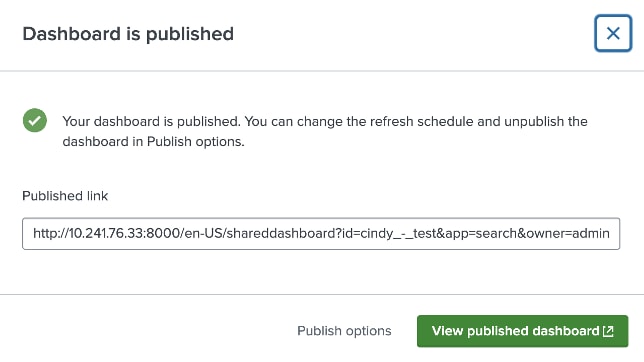
Once your dashboard is published, you can preview it by selecting "View published dashboard". For more detailed management options—such as viewing the published link, adjusting the refresh schedule, viewing the expiry date, or deleting the published link—navigate to "Publish options". This modal can also be accessed through the "Publish dashboard" option in the “Actions” dropdown list of your published dashboard.
There are a few limitations for this initial release that we're still working on, such as not being able to run searches on demand in published dashboards. You can learn more by visiting our docs.
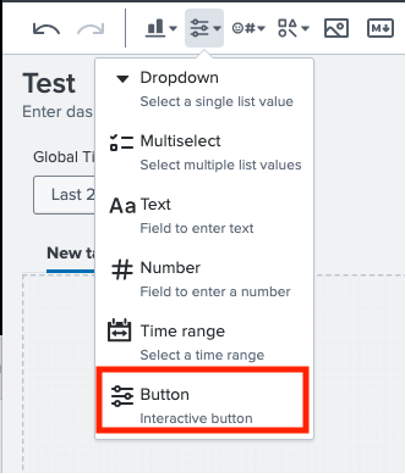
We’ve seen customers manually build buttons in Classic dashboards using custom JS and implement hacky workarounds in Studio for navigation, token setting, and more. Those days are gone as we introduce the button input, adding enhanced interactivity to dashboards.
Find the button input from the “Add input” dropdown.
Buttons can be placed in the global input section or within a canvas. You can also customize the button label.
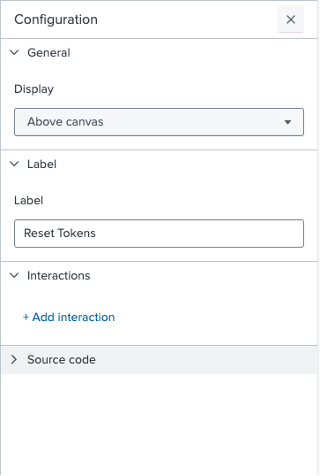
You can configure multiple interactions to be performed when the button is clicked, including the familiar “Link to” flows and “Set tokens”.
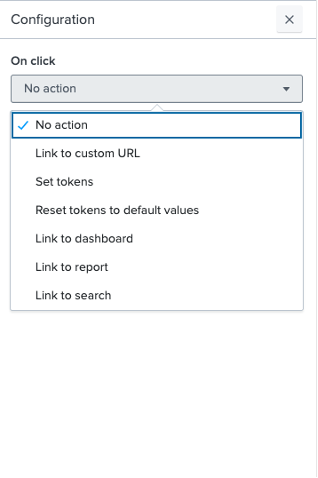
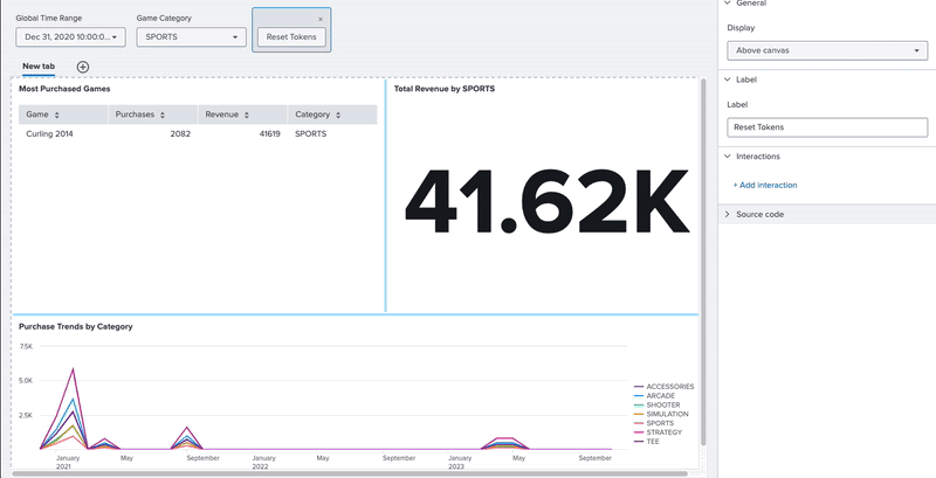
Something new you might have noticed is the “Reset tokens to default values” interaction, which lets you reset a subset of tokens, specific namespaces, or all tokens on the dashboard to their default values.
Check out Dashboard Studio and send in your feedback through Splunk Ideas, and you might see your feature request listed on a future blog's "coming soon" list! We are continuing to work on new capabilities, which are delivered incrementally with Splunk Cloud Platform and Splunk Enterprise releases.
Next up….
* This information is subject to change at any time, at the sole discretion of Splunk Inc. and without notice. This roadmap information shall not be incorporated into any contract or other commitment. Splunk undertakes no obligation to either develop or deliver any product, features, or functionality described here.

The world’s leading organizations rely on Splunk, a Cisco company, to continuously strengthen digital resilience with our unified security and observability platform, powered by industry-leading AI.
Our customers trust Splunk’s award-winning security and observability solutions to secure and improve the reliability of their complex digital environments, at any scale.

Get the latest articles from Splunk straight to your inbox.
© 2005 - 2025 Splunk LLC All rights reserved.
