Splunk is excited to announce the general availability of the all new overview dashboard — a modern, intuitive, and insight-driven landing page for the Cloud Monitoring Console (CMC) app. This dashboard is designed to replace the old landing experience, bringing critical monitoring data from across the CMC app front and center, helping cloud admins gain faster insights and make informed decisions with ease.
With a streamlined layout, enhanced visualization, and personalized metrics, the overview dashboard empowers you to accelerate time to value and optimize your deployment performance like never before.
What’s new in CMC?
CMC’s new overview dashboard is generally available (GA) now starting with CMC 3.35.0. The new dashboard bubbles up the most important information from across the CMC app to help cloud admins (sc_admins) draw quick insights about their deployment performance and operation.
Overview dashboard provides the following to make it easy for you to manage/monitor your deployment performance:
- Summarized insights: View a summary of items that need your immediate attention dynamically displayed on your dashboard when they become urgent or critical allowing you to stay ahead of problems.
- Personalized view: Choose the metrics you care about to show up on your dashboard including license utilization metrics making it easy to monitor things important for your deployment.
- Set guardrails: Access powerful tools and resources directly from your overview dashboard to proactively set rules to prevent inefficient end user searches.
- Find in CMC: Discover metrics across the entire CMC app using the search bar that locates the link to the source dashboard containing that metric.
Understanding the new Overview Dashboard structure
The dashboard is structured in three main sections:
- Attention required
- Top metrics
- Optimization resources
Let’s take a closer look at each of these sections and learn how to navigate them.
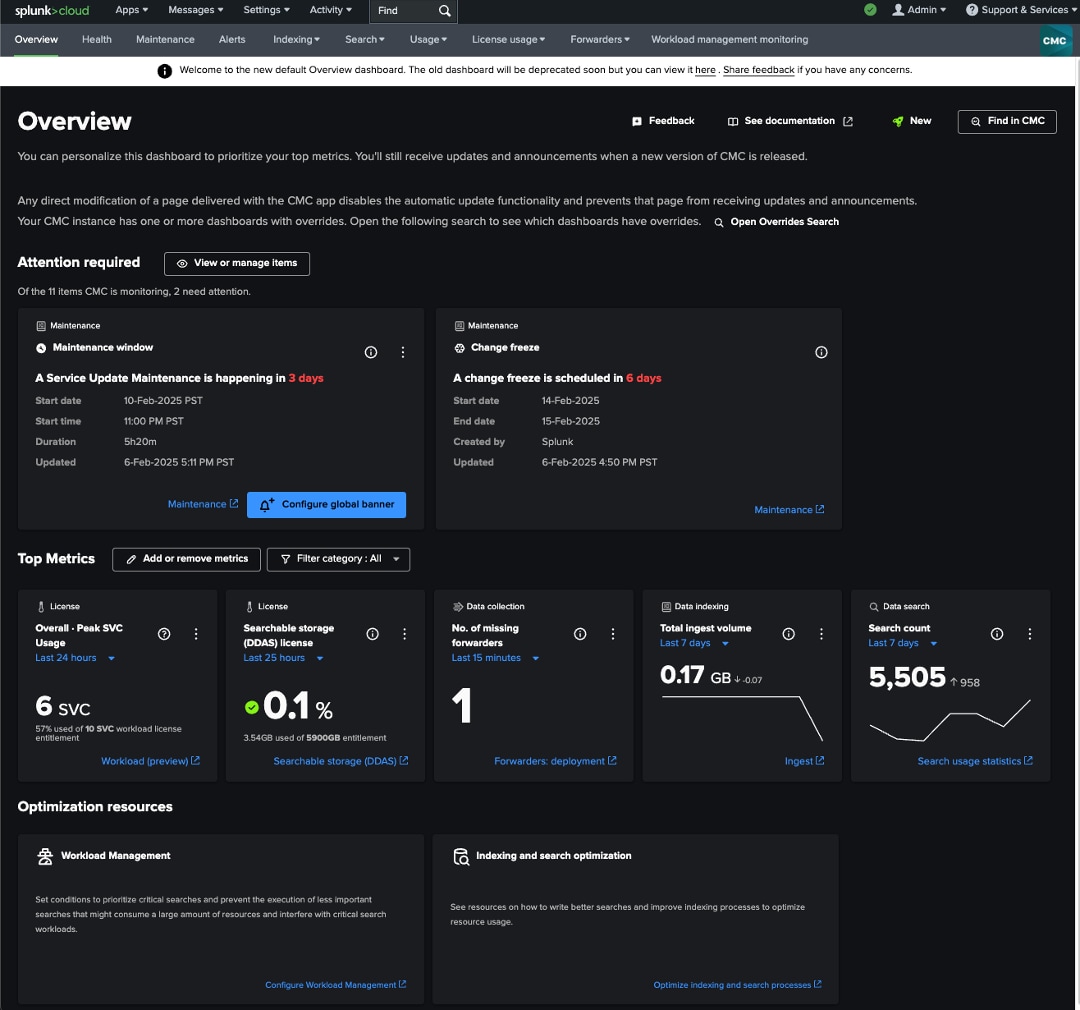
In this screenshot you can see the three main sections of the overview dashboard, attention required, top metrics, and optimization resources.
Attention required
This section is designed to provide you with a quick summary of everything CMC is monitoring across various dashboards for your deployment and show you what needs immediate attention.
If there is anything urgent/critical of all the things being monitored, you will see detailed information about these, presented in dedicated cards populated in this section. Each card contains:
- Information to understand the issue
- The ability to configure an alert
- A drill down leading to the source dashboard in CMC to help you further investigate or take action
You can also choose to personalize this section by clicking on the “View or manage items” button which allows you to ignore any item you do not want to see tracked for your deployment on the overview dashboard.
Top metrics
Located directly below the Attention required section, this section is your one stop shop to view metrics that you want to always see on your CMC landing page.
To start, take a look at the available metrics in the selection modal and choose from the available list of metrics. Here you can find license entitlement and usage info alongside key deployment metrics such as search count, ingest volume, etc. from key areas of Splunk Cloud Platform (i.e. data collection, data indexing, and data search).
The best part is each CMC user on your deployment can pick the metrics they want to view from the available metrics provided in the “Add or remove metric” pop up.

In this screenshot you can see the “Add or remove metric” modal open where you can choose the metrics you want to see in your “Top metrics” section.
Optimization resources
This section appears at the bottom of the dashboard and provides direct access to some of the most powerful Splunk Cloud Platform features and educational material to help you proactively prevent performance issues altogether.
For example, you can access the workload management feature, a rule-based framework that enables the allocation of compute resources (CPU and memory) to search, indexing, and other workloads in Splunk Cloud Platform. You can use workload management to ensure that high priority searches receive adequate resources, while lower priority searches are appropriately restricted.
This can greatly reduce potential inefficient searches run by your end users.
In addition to the above three sections you will also find helpful features on the top right corner of the dashboard including, feedback button, link to public documentation, and a “find in CMC” search bar.
What’s next?
We are kicking off the CMC modernization journey with the launch of the overview dashboard, and this is just the beginning! There is much more on the way as we continue reimagining experiences in the CMC app with intuitive workflows and richer actionable insights.
We encourage you to explore the workload (preview) dashboard which is the next area we are actively redesigning in CMC. Be a part of this journey by sharing your feedback and ideas with us. Simply click the feedback button on your overview dashboard and share your thoughts — we can't wait to hear from you!
To learn more about the overview dashboard and the Cloud Monitoring Console (CMC), check out our comprehensive CMC documentation. And don’t forget to visit the CMC community page — it’s the perfect place to ask questions, share insights, and join the conversation.