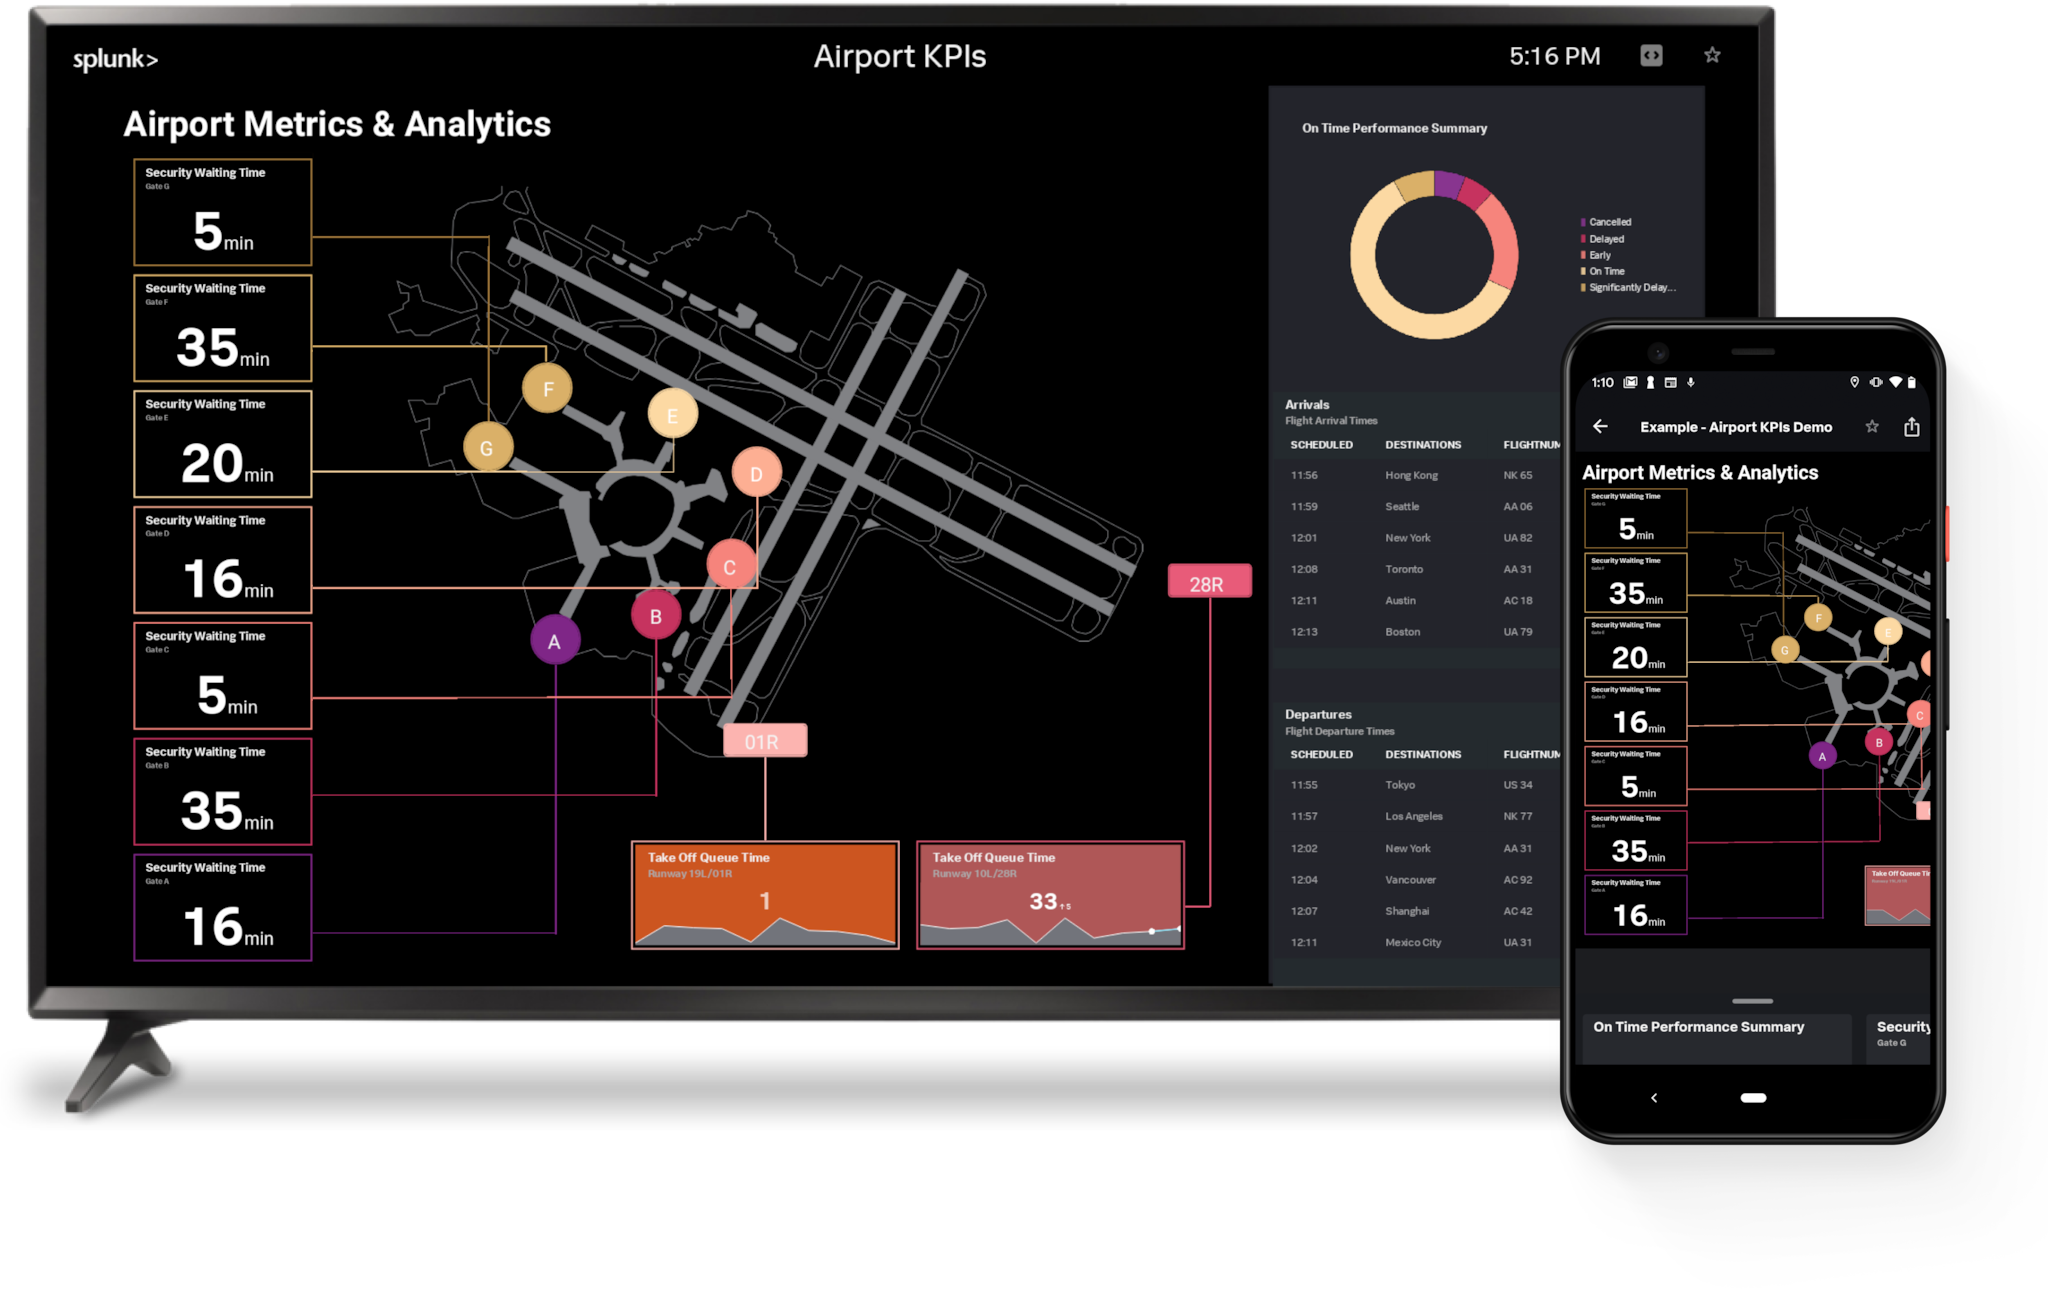
Dashboard Studio on the Go

We heard that you love telling complex data stories by building beautiful dashboards on Splunk Dashboard Studio. Now get these dashboards into the hands of even more users anywhere at any time with Dashboard Studio on Splunk Mobile and Splunk TV.
What is Dashboard Studio?
Splunk Dashboard Studio is a new dashboarding experience that allows you to build visually compelling, pixel-perfect dashboards. With brand new configurations such as grid and absolute layout, you can arrange visualizations to communicate your data in the best way possible. All your favorite visualizations come with even more options, allowing you to further customize dashboards as you please. Splunk Dashboard Studio is included in:
- Splunk Cloud Platform 8.1.2103 or higher
- Splunk Enterprise 8.2 or higher
How Can I View These Studio Dashboards on Splunk Mobile and Splunk TV?
To view Splunk Dashboards on Mobile or TV, first set up Splunk Secure Gateway. Splunk Secure Gateway is backend infrastructure that enables the secure transfer of your data to any Connected Experiences platform.
Support for viewing Studio Dashboards in the Connected Experiences apps requires one of the following minimum Splunk platform versions:
- Splunk Cloud Platform 8.2.2107 or higher
- Splunk Enterprise 8.2.2 or higher
Next, download the latest version of the Connected Experiences product that you would like to use to view Studio Dashboards on. Splunk Dashboard Studio is supported on the following apps:
- Splunk Mobile for iOS 2.25.0 or higher
- Splunk Mobile for Android 2021.10.12 or higher
- Splunk TV for Apple TV 3.6.0 or higher
- Splunk TV for Android TV 2021.10.11 or higher
- Splunk TV for Fire TV 2021.10.15 or higher
- Splunk TV Companion 1.1.0 or higher
Now, just login with your mobile device and find your new dashboards in the dashboards list. Once you open up a dashboard on Splunk Mobile or Splunk TV, you can intuitively navigate and zoom into the most important sections. From tables, to charts, to gauges, Dashboard Studio visualizations appear the same on the go as they do on the web. Splunk Mobile and Splunk TV also support other elements such as images, shapes, and markdown so you can present your data in the best context possible. A multitude of form inputs are also available so that you can focus on the most relevant data points. Follow our release notes to get the comprehensive list of Dashboard Studio components supported on Splunk Mobile and Splunk TV.

In addition to the natural panning experience on Splunk Mobile, you can use the custom built visualization tray to scroll through your visualizations. Pull up the tray and navigate to the visualization you would like to view. Tap on a visualization to interact with your data or expand the visualization into full screen mode to view more details. Finally, hide the tray to see your entire dashboard and get that bird’s-eye view of your data.

Can I See a Demo?
To get a quick demo of Dashboard Studio on Splunk Mobile for Android, download the latest version of the app right now. Then head on over to the Instance Manager and scroll down to the Demo Instances section. You’ll find a demo instance that contains example dashboards created using Splunk Dashboard Studio. Use these sample dashboards to see what’s possible and let your imagination run wild — happy dashboard building!
Stay tuned for an upcoming Splunk Mobile for iOS release for demo Studio Dashboard support.

Check out this video to get a recap of everything we covered in this blog and see Splunk Dashboard Studio on the go! To make the most of Splunk Mobile and Splunk TV, watch our .conf21 session. If there are any additional features you would like to see on Mobile or TV, let us know in Splunk Ideas. Be on the lookout for more Connected Experiences blogs dropping every week and review the past ones here.
We hope that these new capabilities inspire you to continue creating beautiful dashboards and share insightful data stories with users across your organization!
This article was co-authored by Joe Mattekatt, Product Manager for Mobile, and Jesse Chor, VP of Engineering.
----------------------------------------------------
Thanks!
Jesse Chor
Related Articles
About Splunk
The world’s leading organizations rely on Splunk, a Cisco company, to continuously strengthen digital resilience with our unified security and observability platform, powered by industry-leading AI.
Our customers trust Splunk’s award-winning security and observability solutions to secure and improve the reliability of their complex digital environments, at any scale.


