Cloud Monitoring Console’s Health Dashboard: Maximize Your Monitoring Efficiency

Are you a Splunk Cloud admin tired of sifting through various tools and dashboards to monitor the health of your Splunk Cloud deployment? Do you often find yourself wondering what actions you can take to keep your Splunk Cloud deployment running smoothly? Are you looking for ways to be alerted before something impacts your deployment performance? Look no further than the Cloud Monitoring Console's Health Dashboard! This powerful tool provides a single place to view important health indicators to keep a close tab on the pulse of your deployment. With the Health Dashboard, you can get actionable insights about your environment, enabling you to proactively stay ahead of potential performance degradation. Say goodbye to the hassle of managing multiple dashboards to isolate issues and hello to a streamlined, efficient solution with the Health Dashboard in Splunk's Cloud Monitoring Console (CMC).
What’s New?
CMC’s new Health Dashboard is generally available (GA) now starting with CMC 3.10.2. Health Dashboard is a single place for you to view critical indicators that impact the overall health of your Splunk Cloud deployments. With the Health dashboard, you get actionable insights about your deployment, allowing you to proactively get ahead of any potential issues. You can now track six health indicators (Universal forwarder software version, Heavy forwarder software version, Bucket size and range, Skipped search percentage, Cache transfer activity, and High memory searches) categorized by current state (critical, warning, conforming) and get informed about next steps you can take to maintain optimal performance using the new CMC Health dashboard.
Health Dashboard provides the following to make it easy for you to manage/monitor your deployment performance:
- Simplified monitoring: Intuitive visual interface with color coded indicators making it easy for you to identify issues.
- Actionable insights: Recommended steps to take critical/warning indicators to conforming allowing you to fix issues as you go.
- Proactive Alerting: Preconfigured alerts to inform you about potential performance issues in advance.
- Feedback loop: In app feedback button you can use to submit comments and feature requests directly from the CMC app.
How To Use the Health Dashboard
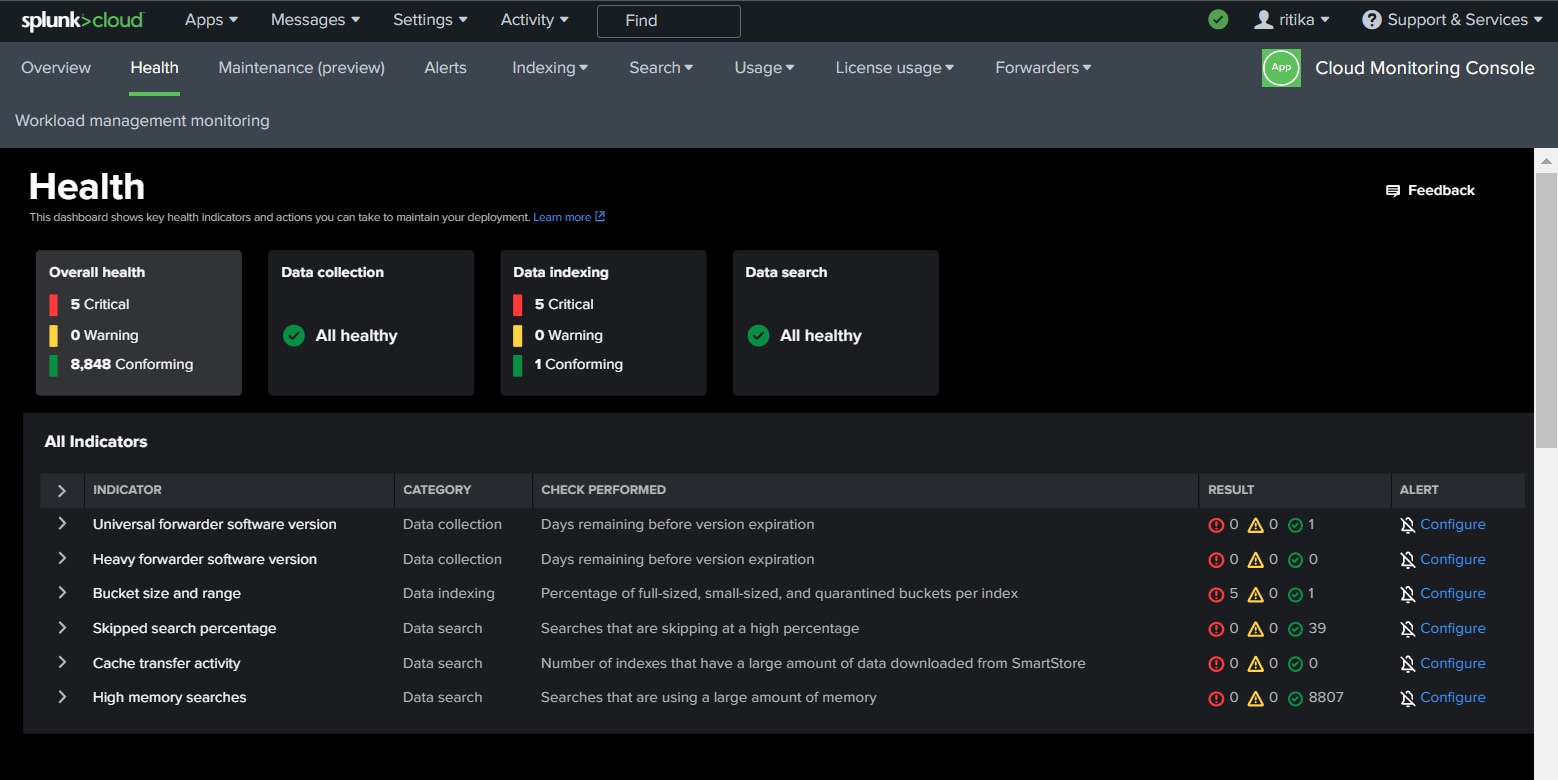
Chances are in the past if you had to evaluate the health of your Splunk Cloud deployment, you broadly investigated issues in these three broad categories; data collection, data indexing, and data search. With the Health Dashboard the first thing you see on the top is the status of these three categories. When there aren’t any issues related to any of the indicators tied to a given category, you’ll see a single green check mark with “All healthy” state representing all is well. If there is an issue, the category defaults to showing the ‘critical and warning issues’ count so you can dive deeper into what’s going on. The table along the bottom of the Health Dashboard displays various indicators, which are specific metrics that get evaluated under each category to see if they are in compliance with Splunk best practice.
 In this screenshot we see the top level categories Data collection and Data search are “All healthy” since the five indicators tied to this category are green in the table below.
At the table row level Health dashboard provides the traffic light results from the check it performed for each individual indicator as well as provide you the ability to configure alerts. Each indicator at the table row level lets you view additional information about it. Upon expanding the indicator tab it loads information about the summary of thresholds used to assign traffic light status in the result column as well as provide you the option to see more information about the specific indicator using the “view detail” button.

In this screenshot you can see one of the indicators in the expanded view revealing the “view detail” button that you can click to learn more about it
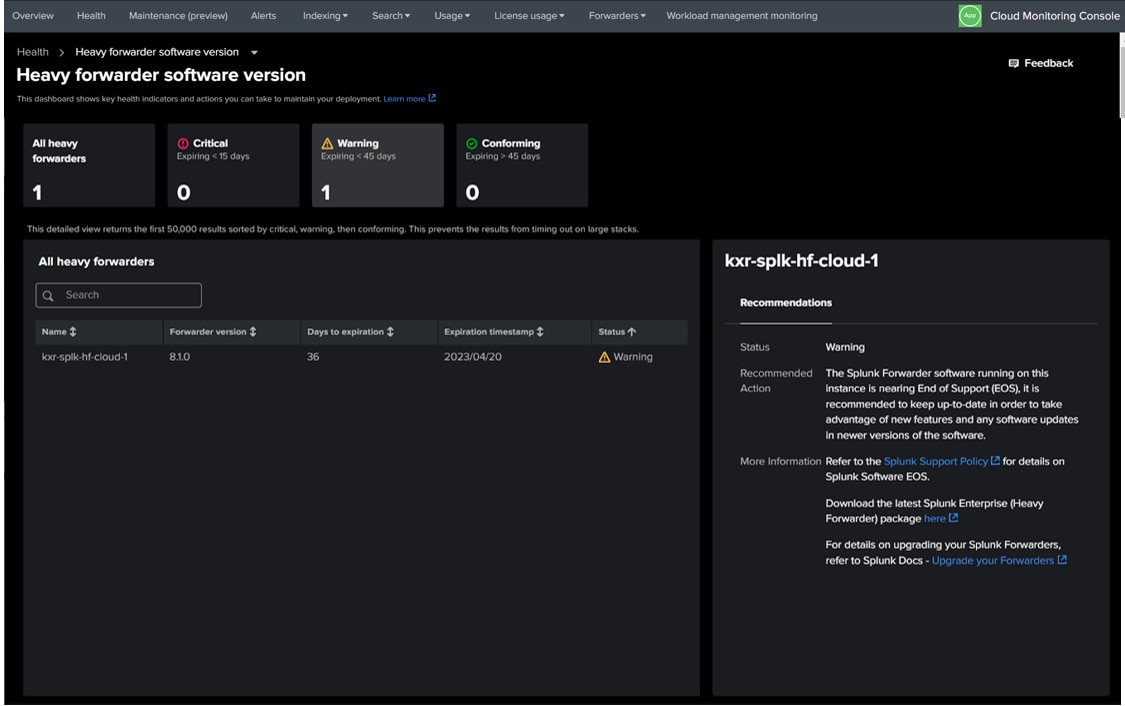
Once you click the view detail button it opens indicator specific drill down dashboard. This dashboard goes into the detail of what exactly needs your attention. Once you click on any row of the table, a handy side panel opens to show you Splunk recommended remediation steps making sure you no longer need to look for documentation and tutorials to fix issues as you go.

The drilldown page lists a warning about a Heavy forwarder software version expiry with a help panel containing recommended actions you can take to fix it.
What the Future Holds
The future's looking exciting and we are pulling out all the stops to bring you more juicy insights than ever before in all three categories. And guess what? We want YOU to be a part of this journey! So, if you have any brilliant ideas, please don't hesitate to hit us up using the feedback button in your Health Dashboard. We can't wait to hear from you!
And if you are curious to know more (because who isn't?) about the Health dashboard and the CMC, we've got you covered. Just head on over to CMC documentation here and dive right in. Also feel free to submit any questions on this topic at the CMC community page.
Related Articles
About Splunk
The world’s leading organizations rely on Splunk, a Cisco company, to continuously strengthen digital resilience with our unified security and observability platform, powered by industry-leading AI.
Our customers trust Splunk’s award-winning security and observability solutions to secure and improve the reliability of their complex digital environments, at any scale.


