Observability with Assurance: Splunk meets ThousandEyes

In an era where digital transformation is at the forefront, organizations are increasingly reliant on complex IT infrastructures that span on-premises, cloud, and hybrid environments. Ensuring seamless performance and maintaining digital resiliency — an organization's ability to withstand and quickly recover from disruptions — are crucial components of modern IT strategy.
A frequent and often challenging question that arises in IT operations is whether a performance issue lies within the network or the application. This inquiry highlights the necessity for unified observability solutions that provide a comprehensive, end-to-end view of the entire IT stack. By integrating network and application observability, organizations can not only address immediate performance issues but also enhance their overall digital resilience, ensuring robust and uninterrupted digital services for their users.
Are you ready to elevate your observability strategy and drive digital resilience with Assurance? Let’s dive deeper into how Cisco ThousandEyes and Splunk Observability Cloud can transform your IT operations.
Understanding Cisco ThousandEyes
Cisco ThousandEyes is a cutting-edge network intelligence platform providing assurance across the digital experience by verifying and guaranteeing that network connections remain reliable, secure, and perform at the expected levels. The platform is equipped with three distinct types of agents, each tailored for specific monitoring needs:
- Enterprise Agents: Installed within an organization's network, these agents provide deep visibility into internal network performance and user experience.
- Cloud Agents: Deployed across various geographic locations, these agents offer insights into the performance of internet-based services and cloud applications.
- Endpoint Agents: Installed on user devices, these agents help monitor the end-user experience, providing valuable data on application performance from the user's perspective.
Additionally, ThousandEyes excels in providing detailed insights into network paths, performance, and potential bottlenecks not only in local networks but also Internet and Cloud provider networks. Its seamless integration with Cisco's networking equipment and solutions enhances the ability to deliver a comprehensive view of network performance alongside application performance. Moreover, ThousandEyes supports transaction tests, which are scripted synthetic user interactions with web-based applications. These tests can traverse multiple pages and user actions, providing valuable insights into complex user journeys and ensuring that all aspects of web applications function as expected.
Want to learn more about ThousandEyes? Please visit the Cisco ThousandEyes website.
Why integrate Cisco ThousandEyes with Splunk Observability Cloud via OpenTelemetry?
Splunk Synthetics Monitoring is a best-in-class solution that excels at proactively monitoring web applications and APIs by simulating user interactions to detect and resolve performance issues. When there's a need for detailed insights into network paths, performance, and potential bottlenecks across not only local networks but also Internet and Cloud provider networks, ThousandEyes can provide additional value. Integrating ThousandEyes with Splunk Observability Cloud via OpenTelemetry offers significant advantages for organizations seeking comprehensive insight into their IT environments. This integration allows for seamless data collection and correlation across both network and application performance domains, leveraging OpenTelemetry's standardized framework for telemetry data. By combining ThousandEyes' detailed network intelligence with Splunk's powerful analytics capabilities, organizations can achieve much needed visibility into an an observability solution that enhances their ability to diagnose and resolve issues quickly. This holistic view not only improves troubleshooting efficiency by pinpointing whether issues originate from network or application layers but also empowers teams to proactively monitor and optimize performance, ultimately driving improved digital resilience and user satisfaction. There are multiple use cases for how organizations can leverage this integration, but for the purpose of this blog post, let's consider just one, yet a typical scenario.
Buttercup Manufacturing optimizes Application Performance with Splunk Observability Cloud and Cisco ThousandEyes
Buttercup Manufacturing operates a cloud-native, microservices-based application deployed on a Kubernetes cluster in a public cloud. This application is accessed by employees from multiple sites across the United States. To ensure optimal performance and user satisfaction, the application is instrumented with OpenTelemetry, enabling it to be observed via Splunk Observability Cloud.
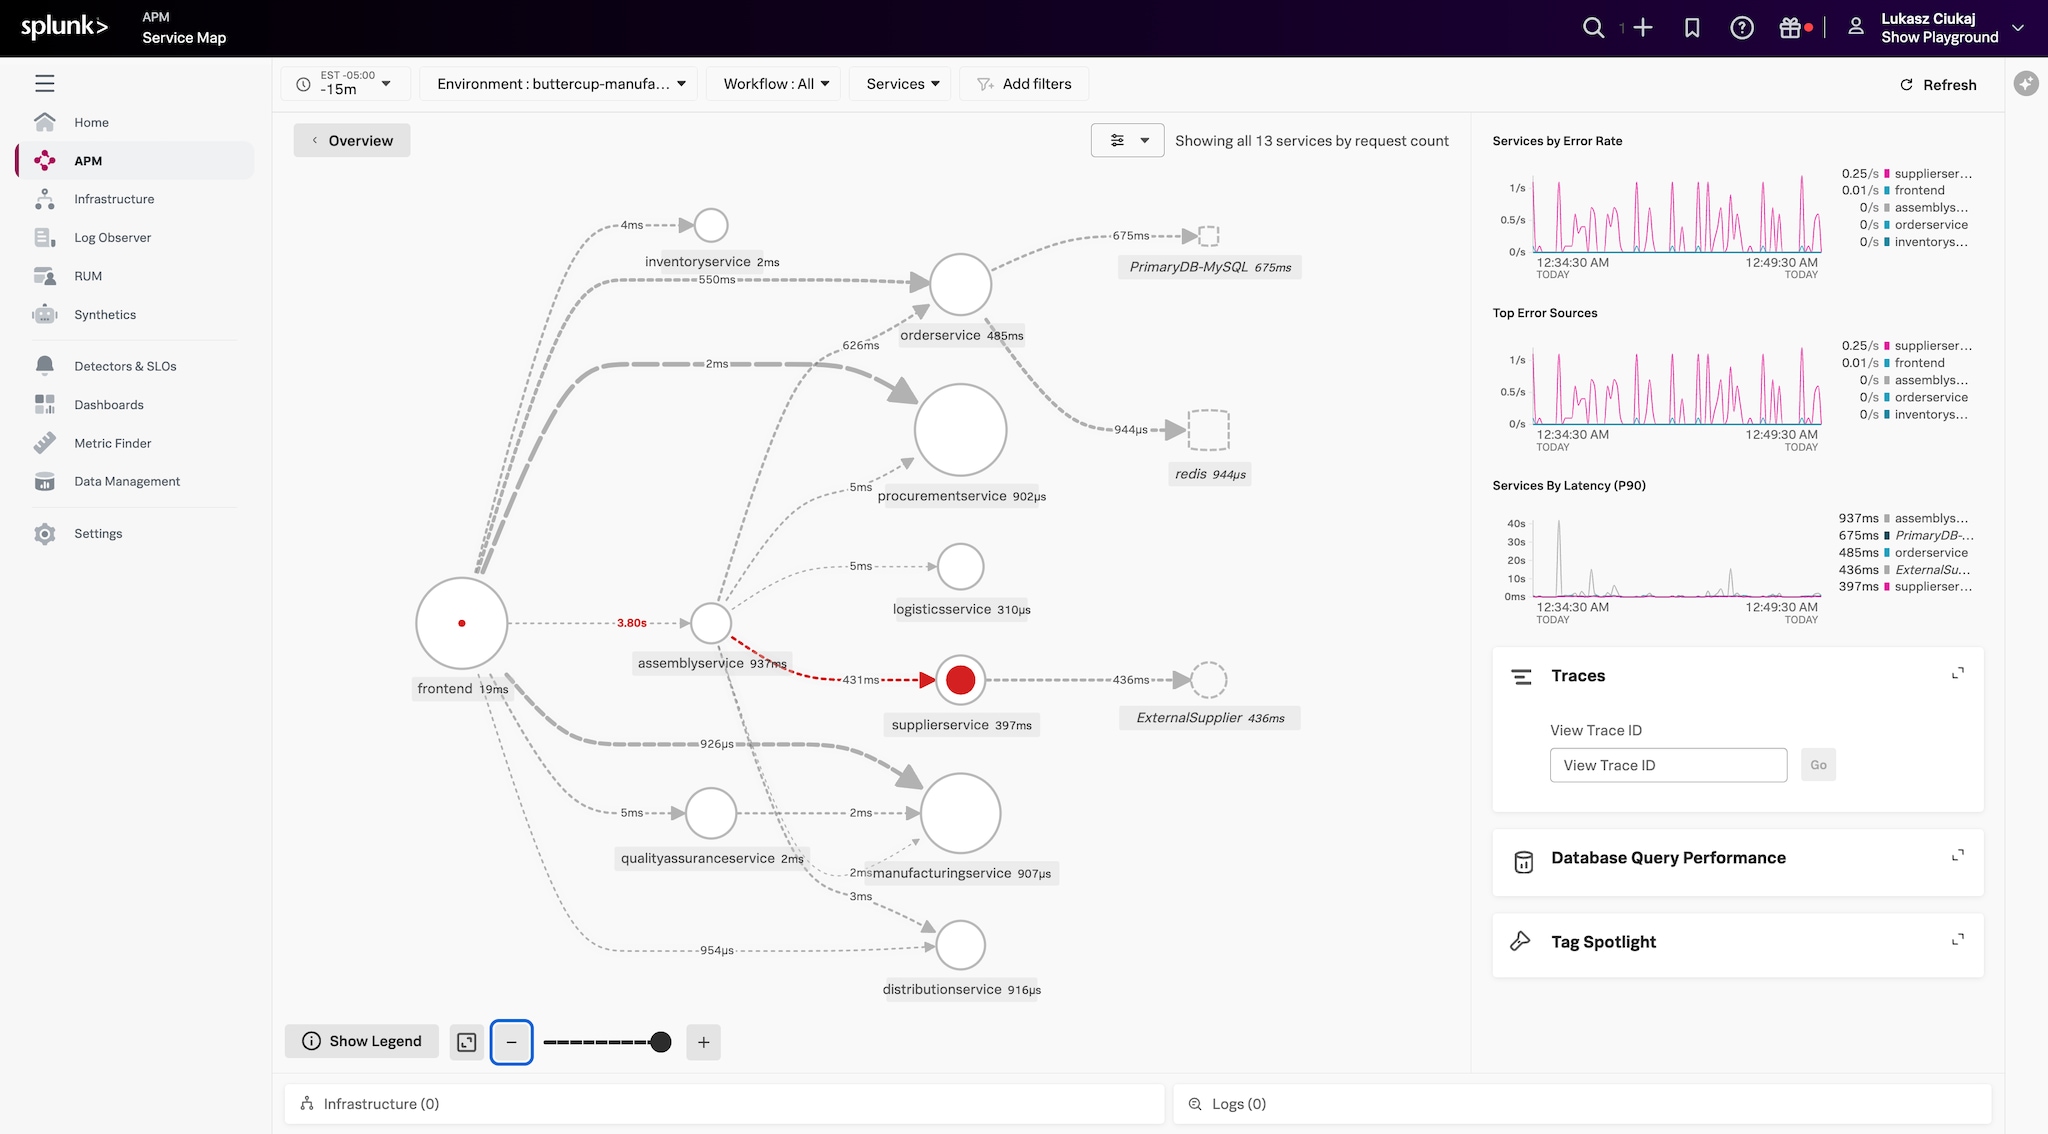
The IT team at Buttercup Manufacturing is keen to monitor both the application's performance and its accessibility from various locations, with an emphasis on measuring local networks as well as external networks like the Internet and Cloud providers. To achieve this, ThousandEyes Enterprise Agents are deployed at each site. These agents are configured to run Page Load tests, which measure how quickly the application loads and assess crucial network parameters, such as latency, packet loss, and jitter.
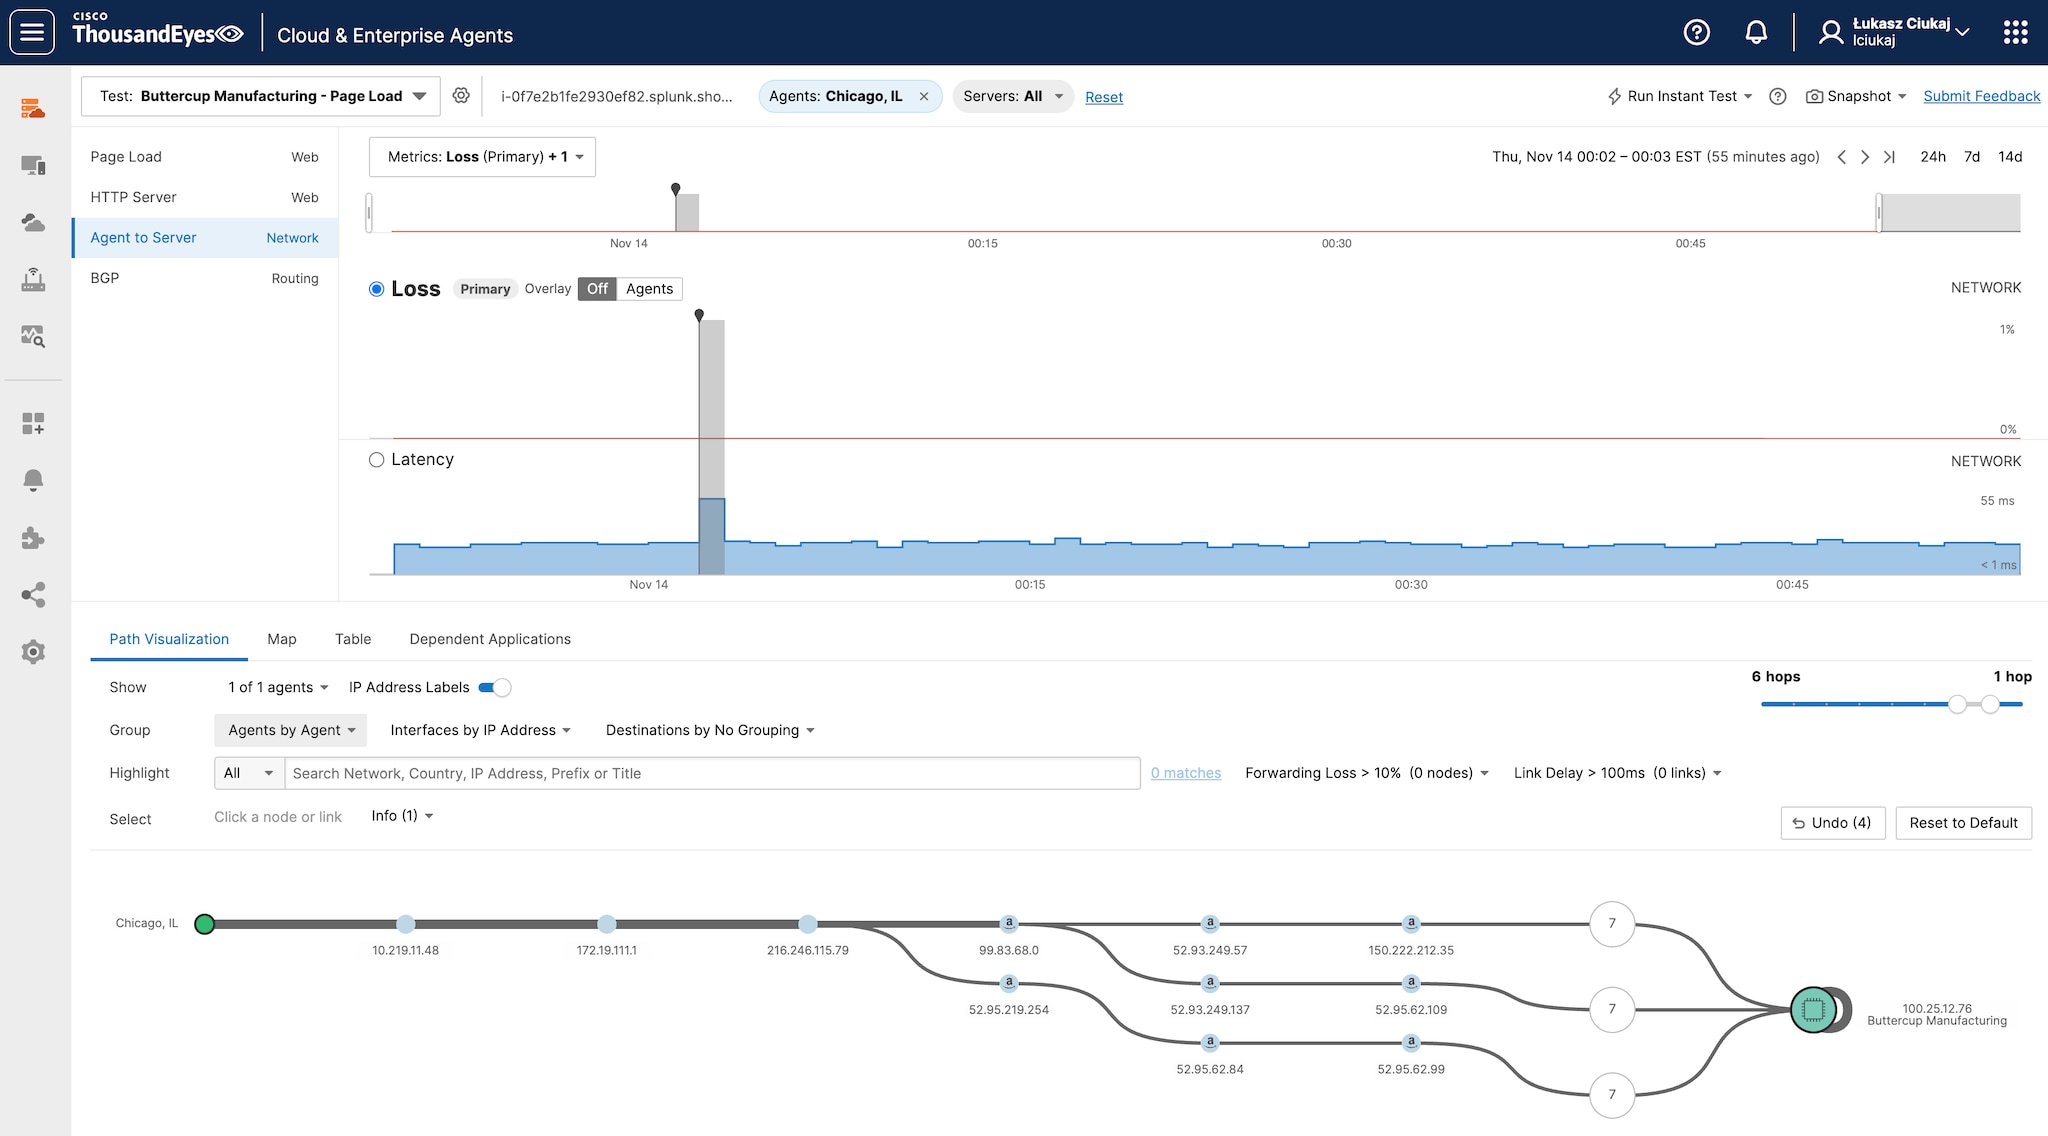
Note: ThousandEyes tests are designed so that when a top-level test is executed (e.g., Page Load), all underlying tests, such as Agent-to-Server, are also performed.
To integrate Splunk Observability Cloud with ThousandEyes, the first step is to create an ingest token in Splunk Observability Cloud. For detailed instructions, please refer to the Splunk documentation. Once the ingest token is configured, the remaining configuration steps are completed within ThousandEyes platform (Integrations > ThousandEyes for OpenTelemetry).
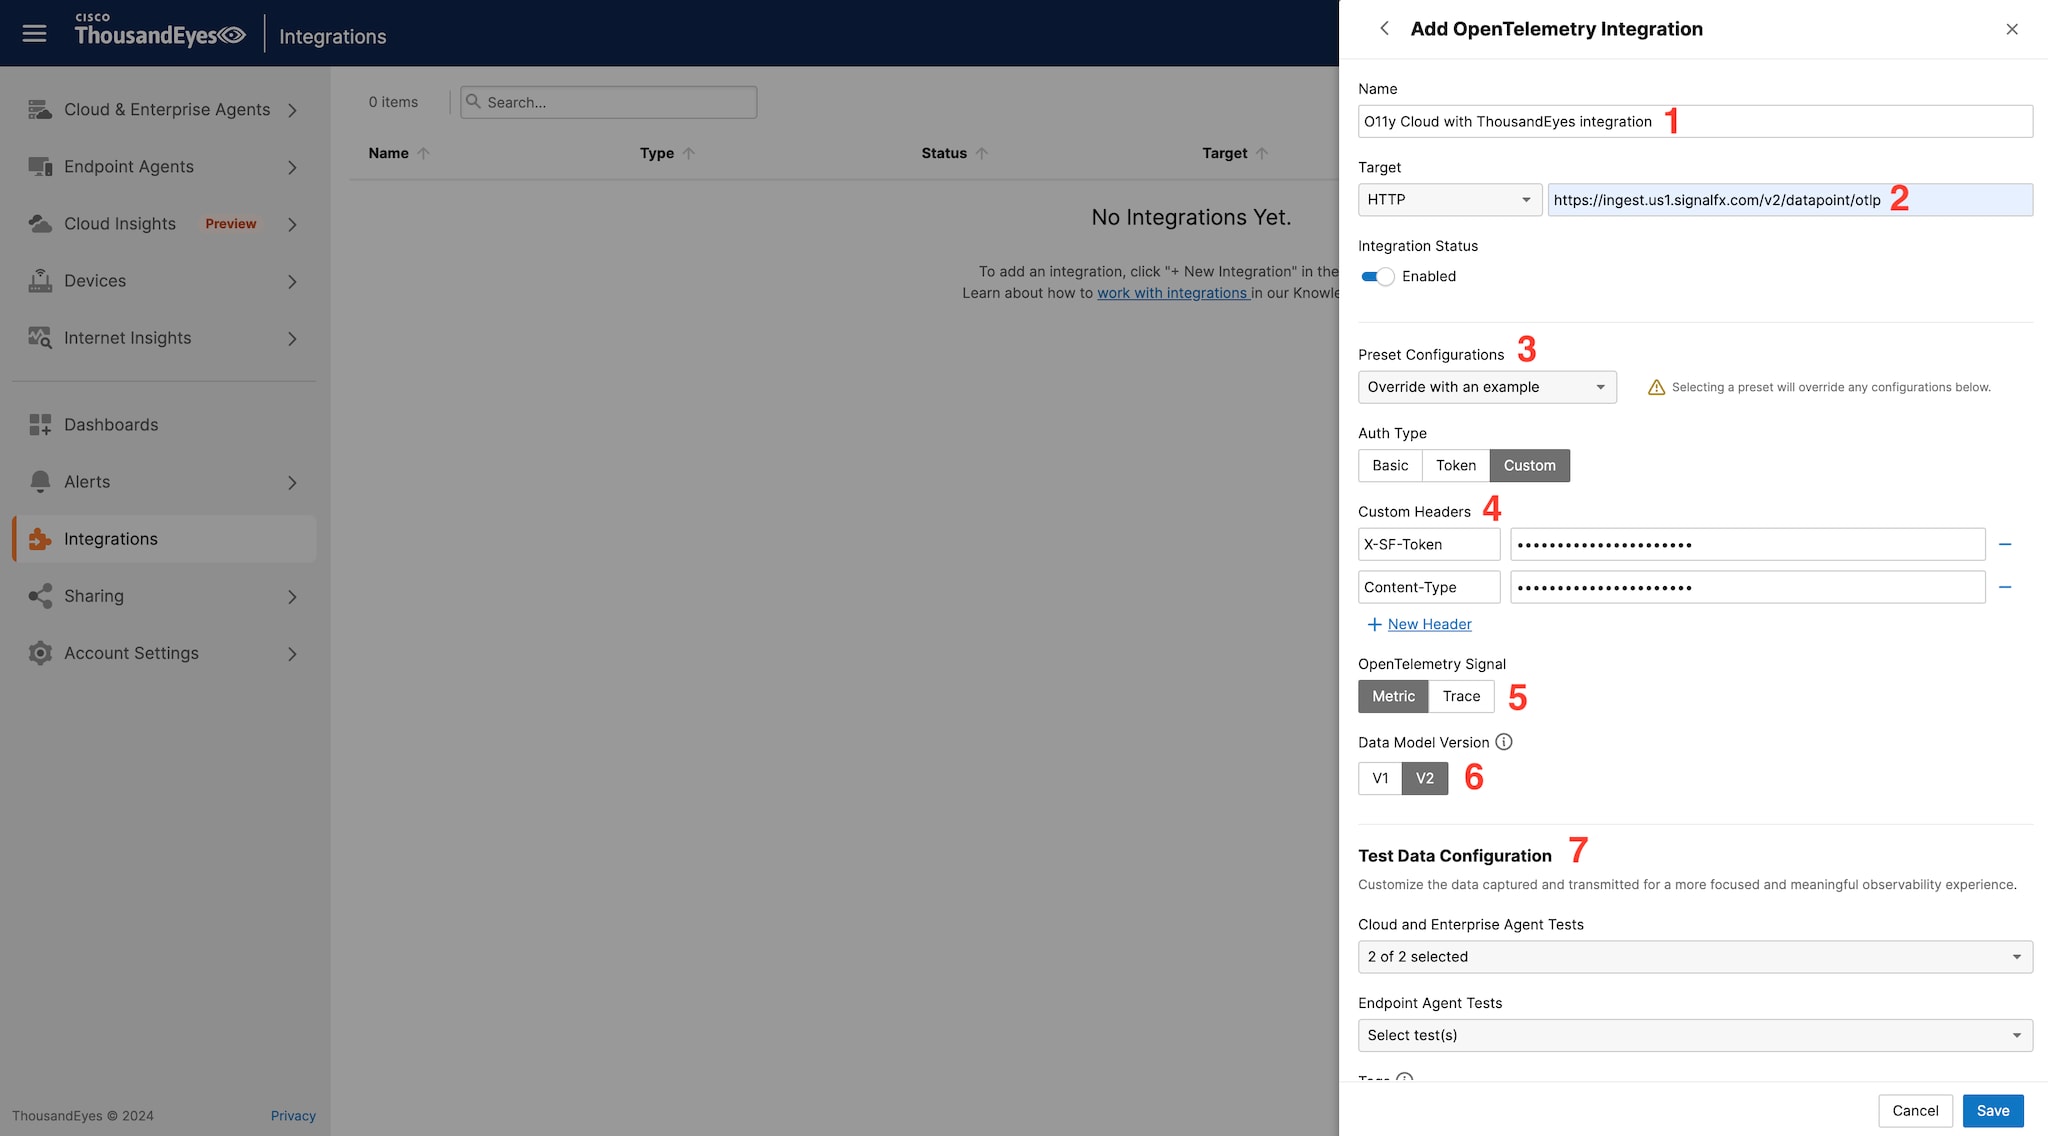
The following steps are required for the integration:
1. Unique Integration Name: Assign a unique name to your OpenTelemetry integration.
2. Target Configuration: Choose HTTP as the target and use the dedicated URL for your REALM:
- For Metrics: https://ingest.{REALM}.signalfx.com/v2/datapoint/otlp
- For Traces: https://ingest.{REALM}.signalfx.com/v2/trace/otlp
Please refer to the Splunk documentation for more details.
Note: The support for traces has been recently added to ThousandEyes OpenTelemetry. It is currently only supported for Page Load and Transaction tests.
3. Preset Configurations
- Here you can choose Splunk Observability Cloud from the list, so correct formatting and options will be automatically populated.
4. Custom Headers:
- Content-Type: application/x-protobuf
- X-SF-Token: <ingest-token-from-splunk-observability-cloud>
5. OpenTelemetry Signal:
- ThousandEyes for OpenTelemetry supports the following signals:
- Metrics: Supported for all test types.
- Traces: Supported for web transaction and page load test types.
6. Data Model Version:
- ThousandEyes for OpenTelemetry supports the following data model versions:
- Data Model Version 1
- Data Model Version 2 (Default)
Recommended Usage: Version 2 is the default and recommended version for exporting telemetry data to all observability backends, except Grafana/Prometheus for metrics. OpenTelemetry trace signals are supported only in version 2.
7. Test Data Configuration: Select the tests for which you want to send data to Splunk Observability Cloud.
Please refer to the ThousandEyes documentation for more details.
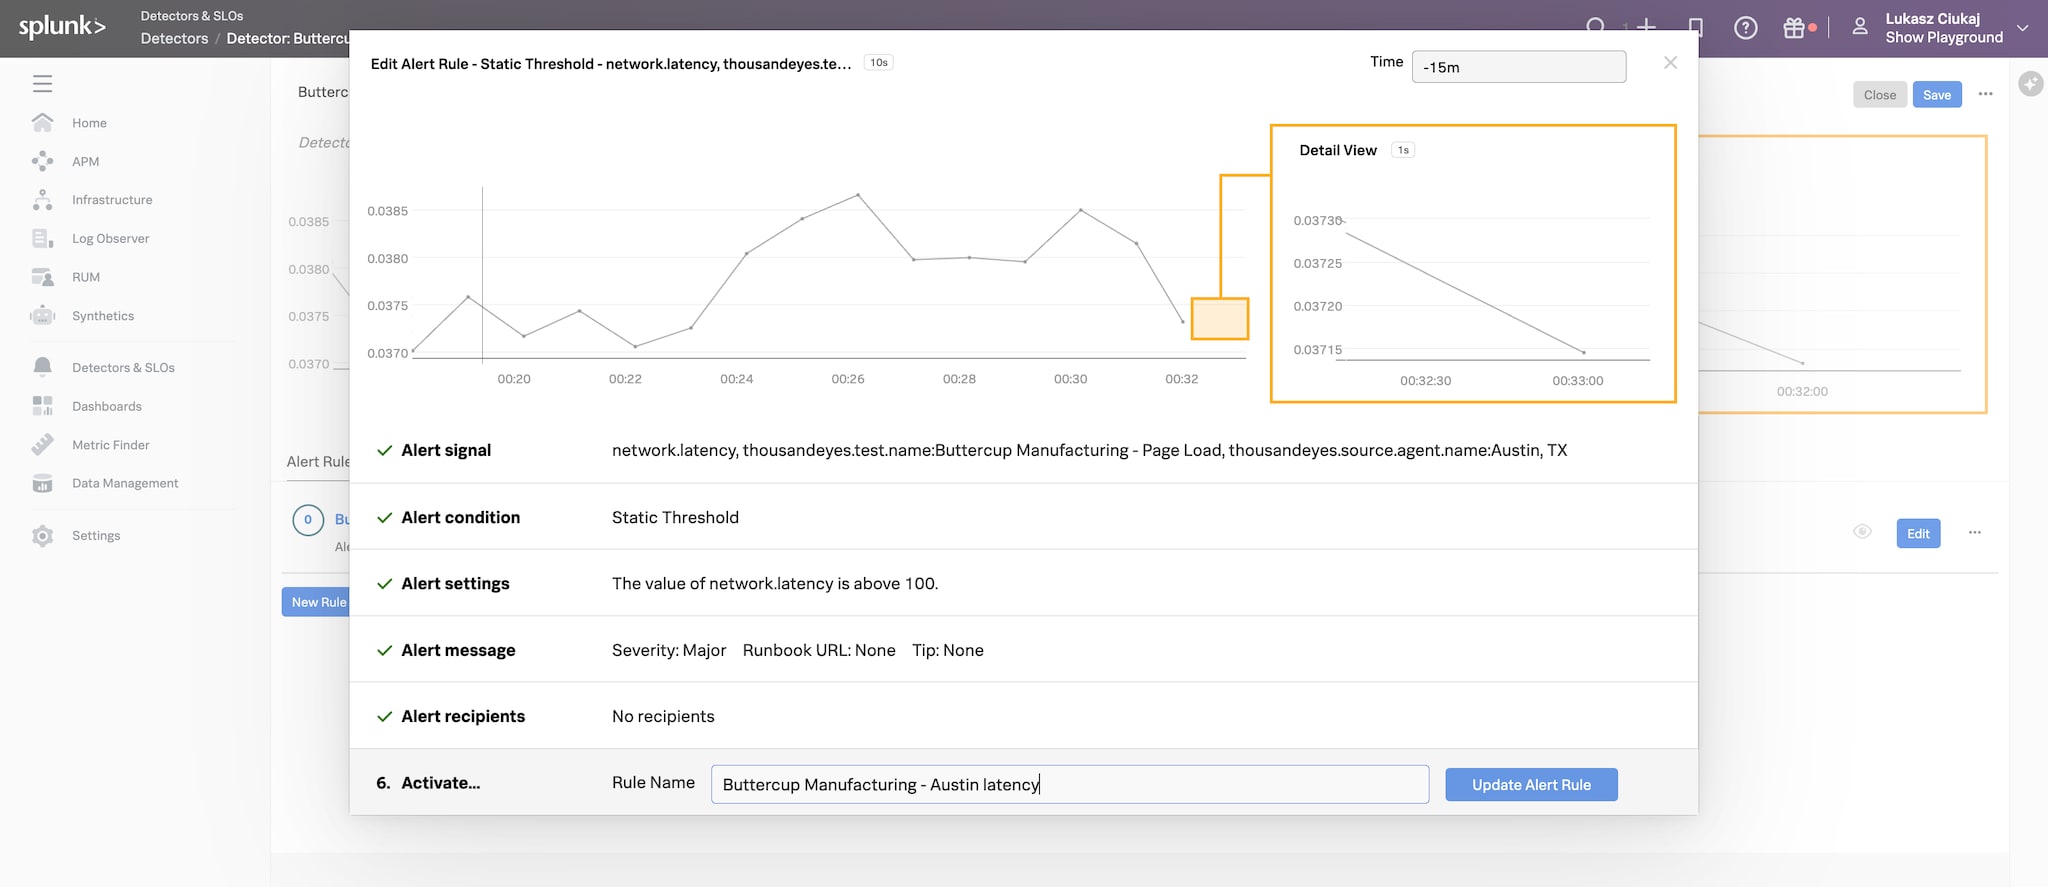
In this example, we utilize metrics as the OpenTelemetry signal. Within a few minutes, metrics from ThousandEyes should appear in Splunk Observability Cloud, specifically within the Metrics Finder, which serves as a starting point for visualizing and analyzing the data. With this data now accessible, Buttercup Manufacturing's IT department can set up detectors to automatically monitor these metrics for anomalies or thresholds, alerting the team to potential issues before they impact operations. Below is an example of a detector that triggers when network latency for one of the locations exceeds 100ms.
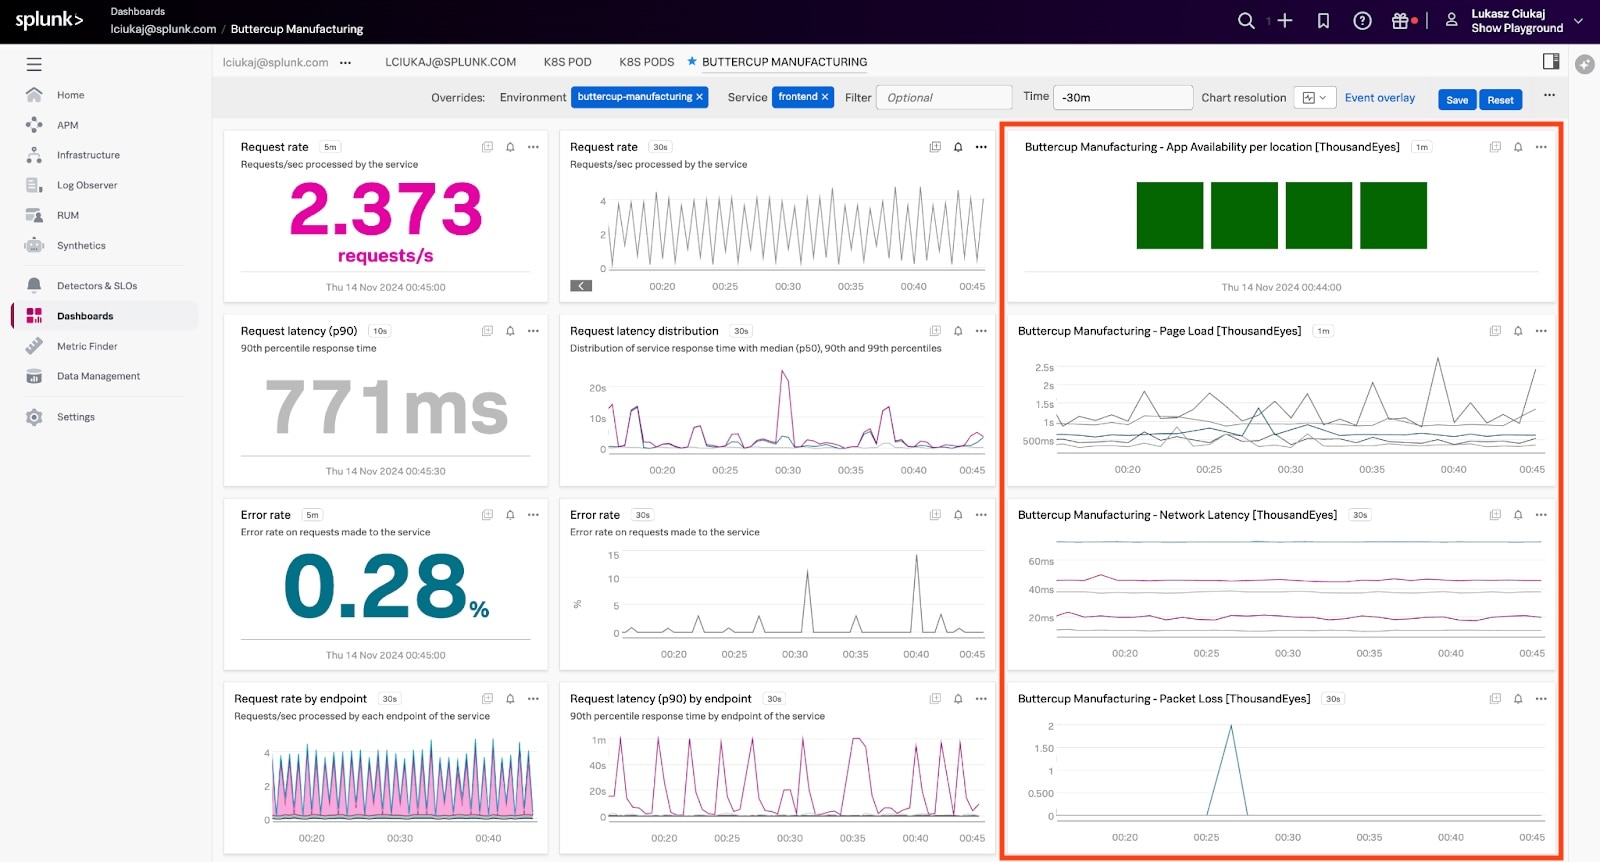
Additionally, Buttercup Manufacturing's IT department can create comprehensive and powerful dashboards that integrate both application and network metrics. These dashboards provide a unified view of the entire system, enabling IT teams to quickly compare performance metrics and isolate issues. This holistic approach facilitates faster identification of the root cause of problems, significantly reducing both the Mean Time to Detect (MTTD) and the Mean Time to Resolve (MTTR).
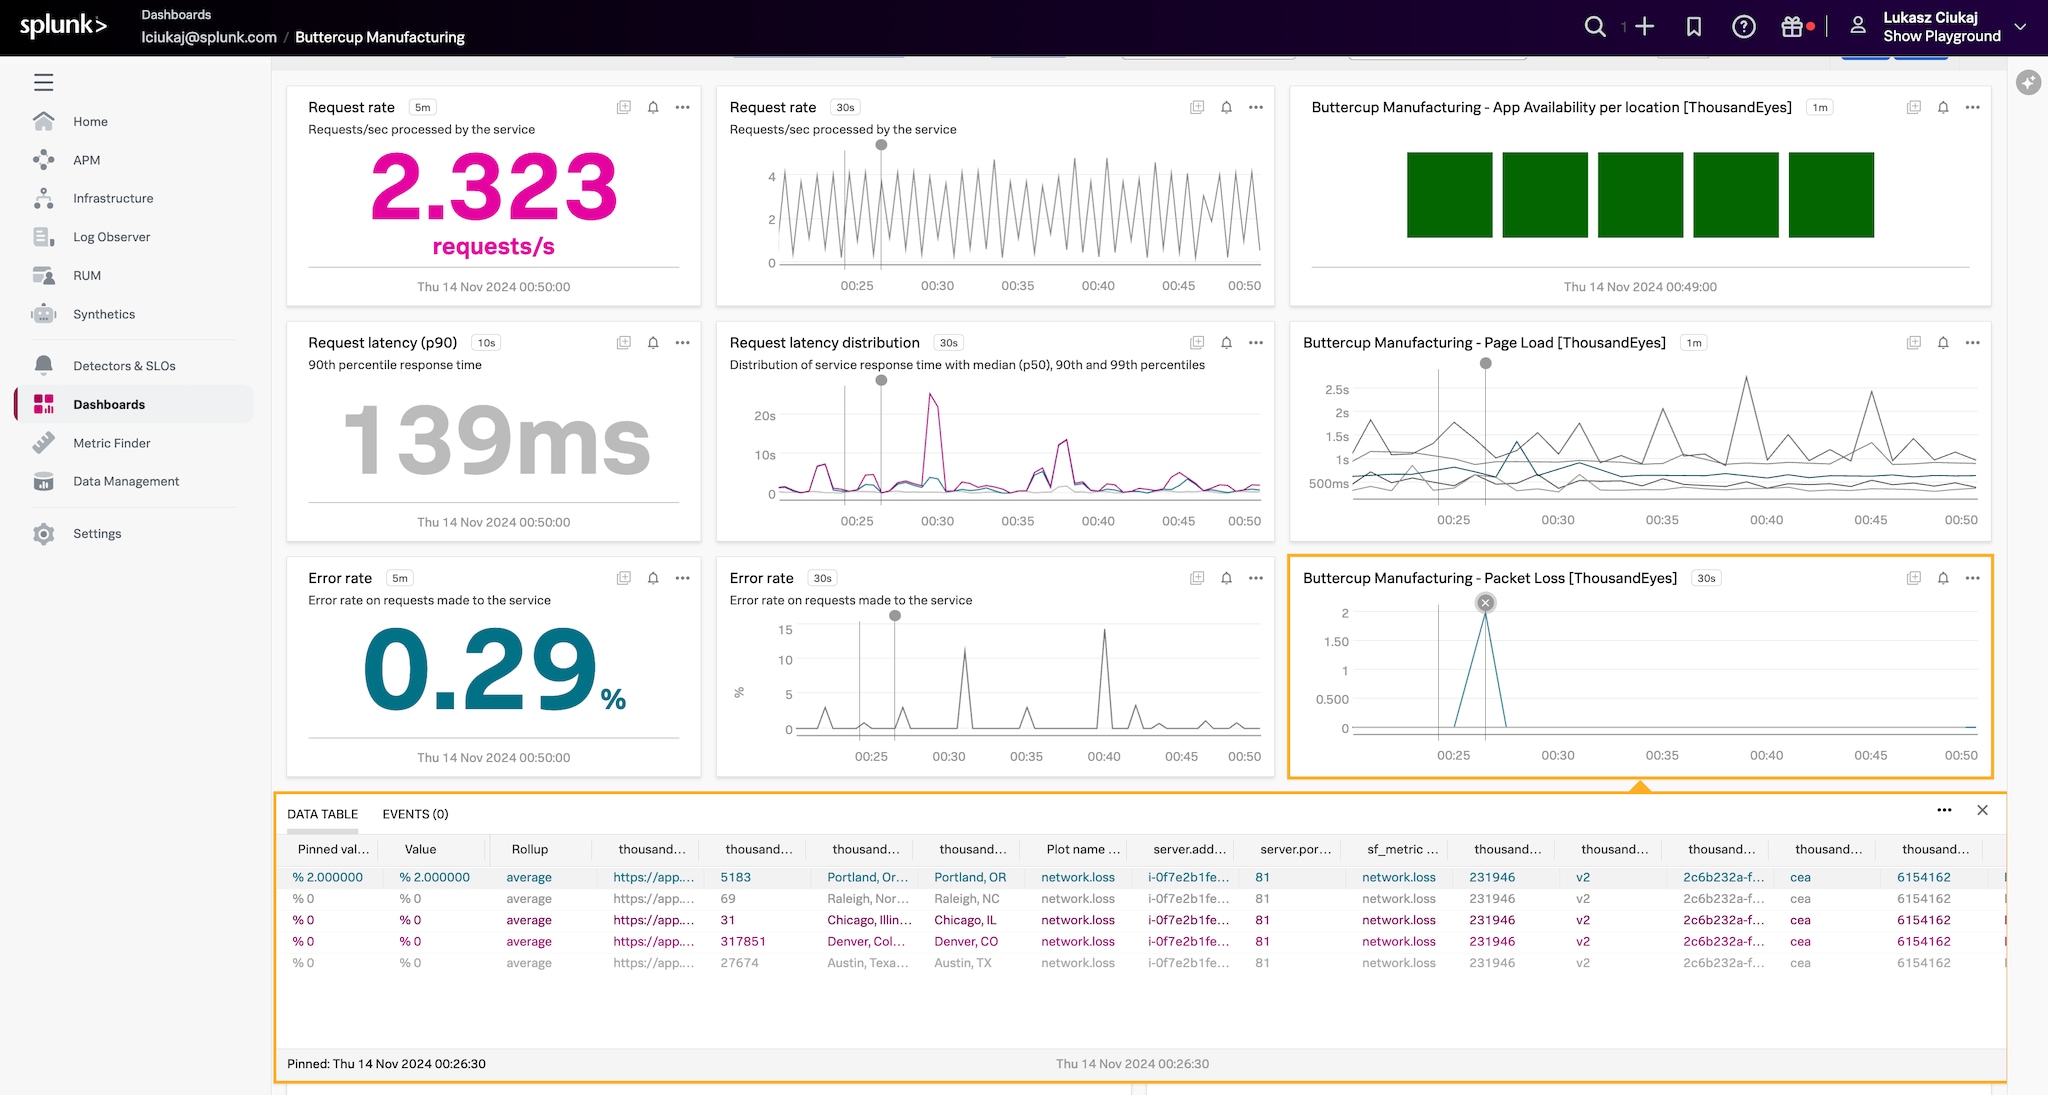
Since charts in Splunk Observability Cloud are completely interactive, we can conduct essential analysis directly within the platform without having to switch over to ThousandEyes.
Conclusion
In summary, integrating ThousandEyes with Splunk Observability Cloud via OpenTelemetry provides a powerful solution for enhancing IT operations and digital experience. This integration offers comprehensive visibility across network and application layers, facilitating streamlined troubleshooting and performance optimization. By enabling faster identification of whether an issue resides within the application or network, it helps teams quickly pinpoint the root cause, which significantly reduces both the Mean Time to Detect (MTTD) and the Mean Time to Resolve (MTTR). As demonstrated by Buttercup Manufacturing, organizations adopting this approach can enhance digital resilience and maintain efficient, reliable IT infrastructure.
To get started, if you already use ThousandEyes and Splunk Observability Cloud, it's easy to integrate them for optimal performance with no need for extra licenses. If not, consider leveraging a trial of Splunk Observability Cloud or ThousandEyes to explore their capabilities and benefits.
Related Articles
About Splunk
The world’s leading organizations rely on Splunk, a Cisco company, to continuously strengthen digital resilience with our unified security and observability platform, powered by industry-leading AI.
Our customers trust Splunk’s award-winning security and observability solutions to secure and improve the reliability of their complex digital environments, at any scale.
