Observability Costs: Tips for More Efficient Data Management

Can you ever get too much data?
With modern architectures getting increasingly more complex with hundreds of microservices and containers, data volume grows at an exponential rate, and there’s no pause in sight. In this era of ever-expanding volume of telemetry, it’s nearly impossible to separate valuable data from noise, making things like root cause analysis or alerting needlessly more complicated, while putting pressure on the performance of your stack, your scalability and budget.
The question is rather: how do I still have my data to perform my job duties, without being drowned in large volumes of information or dealing with skyrocketing costs?
Enter Splunk with a comprehensive set of flexible and scalable data management capabilities to help you understand what data is actually valuable and utilised, manage your telemetry volume more effectively, keep control of your costs, and optimize your performance. Read on for more details!
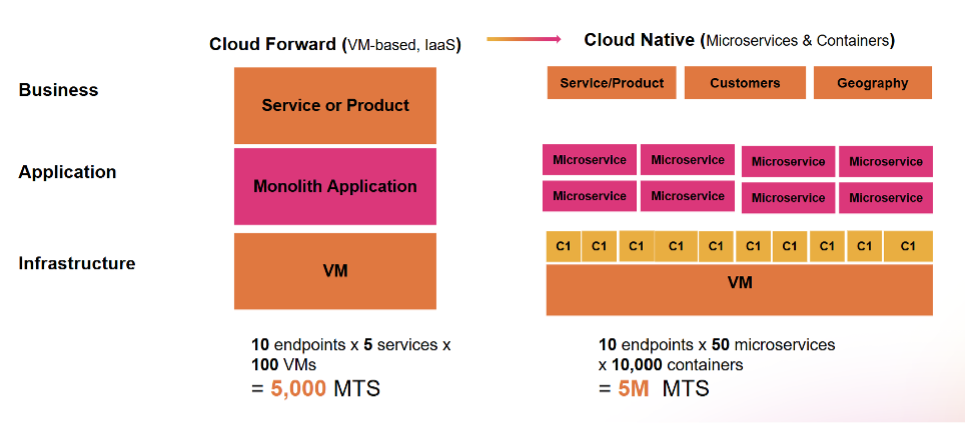
Modern architectures imply larger volumes of data
Build the Right Foundation for Your Observability Practice
What better way to set up your observability than with an industry leading open standard solution like OpenTelemetry?
An OpenTelemetry-native observability solution like Splunk means you fully control how your data is instrumented and processed, regardless of their source and type. With a collection of SDKs, APIs and tools, OpenTelemetry helps you avoid vendor lock-in and gives you the flexibility and scalability you need to effectively manage your data by ingesting your data once. Its metric semantic naming conventions across languages helps you easily identify relationships and context between data at the point of collection, so you can optimize instrumentation and avoid ingesting and storing unhelpful data right from the beginning.
OpenTelemetry’s unified platform also allows full stack correlation and eliminates double publishing, resulting in more streamlined data collection, less silos, and optimized monitoring costs.
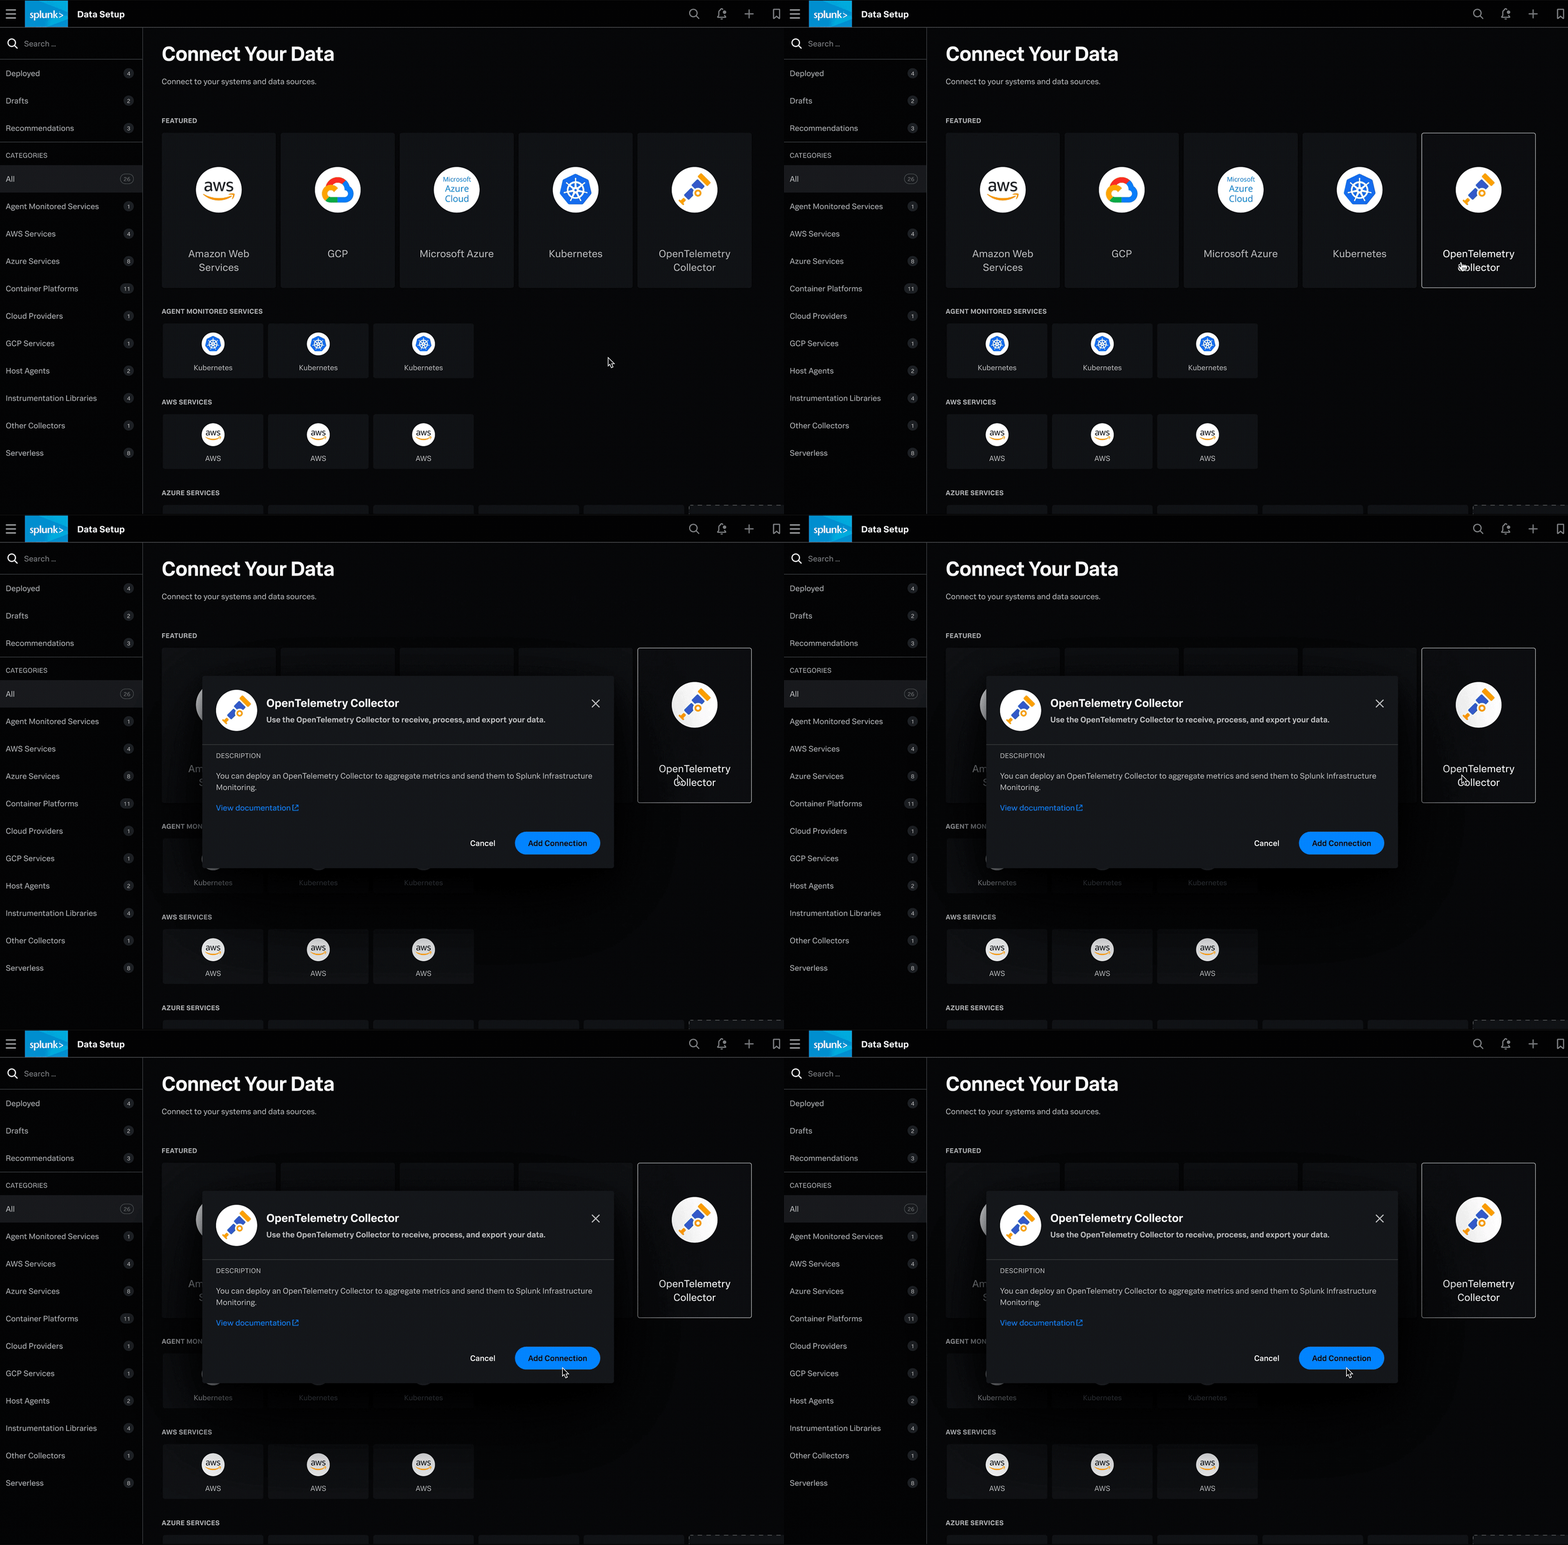
Find the Right Balance Between Volume, Performance and Cost
You probably heard this saying before: not all data is equal — some are more equal than others. With the explosion of emitted telemetry however, it’s nearly impossible to identify which one is which, causing more data silos that hinders earlier detection of outages and fast investigations. The solution to this issue lies in your analytics of data footprint to separate noise from utility, backed up with a robust pipeline management solution: an efficient telemetry pipeline management will allow you to route, drop and store your data the way you want for more cost-effective data management without sacrificing performance.
Splunk can help you do that and more.
Metrics Management
Our Metrics Pipeline Management capability gives you the flexibility and choice to control metrics data at the point of ingestion and collection. With an out-of-the-box interface and comprehensive APIs, you can aggregate metrics at query time and drop any unused data using dynamically defined policy rules to reduce volume and costs. Once you’ve processed your data, you need to decide whether you’d like to store the remaining data in real-time or archive them.
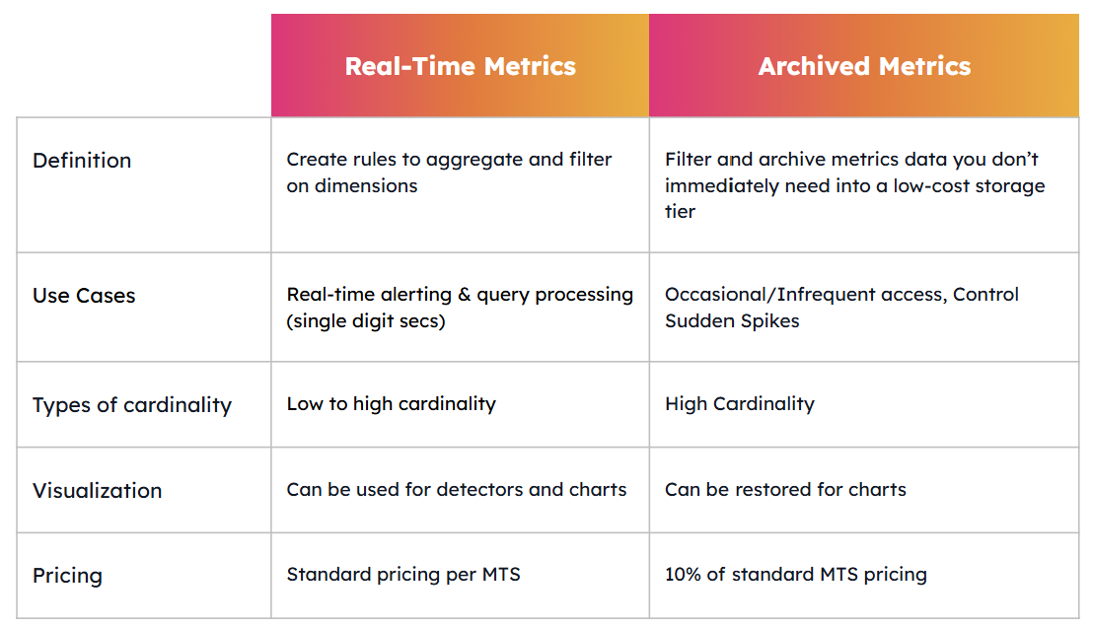
Keeping data in real-time data is a perfect choice for low cardinality metrics or for any real-time visualization or alerting needs. Because you’ve already taken advantage of the aggregation and dropping features, you get access to the data you need without cutting on your performance.
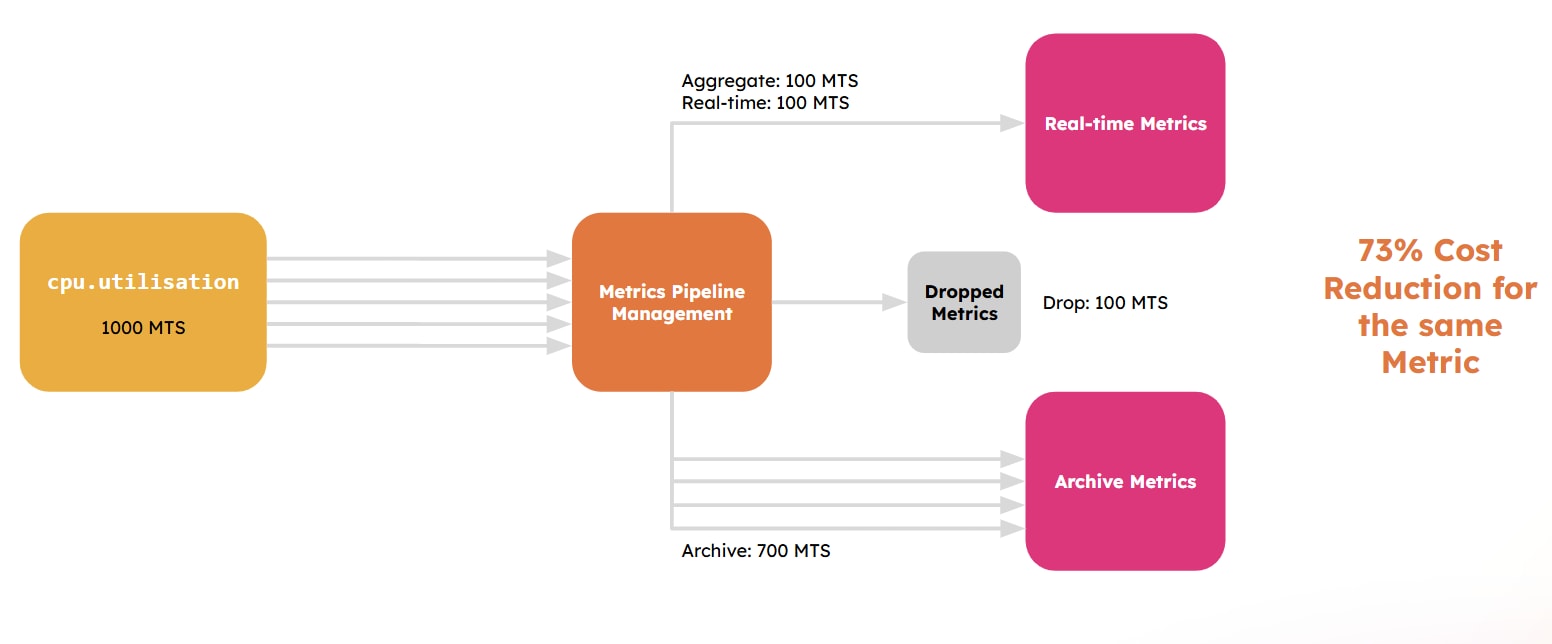
However, if you deal with voluminous and high cardinality metrics that are not deemed high-priority, then archiving your metrics might be your best bet.
With Archived Metrics, you get to keep your data in a cold storage for 10% of the real-time storage cost and restore them for your real-time needs at any time. That way you can hold on data that might be necessary but too voluminous to keep in real-time storage without having to pay the extra cost! Archiving your metrics is a real game-changer: some of our customers who use Splunk’s metric management engine have already witnessed up to 20% of cost reduction in their observability expenses.
In summary:
Histogram Metrics
Splunk now also natively supports histogram metrics, which allows you to summarize data by combining multiple statistics into a single datapoint (i.e. sum, min, max, and count) instead of dealing with individual metric points. Using Histogram metrics allows you to understand trends and visualize data without them being in full fidelity, allowing you to optimize your volume and costs.
Integrations with Platform
We don’t stop here: at Splunk, we know how important it is to reduce data waste, beyond your metrics. As a result, we have built Splunk Log Observer Connect: a cross-product feature that allows Splunk platform users to re-use their logs in Splunk Observability Cloud, so you don’t have to ingest or pay twice for your logging. And because Splunk Observability Cloud is powered by the Splunk platform, you can also take advantage of Splunk’s Ingest Processor, a Splunk Cloud Platform capability that allows you to process data using SPL2 at the time of data ingestion and turn your voluminous logs into lightweight and cost-efficient metrics.
Introducing Ingest Processor: An Evolution in Splunk Data Management
Splunk APM
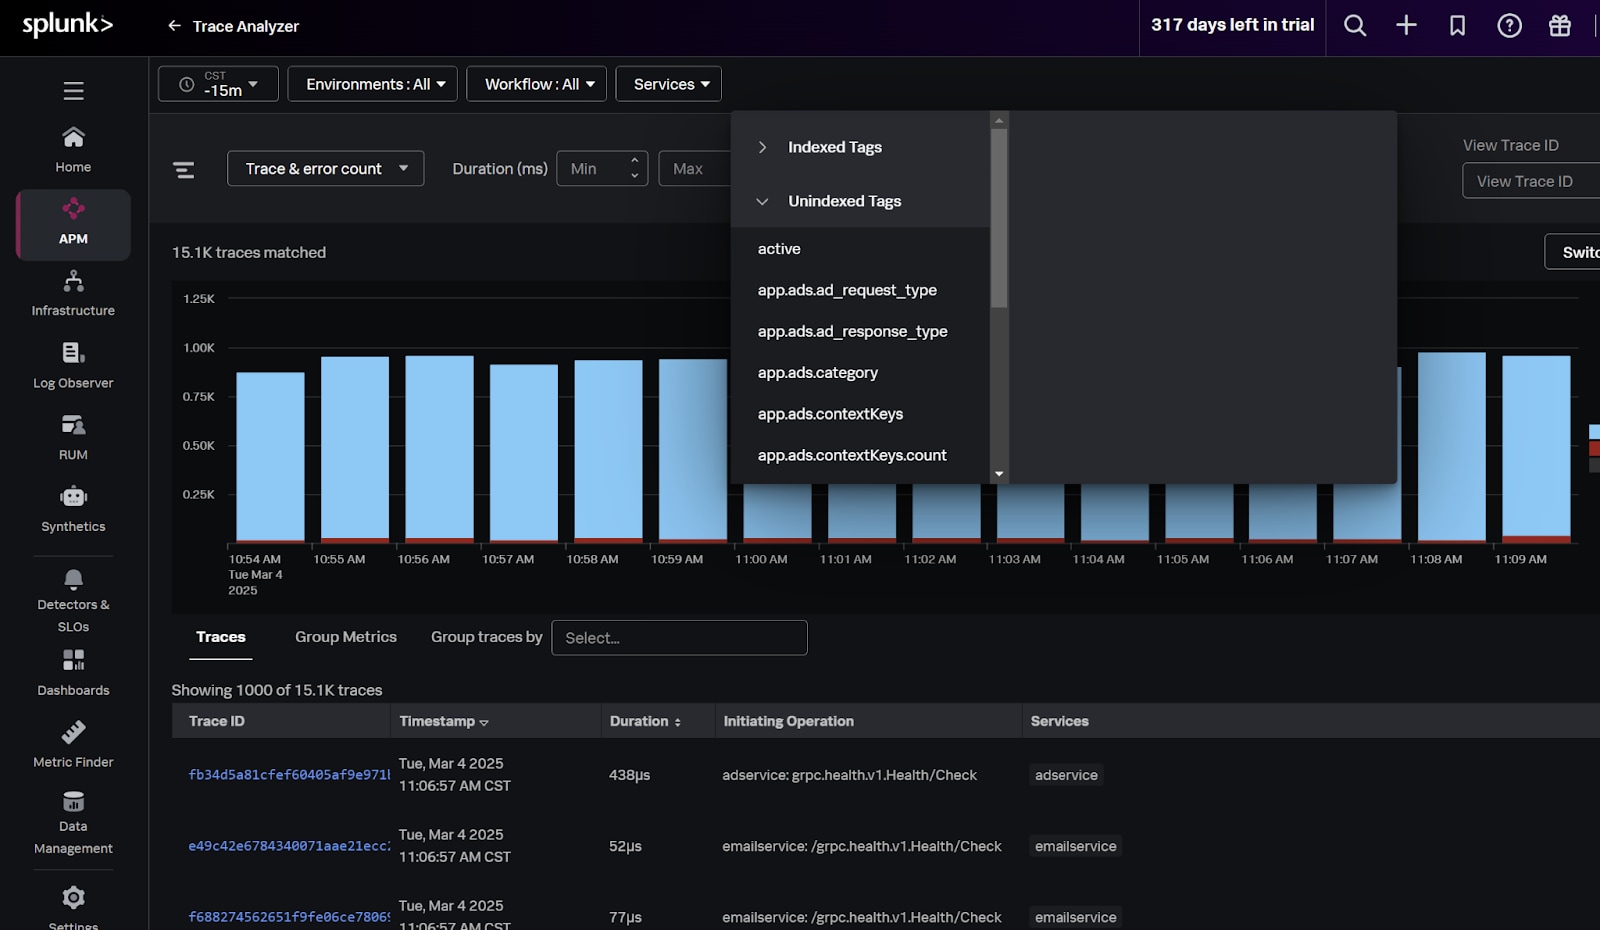
Similar to metrics, Splunk APM gives you the ability to decide which tags should be indexed for fast analysis, and which tags should be accessed when specific needs arise, helping you maintain control over your trace data consumption.
Additionally, traces from Splunk APM are a great and more efficient way to get the full picture of your application service performance. Instead of using logs which often leads to more work and can result in high data volume and noise, tracing data gives you a direct and more granular understanding of the performance of your services. By switching from logs to traces for business service analysis, you’re able to save on both your licenses, time and resources.
Keep a Close Eye on Data Consumption
After data collection and processing comes the time for monitoring your usage so you can keep it in check ahead of potential spikes.
Metrics Usage Analytics
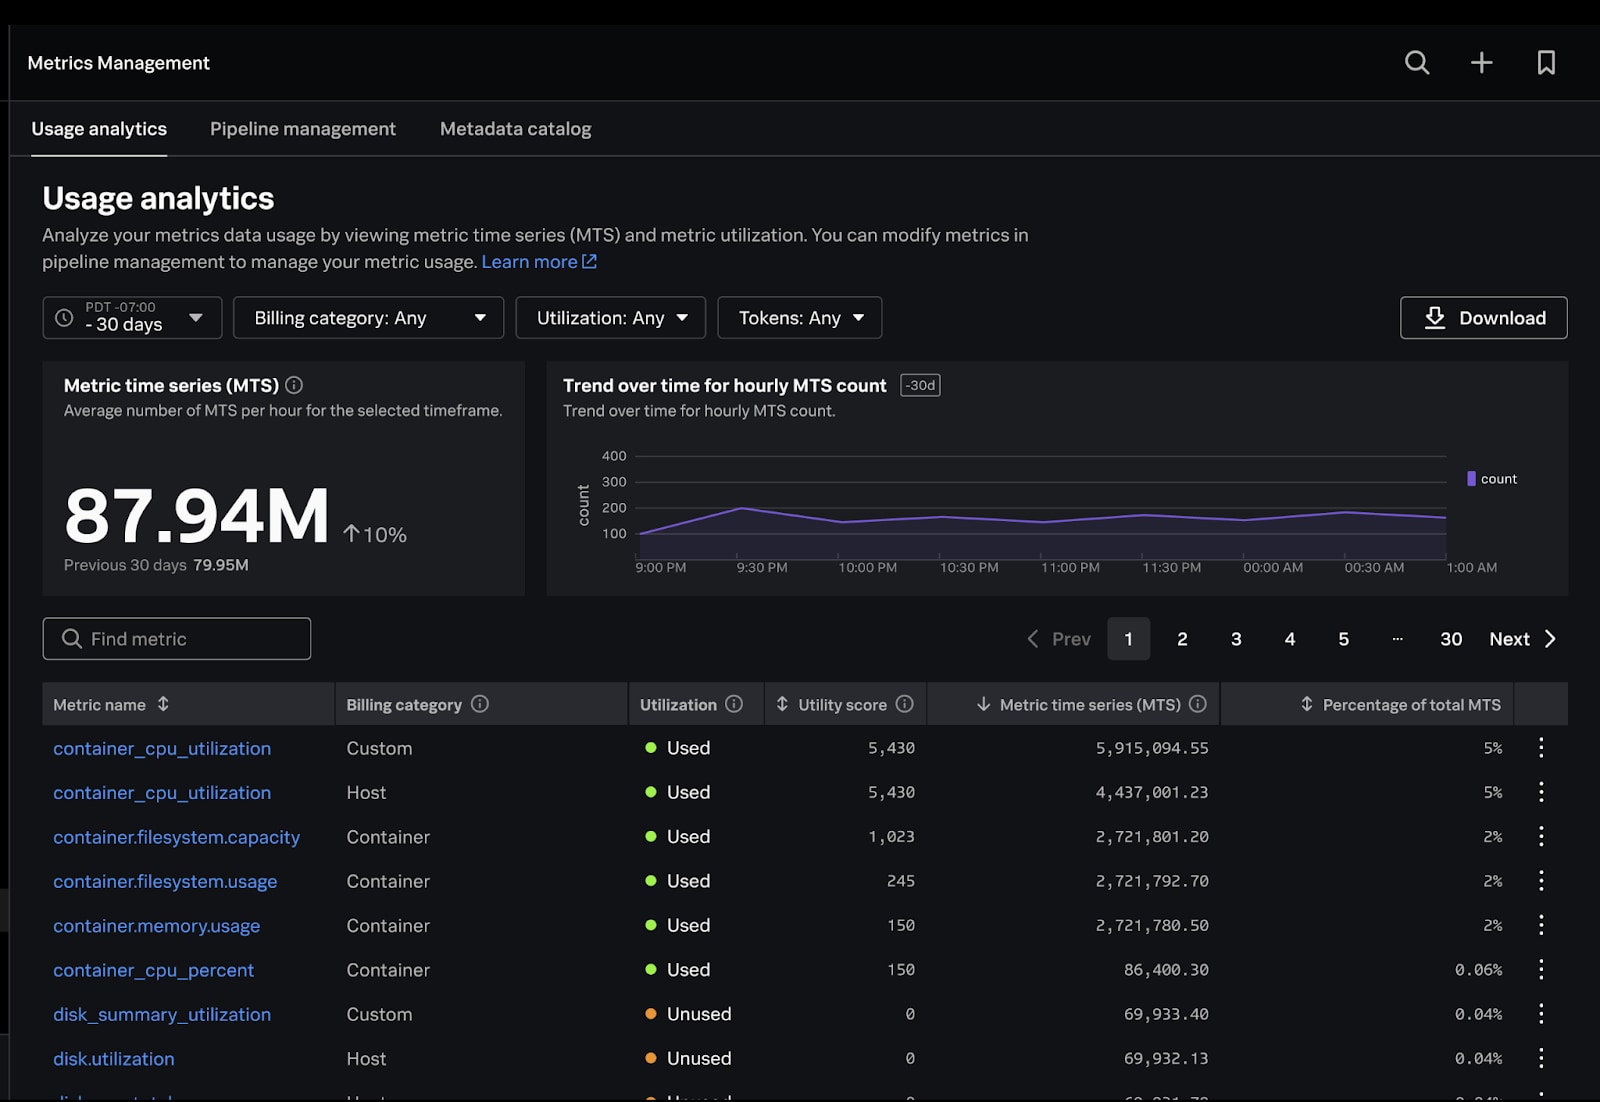
A reporting interface like Metrics Usage Analytics (MUA) in Splunk’s Metrics Management should be your go-to solution for monitoring data usage. It gives you detailed visibility of your metric time series (MTS) consumption so you can easily identify high cardinality dimensions and high-volume tokens that drive up metric counts and make better data-driven decisions about your pipeline management. Each metric is also assessed for its utilisation within your environment, so you can accurately isolate which metrics are being used within charts, detectors, or not being used whatsoever.
Cost Optimizer Tool for AWS EC2
In addition to Metrics Usage Analytics, Splunk Infrastructure Monitoring has a built-in cost optimizer tool for AWS EC2 that gives you actionable insights into utilization and cost-saving opportunities. This tool is accessible with just a few clicks, and is fully integrated with the rest of Splunk Observability Cloud — meaning that you can easily set alerts when billing goes outside of thresholds you’ve set. You can also see the trend in your spending and tie it to deployments or other business metrics.
Token Limit
Splunk helps you track and limit usage by tokens, which can be provisioned with high granularity to meet the level of segregation (team, service, etc.) that your organization needs. You can also use tokens to limit how much data is coming through (hosts, containers, custom metrics) and track utilization for each level so you can be more in control of your data usage. This sets up the foundation needed to allow organisations to set up a showback/chargeback model for better cost allocation and transparency.

The Data Management Experience You Deserve With Splunk Observability Cloud
When you choose an observability solution, you’re making a bet for the long-term. That’s why your organization should opt for one which prioritizes data management transparency, flexibility and efficiency.
With Splunk, you get best-in-class data management experience with unmatched granularity, control and simplicity. So you know you’re in good hands and can confidently scale your business and address real-world observability challenges without fear of performance failures or unpredictable billing surprises.
Find out more about data management and other self-service solutions or try Splunk for free for 14 days.
Related Articles
About Splunk
The world’s leading organizations rely on Splunk, a Cisco company, to continuously strengthen digital resilience with our unified security and observability platform, powered by industry-leading AI.
Our customers trust Splunk’s award-winning security and observability solutions to secure and improve the reliability of their complex digital environments, at any scale.


