The State of Observability
Realize 2.67x returns on investments. See how in our latest State of Observability report.

Welcome to the third blog of the Observability Center of Excellence (O11y CoE) series! If you’ve been following along, we’ve discussed the why behind an O11y CoE, and we explored how to assemble and structure the team to make it a reality.
Now, we’re ready to dive deeper into one of the CoE’s critical functions: defining and measuring Observability as a Service (OaaS).
In the context of an Observability CoE, OaaS is the operating model for delivering observability capabilities to the organization. Much like other "as a service" models, OaaS focuses on providing observability as a scalable, measurable, and value-driven practice that supports teams across the business.
To determine its effectiveness, it must be instrumented — just like the systems it aims to monitor.
Is your observability practice positioned to help teams resolve incidents faster, reduce downtime, and optimize performance? Defining some base KPIs early in your journey not only helps the CoE answer these questions but also enables it to leverage data to understand what’s working (and what’s not).
These KPIs provide visibility into the CoE’s value, empowering it to continuously refine and improve its delivery of observability services. In this blog, we’ll explore:
By the end, you’ll have the tools and insights to ensure your Observability CoE is delivering measurable value through OaaS, setting the stage for future enhancements like maturity assessments and tactical implementations.
A fellow Splunker created a great article on KPIs, OKRs, and metrics, breaking down their distinctions and how they complement each other. The gist is simple:
Key performance indicators (KPIs) are like the operational pulse of your observability practice. They answer questions like, “What’s happening right now?” and “What trends have emerged over time?”
These indicators provide a near-time and historical view into the health of your OaaS, helping you identify trends, measure effectiveness, and take action.
Objectives and Key Results (OKRs) are about where you want to go. They combine a clear objective (the goal) with measurable results to ensure progress.
While KPIs tell you what’s happening, OKRs drive strategic alignment and improvements.
Imagine your Observability CoE tracks a KPI called Agent Saturation, which measures the percentage of available resources instrumented with observability agents. This KPI shows how comprehensively your environment is covered.
The KPI tells you: "We currently have 75% saturation across Tier 0 and Tier 1 applications." In response to this, the related OKR might be:
In this case, the KPI provides the current state and historical context, while the OKR establishes the target state and timeframe for improvement. Together, they ensure the CoE can monitor progress while driving a strategic outcome.
KPIs and OKRs complement each other by ensuring your OaaS practice is operationally effective and strategically aligned:
Together, they create a feedback loop: KPIs inform how close you are to achieving OKRs, while OKRs ensure you’re focusing on initiatives that deliver meaningful value. By distinguishing between KPIs and OKRs, your Observability CoE can build a framework that:
Any service offering thrives on actionable, meaningful, and relevant KPIs that provide insights into what’s working — and what isn’t. A well-chosen KPI doesn’t just measure performance; it also drives continuous service improvement and supports broader objectives, such as enabling the Observability CoE (O11y CoE) to achieve its OKRs.
(Learn more about KPI management, including how to identify impactful KPIs, avoid common mistakes, and set up KPI management frameworks.)
Defining KPIs is as much about knowing what to avoid as it is about selecting the right metrics. Some common pitfalls include:
The Observability CoE is central to ensuring success with both KPIs and OKRs. By defining actionable KPIs early and aligning them with clear OKRs, the CoE can:
Defining KPIs isn't just about tracking progress; it's about laying the foundation for a successful Observability-as-a-Service (OaaS) model.
By explicitly integrating OKRs, your O11y CoE gains the ability to continuously adapt, refine, and enhance its value proposition. This alignment ensures that observability practices drive iterative and constant value updates to the business, keeping the organization responsive and competitive.
When identifying KPIs for your Observability CoE, it’s useful to group them into categories based on their focus and purpose. To quickly recap, OaaS KPIs should help assess whether your OaaS operating model is effectively delivering, or is positioned to deliver, observability capabilities to the organization.
Organizing KPIs into these categories ensures your measurements are actionable and aligned with the outcomes your Observability as a Service (OaaS) practice strives to achieve.
Later in this blog, I’ll provide specific examples of O11y KPIs, including their descriptions, purposes, calculations, potential data sources, and which category they fall under. For now, let’s explore the core KPI categories:
Focus: Ensuring observability tools and platforms are operational and accessible.
This type of KPI tracks the reliability of your observability ecosystem, helping you answer questions like:
Focus: Monitoring the deployment and use of observability tools and resources.
Utilization KPIs measure things like license usage, tool versioning, and deployment coverage, ensuring you’re getting the most out of your investments. Key questions include:
Focus: Measuring engagement with observability tools and practices across teams and environments. Adoption KPIs cover two key dimensions:
Focus: Enhancing efficiency and reducing noise.
Optimization KPIs evaluate how well your observability practice reduces unnecessary alerts, improves workflows, and minimizes manual effort. These KPIs tackle questions like:
By organizing KPIs into these types, you can align your measurements with the strategic goals of your CoE and your organization.
Now, let's take a look at some specific examples of OaaS KPIs, explaining their purpose, how to calculate them, and some practical “pro-tips” based on my experience.
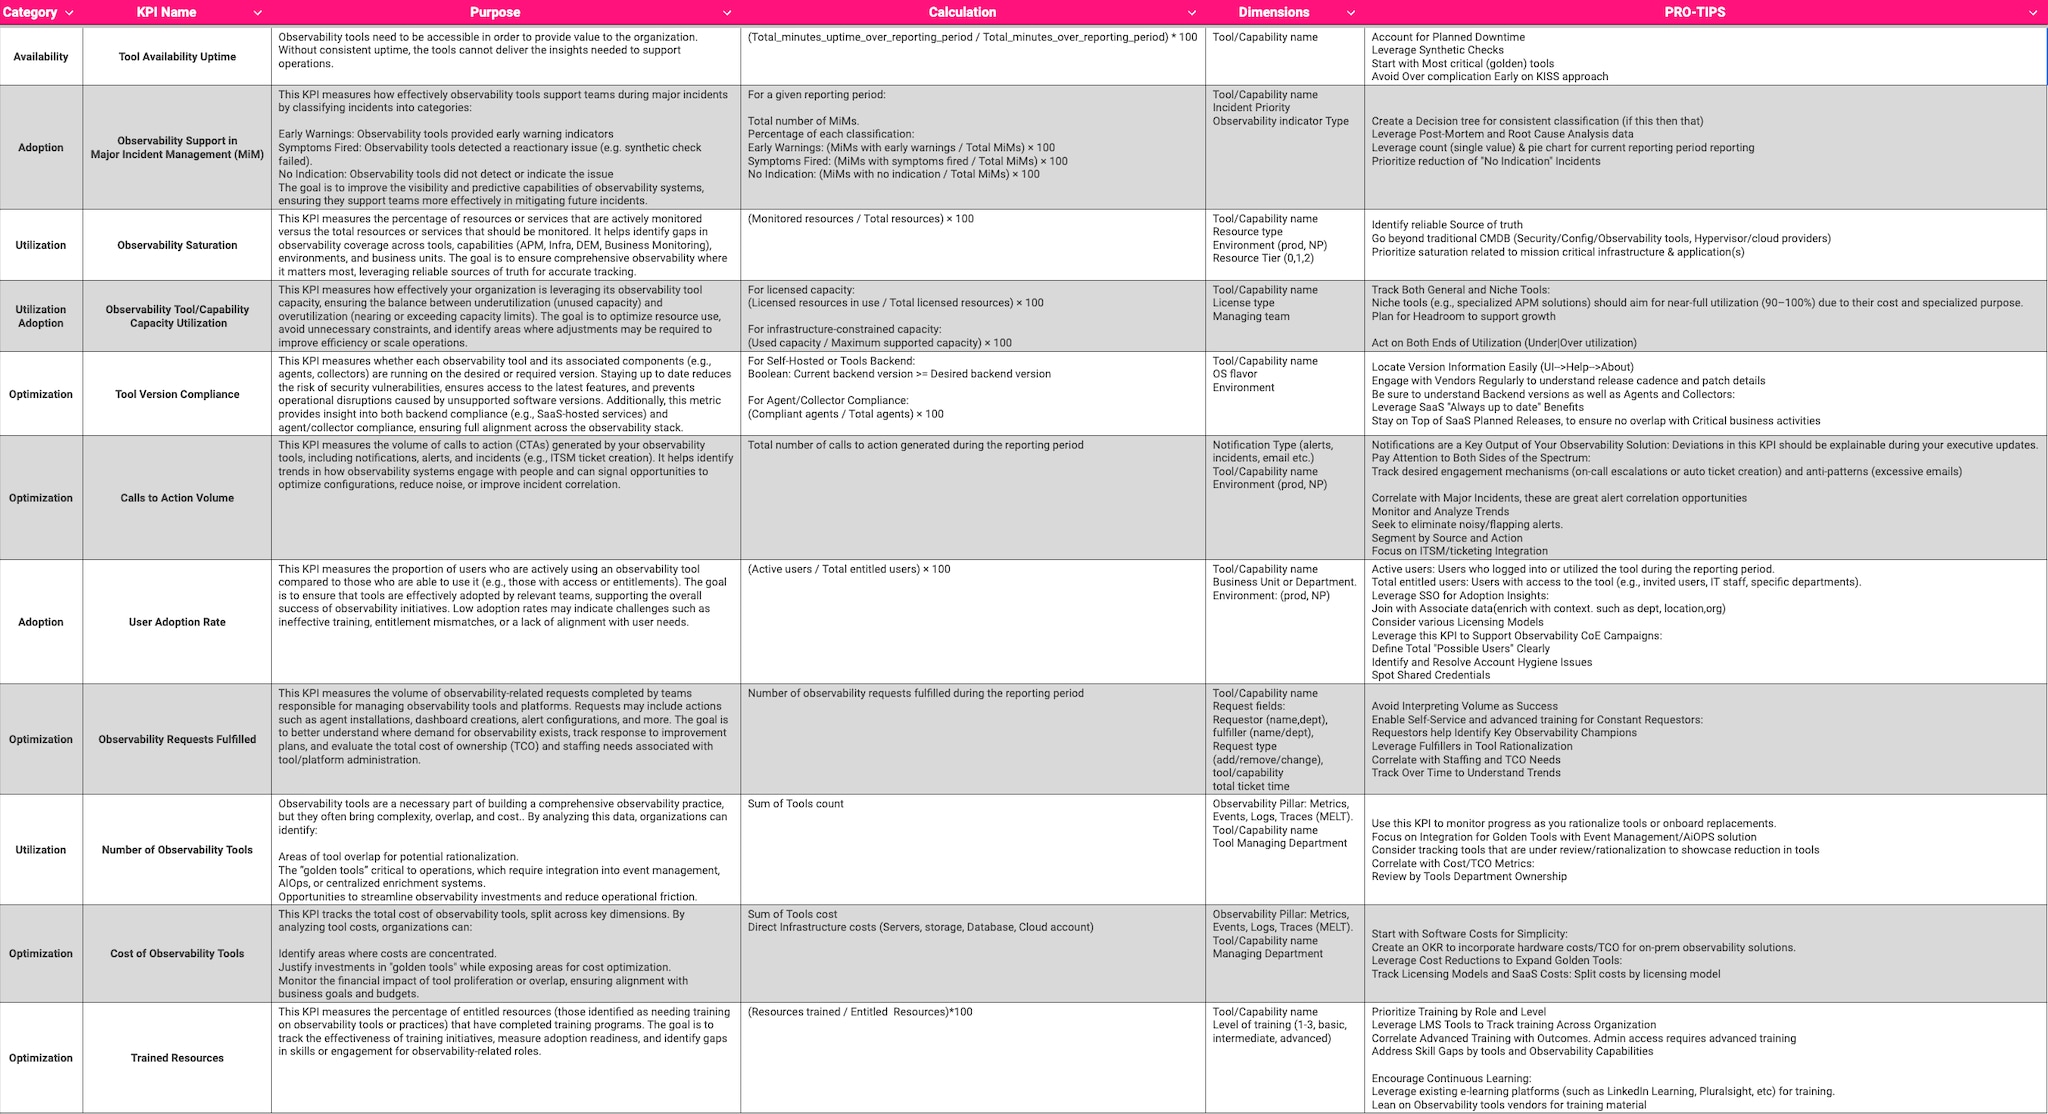 Click here to expand
Now that you’ve explored the critical role KPIs play in defining and measuring Observability as a Service (OaaS), it’s time to put these ideas into action. Here's your call to action:
Begin gathering data for the KPIs we’ve discussed, even if it’s as simple as plugging them into a spreadsheet. This initial step will help your tools administration teams to:
Make your initial objective simple and actionable. For example:
Use the outcomes from this exercise to enhance your Observability CoE’s monthly updates with your executive champion. Highlight early wins, gaps, and actionable insights to build momentum and alignment.
Once you’ve established baseline data, use it to define meaningful and attainable goals. For example:
In upcoming blogs, we’ll explore deeper aspects of creating a leading observability practice, including tools inventory, rationalization, and strategies for streamlining your observability ecosystem.
If you’re passionate about learning about observability, I’d encourage you to:

The world’s leading organizations rely on Splunk, a Cisco company, to continuously strengthen digital resilience with our unified security and observability platform, powered by industry-leading AI.
Our customers trust Splunk’s award-winning security and observability solutions to secure and improve the reliability of their complex digital environments, at any scale.

Get the latest articles from Splunk straight to your inbox.
© 2005 - 2025 Splunk LLC All rights reserved.
