Supercharge IT Monitoring
Impress your customers, simplify ops, and save money. Learn how in this guide.
Kubernetes is the standard for orchestrating containerized microservices — but it can present some monitoring challenges. Luckily, we’ve already covered why monitoring Kubernetes is a must-do, the basics of how to do it, and the options you have for collecting monitoring data from a K8s environment.
In this tutorial, we’ll dig into how you can collect and visualize key Kubernetes telemetry data using Splunk Observability Cloud, with a specific focus on Splunk Infrastructure Monitoring and OpenTelemetry. Splunk delivers real-time visibility into Kubernetes environments and enables quick, real-time issue identification, troubleshooting, and response.
Let’s get started!

Does your organization struggle to ensure the performance and reliability of revenue-generating microservices? Are you an SRE, DevOps professional, or software engineer? If so, join us for a free, hands-on workshop!
In this session, you’ll discover how to level Splunk’s automatic discovery and configuration for Java microservices in a K8s-based environment to easily overcome your monitoring challenges.
Splunk Infrastructure Monitoring integrates with every layer of your environment to provide end-to-end observability for your applications — including Kubernetes-based applications. Using the Splunk Distribution of the OpenTelemetry Collector for Kubernetes, you can easily deploy the OpenTelemetry Collector to receive, process, and export telemetry data.
Here’s how to do it in a Kubernetes environment:
Splunk Application Performance Monitoring (APM) enables directed troubleshooting of microservices, guiding you from an alert to the root cause of issues by correlating metrics and traces across the stack using related content.

Let’s now look at the several ways you can collect K8s metrics.
For basic monitoring of a Kubernetes cluster managed by a cloud provider, Splunk Infrastructure Monitoring can integrate directly with services like AWS, Azure, and GCP to collect data. This is relatively straightforward and lets you collect Kubernetes metrics without installing an agent.
However, there are some drawbacks:
Prometheus is a fairly common starting point for people who want to get visibility into their Kubernetes metrics. The Prometheus receiver allows the Splunk Distribution of the OpenTelemetry Collector to collect metrics from any source exposing telemetry in Prometheus format. This makes it incredibly easy to send metrics to Splunk Observability Cloud.
The OpenTelemetry Collector also automatically changes Prometheus metric types to their equivalents in OpenTelemetry.
The Splunk Distribution of the OpenTelemetry Collector provides a unified way to receive, process, and export telemetry data to Splunk.
Once the Collector is deployed and configured, it dynamically detects and collects telemetry data from services running in your environment. Within a Kubernetes environment, the Collector runs as a DaemonSet (a copy per node in your Kubernetes cluster), with each instance of the agent monitoring services running on those same nodes.
Additionally, the Splunk Distribution of the OpenTelemetry Collector reports metrics at a 1-second resolution by default, making it particularly well suited for the ephemeral and dynamic nature of Kubernetes environments.
Installing the Collector for Kubernetes with the Helm 3.0 client requires just three steps:
Let’s walk through this! First, add the Splunk OpenTelemetry Collector for Kubernetes’ Helm chart repository using the following command:
$ helm repo add splunk-otel-collector-chart https://signalfx.github.io/splunk-otel-collector-chart
Make sure the repository is up to date with the following command:
$ helm repo update
Run the following commands on your Kubernetes cluster to install the Splunk OpenTelemetry Collector for Kubernetes, making sure to modify the configuration values to match your desired values:
$ helm install splunk-otel-collector --set="splunkObservability.accessToken=<ACCESS_TOKEN>,clusterName=<CLUSTER_NAME>,splunkObservability.realm=<REALM>,gateway.enabled=false,splunkObservability.profilingEnabled=true,environment=<ENV>,operator.enabled=true,certmanager.enabled=true,agent.discovery.enabled=true" splunk-otel-collector-chart/splunk-otel-collector
Finally, if cert-manager is deployed, make sure to remove certmanager.enabled=true from the values in the command above since two instances of cert-manager can’t run on the same node.
The Collector install command above enables automatic discovery and zero-code instrumentation. With automatic discovery enabled, the Collector can automatically identify and collect metrics and traces without requiring manual configuration of the Collector. Automatic discovery is also available for third-party services in Kubernetes like databases and web servers running in your Kubernetes environment.
Zero-code instrumentation of Java, Node.js, and .NET backend applications enables the Collector to retrieve data from application runtimes without requiring:
With the successful execution of the Collector install command, your K8s data will be available for exploration within the Kubernetes navigators in Splunk Infrastructure Monitoring in seconds, and data from your supported applications will appear in Splunk APM.
In Splunk Infrastructure Monitoring, a navigator is a collection of resources that lets you monitor metrics and logs across various instances of your services and helps you easily detect performance outliers. Navigators provide an immediate view of your system infrastructure, complete with clear alert notifications and clear visualizations around critical health metrics.
Charts within navigators are populated with metrics exported from the OpenTelemetry Collector, and you can quickly dig deeper into elements of your environment, like:
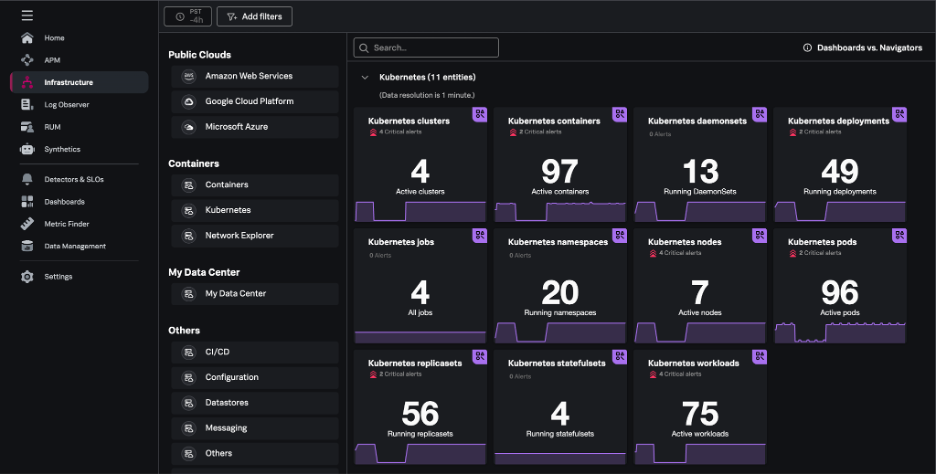
On the Infrastructure page within Splunk Observability Cloud, you can view summary cards for Kubernetes navigators under the Kubernetes section.
Kubernetes navigators exist for critical elements of the Kubernetes environment and include navigators for: clusters, containers, pods, nodes, deployments, jobs, namespaces, workloads, services, resources, DaemonSets, ReplicaSets, and StatefulSets.
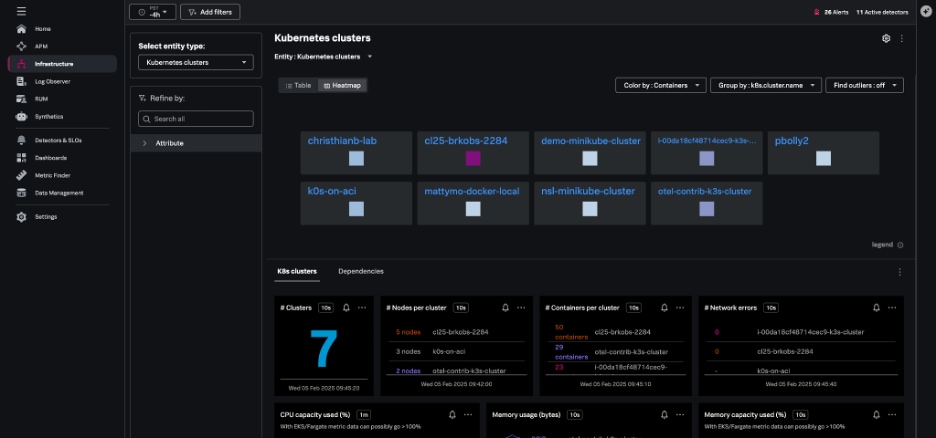
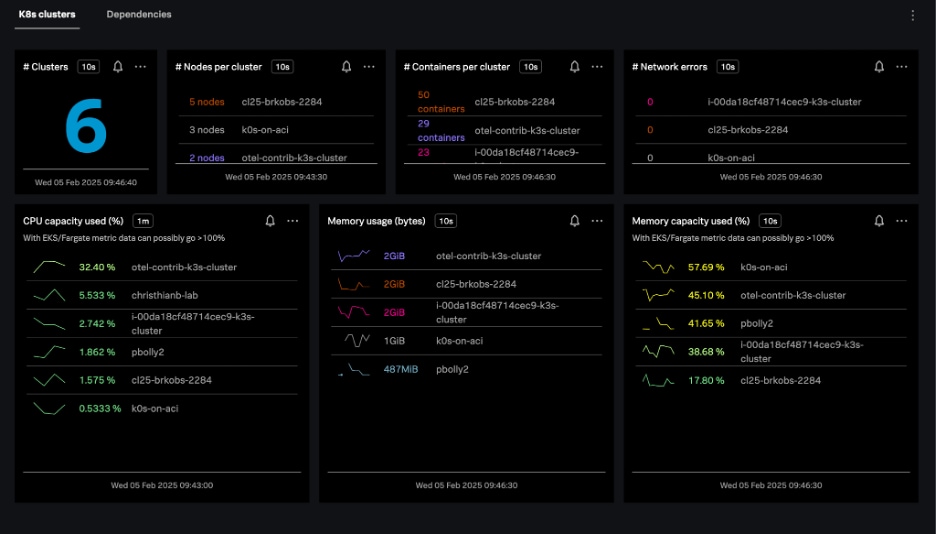
The Kubernetes clusters navigator provides cluster-scoped data for every Kubernetes cluster you monitor in Splunk Infrastructure Monitoring. The data provided includes:
Clusters can be represented in either table or heatmap view.
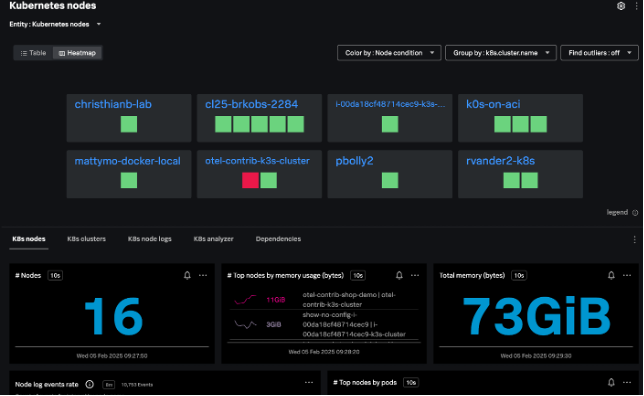
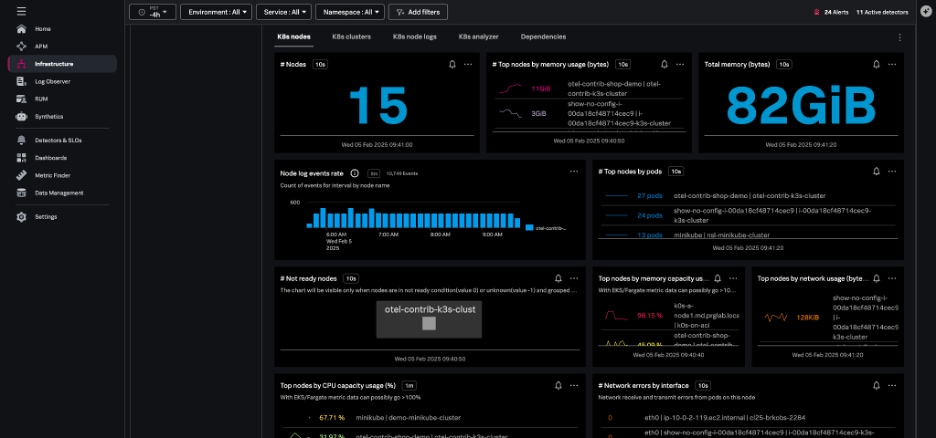
The Kubernetes nodes navigator provides information about the number of nodes, pods, node events, and aggregated system metrics (CPU, disk, memory, network) across all nodes.
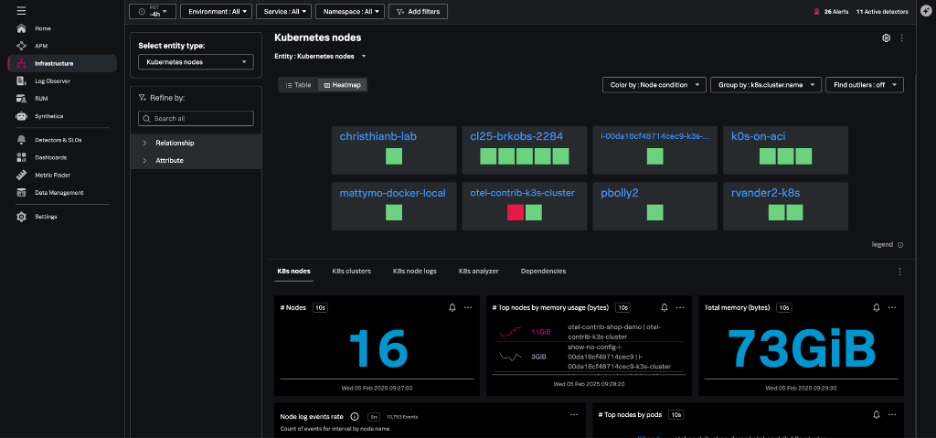
You can also view your nodes together, instead of grouping them by the cluster – this lets you assess the health of the infrastructure supporting your Kubernetes cluster.
From the node view, the hierarchy map highlights the individual pods within the node and the node charts provide information about node conditions, workloads, network, and resource usage. Selecting an individual pod from this node view allows you to navigate to specific pods and containers quickly.
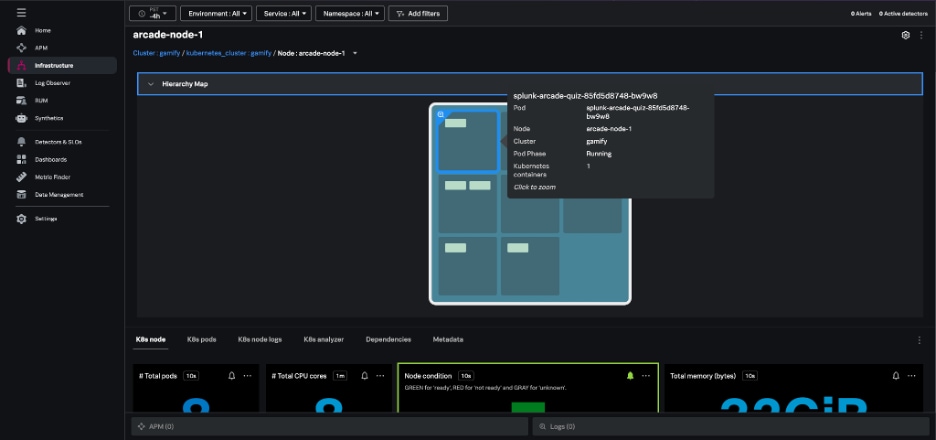
The nodes heatmap and node hierarchy map are colored by one of several conditions: Node Ready, Memory Pressure, PID Pressure, Disk Pressure, Network Unavailable, and Out of Disk.
The Kubernetes pods navigator allows you to track activity across a particular pod or all pods, using the same dynamic filtering and grouping available in the nodes navigator.
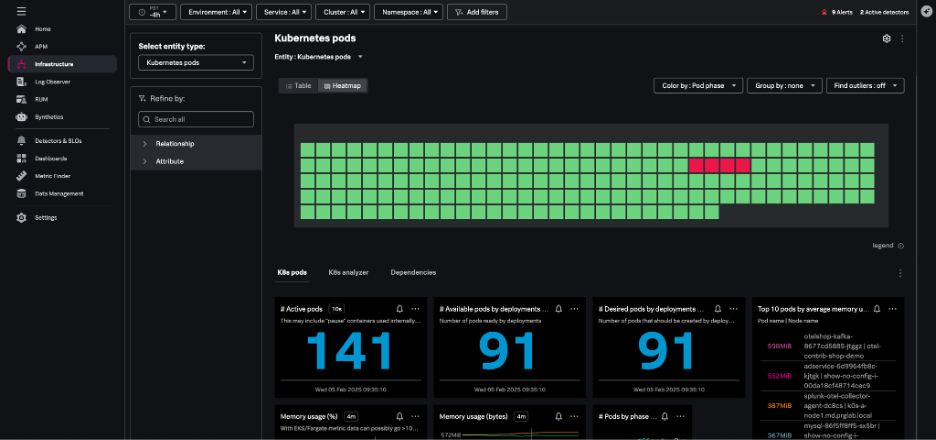
From any individual pod in this view, you can:
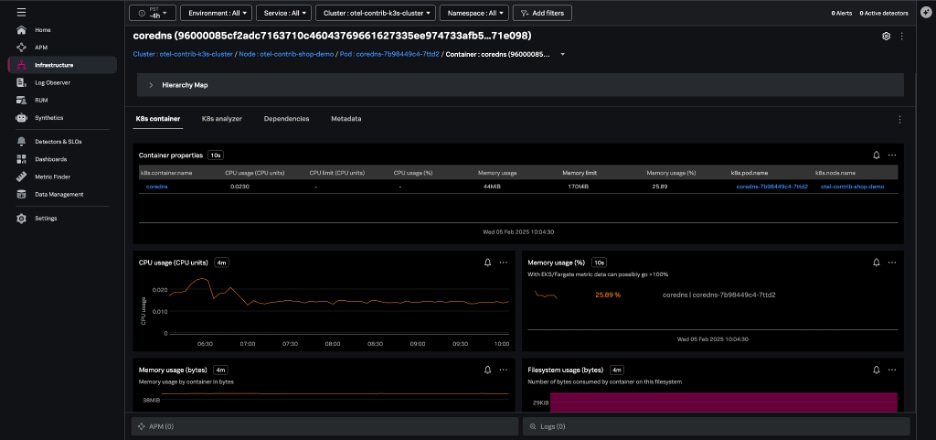
The Kubernetes containers navigator shows each of the containers reporting to Splunk from your environment:
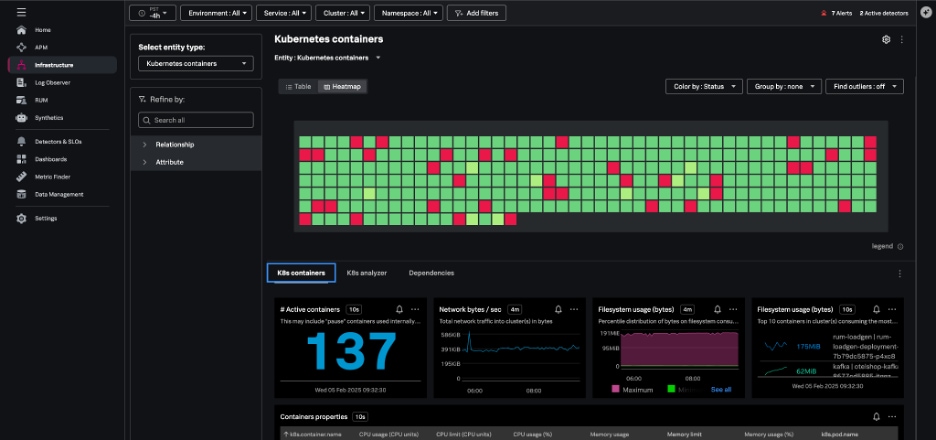
Navigating here from the pod view will show just the containers in a single pod, and you can also group and filter your containers by Kubernetes-related dimensions and dig into specific containers.
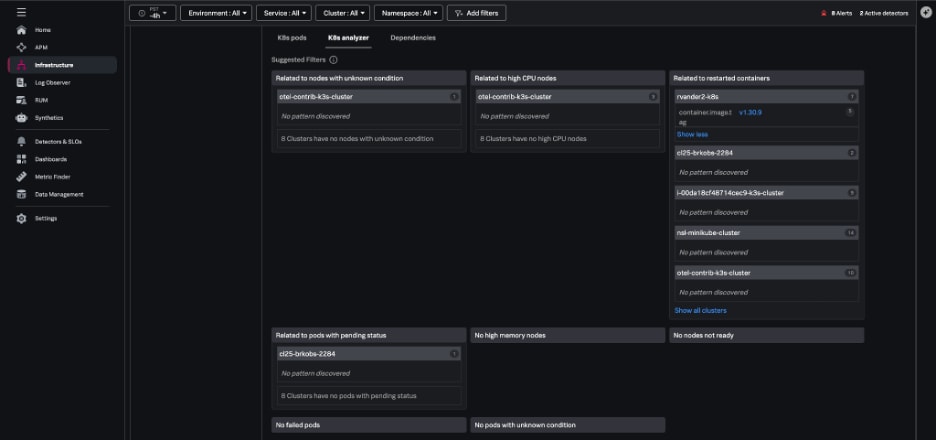
When issues arise, the K8s analyzer tab uses AI-driven insights to help you troubleshoot problems by highlighting instances that are in a bad state, such as nodes that aren’t ready. The analyzer identifies potential related issues or causes, like:
Within Splunk Observability Cloud, AutoDetect alerts and detectors are automatically created out-of-the-box so you can quickly discover common and high-impact anomalies in your Kubernetes infrastructure. These detectors alert on all common Kubernetes issues such as:
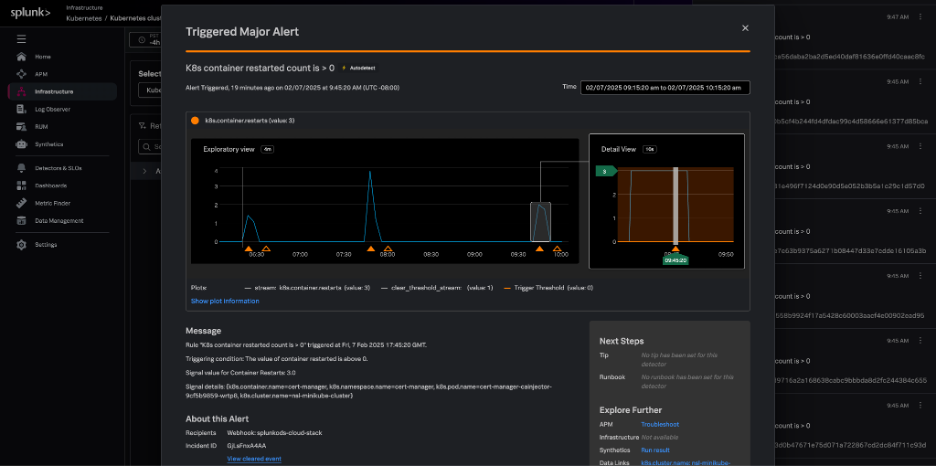
These alerts are flagged in the context of your Kubernetes navigators and provide related content links for fast troubleshooting to resources like runbooks, Splunk Application Performance Monitoring, and Splunk Infrastructure Monitoring.
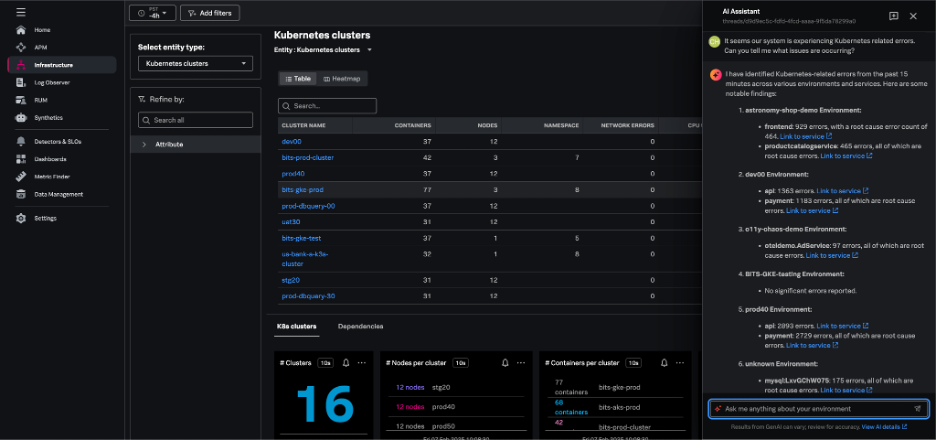
With the AI Assistant in Splunk Observability Cloud, any member of an engineering team can easily work through in-context troubleshooting and quickly identify root causes and resolutions.
Using natural language, you can ask the AI Assistant general or specific questions about the health of any part of your environment. The AI Assistant will analyze your domain-specific data, and step-by-step guide you through troubleshooting to accelerate mean time to resolution (MTTR).
Are you not yet using Splunk Infrastructure Monitoring, but you’re curious? Get started with a 14-day trial or contact an expert to learn more.
Does your organization struggle to ensure the performance and reliability of revenue-generating microservices? Are you an SRE, DevOps professional, or software engineer? If so, join us for a free, hands-on workshop!
In this session, you’ll discover how to level Splunk’s automatic discovery and configuration for Java microservices in a K8s-based environment to easily overcome your monitoring challenges.

The world’s leading organizations rely on Splunk, a Cisco company, to continuously strengthen digital resilience with our unified security and observability platform, powered by industry-leading AI.
Our customers trust Splunk’s award-winning security and observability solutions to secure and improve the reliability of their complex digital environments, at any scale.

Get the latest articles from Splunk straight to your inbox.
© 2005 - 2025 Splunk LLC All rights reserved.
