Mind The Gap! Understanding End-to-End Customer Journeys to Deliver Great Customer Experience

Over the past year or so, I’ve noticed two key trends among the Splunk customers that I speak with:
- Companies really care about what drives customers’ perception of their experience
- Some companies are re-organising themselves internally around key customer journeys, despite the fact they don’t always have end-to-end visibility of them.
As I’ve covered the first point extensively in a recent post ‘Linking operational data with customer feedback to drive improved customer experience’, I’m going to focus instead on the second point – and in particular, how to get end-to-end visibility of customer journeys. Potential benefits of doing this include reduced customer effort, improved customer experience (CSAT / NPS), as well as increased revenue and higher retention.
Why Do Customer Journeys Matter?
I always like to refer to the Wikipedia definition of customer experience: “Customer Experience (CX) is the product of (all) interactions between an organization and a customer over the duration of their relationship”.
A key implication of this definition is that healthy customer relationships have a high proportion of positive, successful customer journeys.
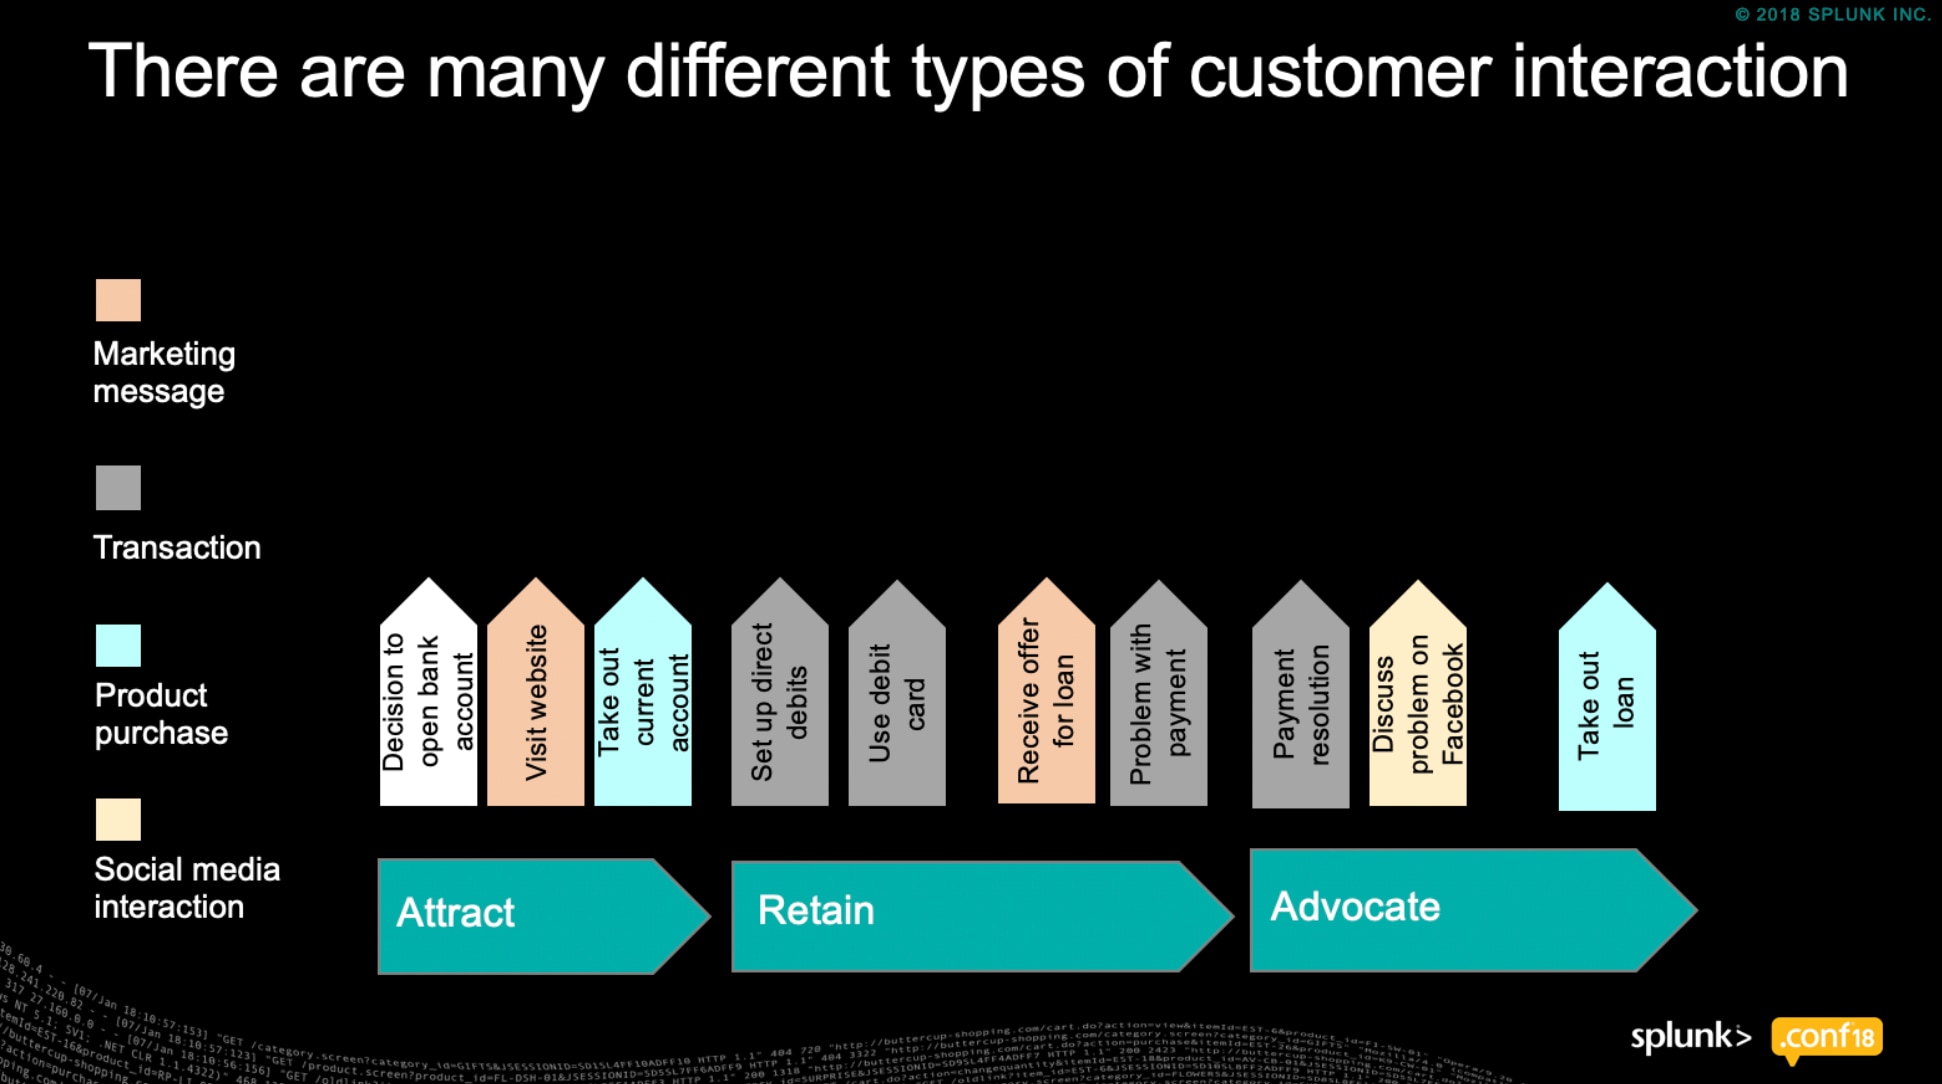
When journeys are not successful, providers need to have immediate visibility of any ‘pain points’ so they can react swiftly. To demonstrate this, let’s consider the health of a retail banking customer relationship, as shown below:

A number of customer journeys and provider interactions take place, and to help us to navigate this complex relationship these have been colour coded by activity:
Orange = Marketing Messages
Grey = Transactions e.g Payments
Blue = Product Purchases
Yellow = Social Media Interactions
For simplicity, I’ve broken the relationship down into three phases:
1 - Attract
The consumer (they are a consumer and not a customer at this point) makes a decision to open a current / checking account. They visit the providers website, and take out the product.
2 - Retain
Once they become a customer they set up their direct debits and start to use their credit cards. After a while, they receive targeted marketing offering a loan. At this point they don’t need a loan, so they decide not to take it out.
3 - Advocate
Soon afterwards, the customer has a problem with a payment. It takes a while to investigate, but eventually it is resolved. The customer is satisfied and they give positive feedback about their provider on Facebook. Their experience while trying to resolve their problem turned them into an advocate! A few months later they do need a loan, so they contact their provider and take it out based on the information received previously.
Only by delivering a consistently positive experience did the provider manage to acquire, retain and grow the customer relationship. This customer could have left when they had a payment issue. This would not only have meant one lost customer (and potentially others who experienced the same payment issue), but it would have also meant no advocacy and no incremental product purchase.
This example massively simplifies retail banking relationships – but it’s purpose is to illustrate the point about the importance of understanding what happens during each and every interaction.
The Importance of Machine Data
With a large proportion of customer journeys now being undertaken entirely using digital channels, it is impossible to fully understand customer issues without harnessing machine data. Many companies still don’t have end-to-end visibility of digital journeys, for three main reasons:
1. Journeys can be fluid and sometimes have no fixed ‘start’ and ‘end’ point, so can be difficult to define;
2. Organizations frequently adapt or change their business processes, which makes it difficult to maintain monitoring solutions; and
3. Journeys can span multiple applications or channels, making it difficult to ‘stitch together’ steps. Multiple IDs are often also used during journeys, making event correlation more challenging.
At .conf18 Splunk announced a beta solution called Business Flow enabling organisations to gain immediate visibility to business processes and customer journeys, by automatically stitching together the machine data generated at each step. Gaining this end-to-end visibility is critical for reducing escalations and customer churn – as well as bridging the ‘gap’ between what companies perceive their customer journeys to be, and what actually happens (i.e the ‘gap’ between expectations and reality.)
Bridging the Gap
I started to discuss the impact of this ‘gap’ in my blog ‘Understanding the impact of negative customer experience’. The key out-take from this was that there are multiple (often unexpected) events that can happen during any journey preventing consumers / customers from achieving their goal.
With this ‘gap’ in mind, I’ve built a framework for improving customer experience which was first introduced in a presentation I gave at .conf18 (Slides | Video)

The first step is to set up a monitoring environment for all (priority) customer journeys. This enables companies to understand the impact of every journey step in terms of supporting customers to achieve their goal. But it is possible to go even further than this…
By overlaying customer feedback and social media, you will get a better sense of how operational performance impacts how customers feel about their experience. Once you have this understanding of ‘what happened’ alongside ‘how it made customers feel’, you can start deriving insights to identify actions and workflows aimed at improving customer experience.
Ensuring that machine data from customer journeys can be instrumented is fundamental to bridging the dangerous ‘gap’ between the expected customer journey and reality. Hence: Mind The Gap!
Related Articles
About Splunk
The world’s leading organizations rely on Splunk, a Cisco company, to continuously strengthen digital resilience with our unified security and observability platform, powered by industry-leading AI.
Our customers trust Splunk’s award-winning security and observability solutions to secure and improve the reliability of their complex digital environments, at any scale.


