Kubernetes Monitoring: The Ultimate Guide

One of the first things you’ll learn when you start managing application performance in Kubernetes? It’s complicated. No matter how well you’ve mastered performance monitoring for conventional applications, it’s easy to get lost inside a Kubernetes cluster.
Since there are more layers to monitor in Kubernetes, and the application data is hidden within clusters, getting the data you need is much more challenging.
In this article, we’ll cover everything you need to know about Kubernetes monitoring, including:
- Key metrics to monitor
- Challenges you may face during the process
What is Kubernetes monitoring?
Businesses these days rely heavily on Kubernetes (K8s) to manage their containerized applications. In fact, 84% of organizations are either evaluating or already using Kubernetes in production.
However, as Kubernetes deployments grow, they quickly become complex — making it difficult to ensure that applications and infrastructure are running smoothly. To address this challenge, organizations use Kubernetes monitoring.
Kubernetes monitoring collects and analyzes metrics and logs from your environment to provide visibility into the performance and health of clusters and workloads. Here’s how it can help you:
- Detect problems in real time to minimize downtime which costs businesses an average of $5,000 per minute.
- Monitor unusual patterns that could indicate security threats.
- Understand application behavior to scale resources effectively.
Why Kubernetes monitoring is important
Since most applications are distributed, monitoring becomes necessary for maintaining reliability. It helps DevOps teams and system administrators answer questions such as:
- Are pods and nodes healthy?
- Is the infrastructure meeting SLAs?
- How is resource consumption trending over time?
When done right, monitoring provides actionable insights to preempt potential bottlenecks and reduce system disruptions, which improves the overall user experience.

Key metrics to monitor in K8s
There are several types of Kubernetes metrics and each one provides specific insights. So, let’s see what they are:
Cluster metrics help you track the overall health of the Kubernetes cluster. They include information like:
- Resource usage across nodes (CPU, memory, and disk)
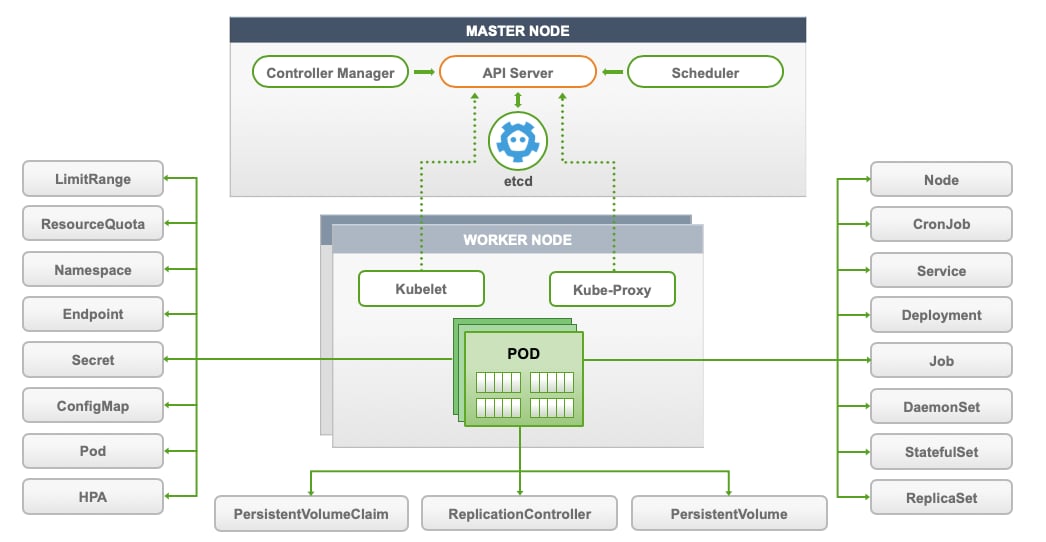
- The availability of cluster components, like the API server
Node metrics focus on individual nodes within the cluster. They show how much of a node's resources — such as CPU, memory, network bandwidth, and disk space — are being used.
Pod metrics are the smallest deployable units in Kubernetes. Pod metrics include memory usage and pod statuses (running, pending, or failed) and they identify whether the requested resources are being met.
Application metrics monitor the applications running within your pods. They give insights into app-specific performance indicators, such as:
- Response times
- Error rates
- Throughput
Control plane metrics provide insights into the components responsible for maintaining the desired state of the cluster. For example, metrics for scheduler, controller manager, and API server make sure the cluster operates appropriately.
(Related reading: control plane vs. data plane.)
Challenges in Kubernetes monitoring
Kubernetes has become the de facto standard for container orchestration. However, monitoring and observability are two of the biggest challenges in adopting Kubernetes, second only to a lack of training.
In the latest CNCF survey, 46% of those surveyed say lack of training is a key challenge for organizations beginning their cloud-native journey. Security concerns (40%) and the complexities of monitoring and observability with container proliferation further complicate adoption. But here’s why this happens:
- Distributed architecture: Kubernetes’ distributed nature introduces numerous components to monitor — each generates data from diverse sources. Traditional monitoring tools often fail to account for the multi-dimensional correlations between these components.
- Ephemeral containers: Kubernetes relies on ephemeral and dynamic containerized workloads that can appear and disappear unpredictably. Traditional tools struggle to track this level of dynamism and dimension.
- Siloed data sources: Kubernetes environments generate metrics, events, and logs from multiple sources. Without integration, DevOps and SRE teams frequently switch between tools which increases the mean time to resolution (MTTR).
- Manual correlation and lack of automation: High-velocity data streams from various components make manual correlation inefficient and error-prone. Traditional tools often lack AI or machine learning capabilities to analyze and correlate this data effectively.
A new approach is needed
To address these challenges, a new approach is required to monitor Kubernetes-based applications effectively. Here’s what it should look like:
- Understand the health of the Kubernetes cluster and its components' interdependencies, including nodes, containers, workloads, and Kubernetes-specific elements.
- Streamline the monitoring process with granular logging for context. This ensures that wherever you are in the Kubernetes environment, you can access relevant logs without switching contexts.
- Enable real-time analytics and insights in your environment. Use monitoring systems that provide streaming data and instantaneous alerting to stay ahead of potential issues.
- Leverage AI and ML-based automation to handle the scale and complexity of Kubernetes environments.
(Related reading: Kubernetes logging done right.)
Best Practices for Kubernetes monitoring
Here are some of the best practices to follow when monitoring Kubernetes:
Choose relevant metrics
Not all data is equally useful. Focus specifically on system and application metrics because they directly impact your system's health and performance.
- System metrics like CPU and memory utilization, disk I/O, and network traffic provide a baseline view of cluster health.
- Application-specific metrics, such as pod and node availability and resource usage, provide insights into performance.
So, align these metrics with your business objectives and define collection rates and retention periods for efficient data management.
(Related reading: SRE metrics to know.)
Implement comprehensive labeling
Use labels (key-value pairs) attached to Kubernetes objects like pods and nodes to organize and manage your resources.

For example, you can label pods by deployment name or environment ('app=web' or 'env=production') for easy filtering and aggregation of metrics. This will simplify both monitoring and troubleshooting since you can focus on specific subsets of your infrastructure.
Use service auto-discovery
As your cluster grows, manually configuring monitoring for each new service becomes impractical. Implement service auto-discovery to detect and monitor new services as they are deployed automatically.
Set up real-time alerting
Configure alerts to notify you of critical issues, such as high resource usage or application errors. This will prevent minor issues from escalating into major problems. So, make sure that alerts are actionable and directed to the appropriate teams for swift resolution.
Tools for Kubernetes event monitoring
Monitoring Kubernetes can be challenging — however, the right tools make it easier by helping you track what's happening in your clusters. Let’s look at some of the most common tool options:
Kubernetes dashboard
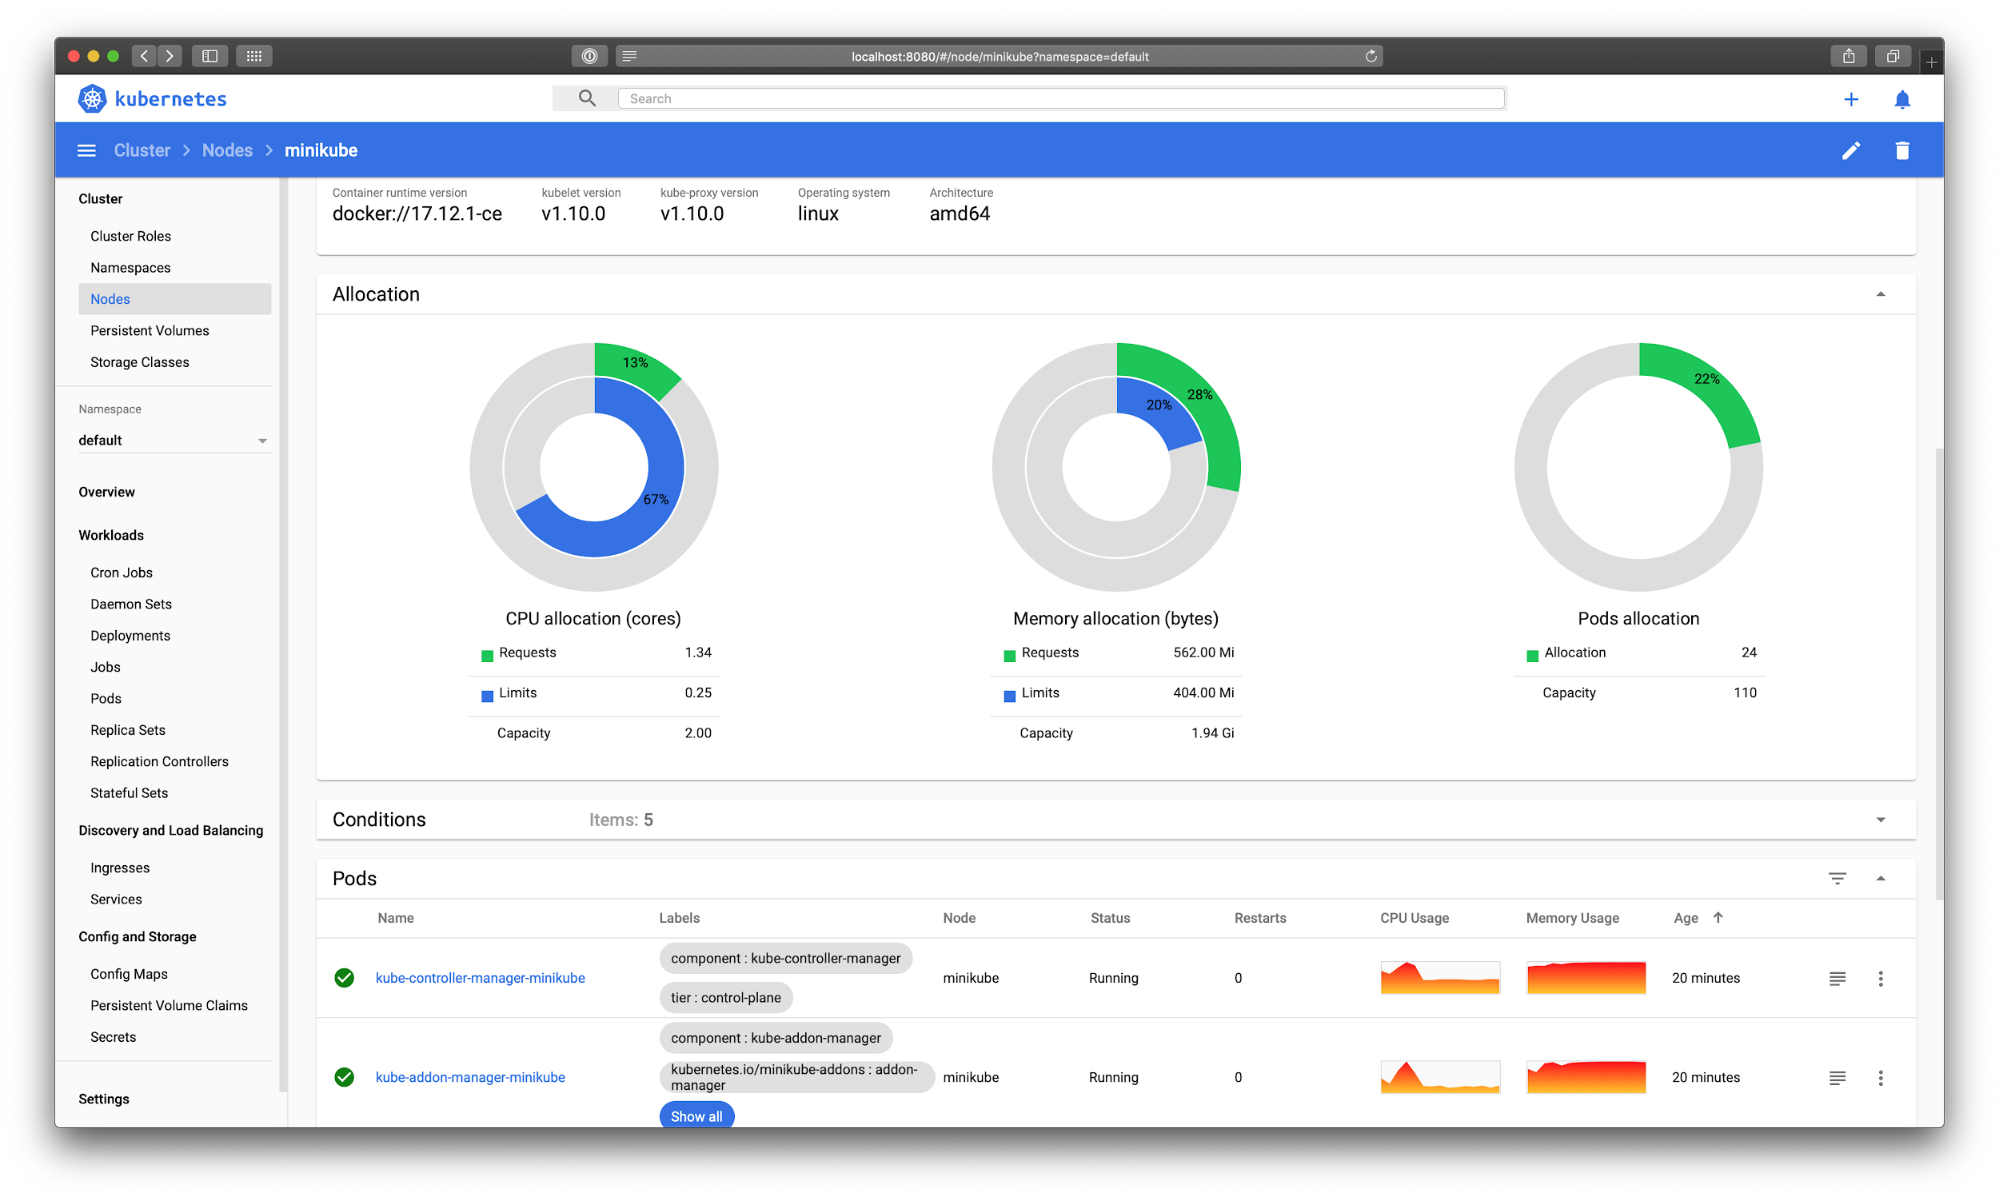
Kubernetes Dashboard provides a basic UI for getting resource utilization information, managing applications running in the cluster, and managing the cluster itself.
You can access it with the following command:
$ kubectl apply -f https://raw.githubusercontent.com/kubernetes/dashboard/v1.10.1/src/deploy/recommended/kubernetes-dashboard.yaml
You must create a secure channel for your Kubernetes cluster to access the Dashboard from your local workstation. To do so, run the following command:
$ kubectl proxy

Kubewatch
Kubewatch is a simple tool for monitoring your Kubernetes cluster. It sends alerts to platforms like Slack or Microsoft Teams whenever something changes in your cluster, such as updates to pods or services. You can set up these notifications using an easy-to-edit YAML file and get real-time updates about what's happening.
You can set up Kubewatch manually or with Helm charts. Unlike other monitoring tools, it gives fast alerts to keep you in the loop about your cluster's activity.
However, it can also overwhelm you with excessive notifications and, users report that it provides no options to customize messages or filter specific event types. This makes it hard to focus on critical actions.
Lastly, and perhaps most importantly, Kubewatch is no longer under active development.
Splunk
Splunk is perfectly suited to monitor Kubernetes metrics, no matter what your needs are. If you're using a cloud provider like AWS or Google, Splunk can connect directly to services like CloudWatch or Stackdriver to collect basic metrics — you don’t need any agent.
Successful implementation of Splunk Observability offers many outcomes, including:
- Getting insight into the intricate microservices environment within Kubernetes, from beginner to expert level.
- Significantly reducing your mean time to detect (MTTD) and MTTR.
- Empowering your team with seamless and effective K8s monitoring.
Users of Splunk Observability can also opt into Observability Kubernetes Accelerator. This accelerator helps you take greater advantage of Splunk Observability and implement data onboarding using the power of OpenTelemetry, greatly improving your team’s visibility into your Kubernetes environment.
(Learn more about monitoring K8s with Splunk.)
Wrap up
Monitoring applications in Kubernetes may seem daunting to the untrained. But ultimately it’s not so different from application monitoring in other contexts. The main difference is how application data is exposed within a Kubernetes cluster. Accessing the data you need is a little more challenging than you’re likely used to, but it’s possible once you understand the architectures.
- IT Monitoring
- Application Performance Monitoring
- APM vs Network Performance Monitoring
- Security Monitoring
- Cloud Monitoring
- Data Monitoring
- Endpoint Monitoring
- DevOps Monitoring
- IaaS Monitoring
- Windows Infrastructure Monitoring
- Active vs Passive Monitoring
- Multicloud Monitoring
- Cloud Network Monitoring
- Database Monitoring
- Infrastructure Monitoring
- IoT Monitoring
- Kubernetes Monitoring
- Network Monitoring
- Network Security Monitoring
- RED Monitoring
- Real User Monitoring
- Server Monitoring
- Service Performance Monitoring
- SNMP Monitoring
- Storage Monitoring
- Synthetic Monitoring
- Synthetic Monitoring Tools/Features
- Synthetic Monitoring vs RUM
- User Behavior Monitoring
- Website Performance Monitoring
- Log Monitoring
- Continuous Monitoring
- On-Premises Monitoring
- Monitoring vs Observability vs Telemetry
See an error or have a suggestion? Please let us know by emailing ssg-blogs@splunk.com.
This posting does not necessarily represent Splunk's position, strategies or opinion.
Related Articles
About Splunk
The Splunk platform removes the barriers between data and action, empowering observability, IT and security teams to ensure their organizations are secure, resilient and innovative.
Founded in 2003, Splunk is a global company — with over 7,500 employees, Splunkers have received over 1,020 patents to date and availability in 21 regions around the world — and offers an open, extensible data platform that supports shared data across any environment so that all teams in an organization can get end-to-end visibility, with context, for every interaction and business process. Build a strong data foundation with Splunk.


