What Is Five 9s in Availability Metrics?

What comes to mind when you hear that an IT component has “five 9s availability”? Five 9s availability of >= 99.999% is the peak metric for IT availability.
Five 9s predicts that a measured component — whether it is a server, communication line, app, service, or any other item — will be available at least 99.999% of the time during a specific period.
In this article, let’s get a deeper understanding of what IT availability metrics represent (including five 9s), how availability is calculated, how to gain confidence in availability statistics, and how to improve availability.
Overview: IT availability
In IT, the term “availability” refers to the amount of time a device, service, or IT component is usable. Availability uses past component performance (Total Service Time and Downtime during the measurement period) to estimate and predict future performance.
Availability metrics are used by system designers, auditors, security personnel, vendors, SLA objectives, and other functions in order to:
- Evaluate system reliability.
- Pinpoint areas for improvement.
Availability is commonly expressed as a percentage point metric (0 to 100%), calculated as:
Availability=((Total Service Time)-Downtime) ∶/: (Total Service Time)
What does five 9s for availability mean?
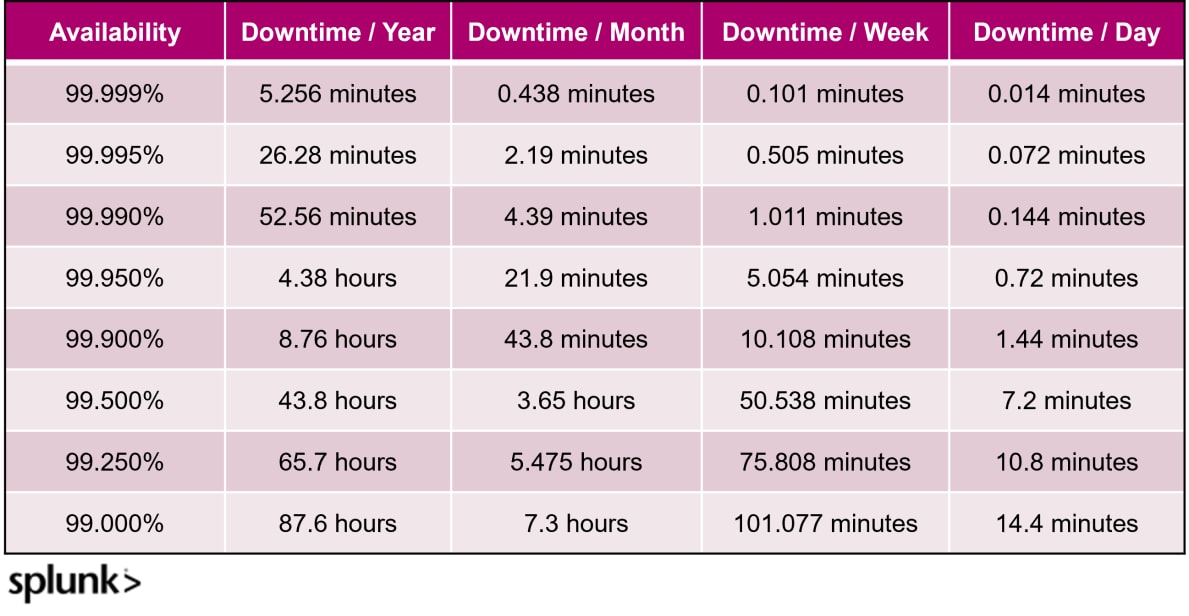
Small variations in availability percentages can lead to large variations in downtime, as shown in the table below.
- With 99.000% availability, for example, you can expect a component will be unavailable 101.077 minutes a week or 87.6 hours a year.
- At 99.999% availability (five 9s), the component is predicted to be unavailable for .101 minutes a month and a mere 5.256 minutes a year.
Five 9s are the gold standard and end goal for IT availability. When a particular component reaches five 9s availability, organizations can feel confident in the component’s ability to reliably function under most conditions and to quickly recover when the component fails. Consequently, components with lower IT availability metrics are assumed to be less dependable, more prone to failure, and more likely to benefit from upgrades that will enhance their capabilities.

Where does availability data come from?
Your availability calculations will only be as good as the data that goes into them. It can be challenging to find correct and accurate data relating to outages and Downtime. Service Time and Downtime data can be gathered from several diverse sources, including:
- Ping testing
- Monitoring software
- Help desk/call center tickets
- IT reporting when outage incidents occur
- Security Information and Event Management systems (SIEMs)
- AI analysis of log files and other system inputs and outputs
Make sure to include all relevant data in your availability metric calculations.
Confidence in Five 9s & other availability metrics
While a valuable performance and reliability evaluation tool, be aware that availability metrics can also lull you into a false sense of security regarding actual component reliability. To increase your confidence, take these items into account when making decisions based on availability metrics.
Availability time periods
Choose a reasonable and relevant time period for calculating availability metrics. When pulling metrics, is it relevant to look at data for the last year or the last month? How often should you recalculate availability? Are there some historical events that should not be included in your metrics?
Check your time range to ensure current or one-time data does not inflate or suppress metric values.
What constitutes downtime?
It can also be difficult to determine whether an outage qualifies as Downtime.
- Should Downtime statistics be included for server availability when only one person is affected?
- What if two people were affe cted or if the Downtime only affected an individual location?
- Perhaps the availability issue occurred in a different component (a telecommunications line, for example) rather than on the measured component (a server).
Review the methodology used for determining and collecting Downtime data to prevent including false positives in your availability metrics.
Unanticipated outages
Five 9s and other availability metrics are necessarily based on past performance. Future availability performance can be affected by many things that may not be present in historical Service Time and Downtime data, including:
- Malware and ransomware attacks
- Human error
- OS Security patching errors
- Coding failures
- Natural disasters
- Terrorism
After an unanticipated outage occurs, evaluate whether Downtime data from that event should be considered in future availability metrics. These events may also point to additional system improvements that can be implemented for disaster recovery and high availability processing (DR/HA).
(Related reading: infrastructure analytics & website analytics.)
The watermelon effect
Also be aware of the watermelon effect on component performance. Let’s say a production server has 99.900% availability (10.108 Downtime minutes a week or 8.76 hours a year).
But if those minutes come during peak usage periods — when your Web sites and infrastructure are being hit repeatedly — those outages will affect your business more than if the same outage happened at 3:00 AM Sunday morning.
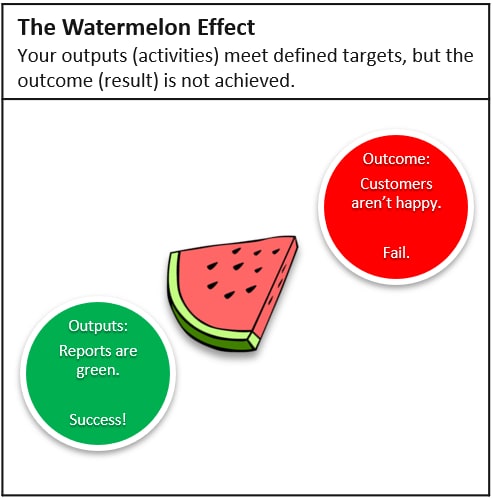
Like a watermelon, your systems may look green (all clear) on the outside but turn red (fail) on the inside, particularly when stressed. The watermelon effect can hide capacity issues affecting availability, especially when the system experiences high volumes.

Striving for Five 9s
IT availability metrics are a simple, valuable tool for analyzing and documenting IT component performance. Correctly defined and calculated, they allow you to measure how well infrastructure components are doing against expectations and to determine whether system upgrades have improved component performance.
Enterprises should strive for five 9s availability for all critical IT components, to ensure each component can reliably function under most conditions and to quickly recover after a component failure.
See an error or have a suggestion? Please let us know by emailing splunkblogs@cisco.com.
This posting does not necessarily represent Splunk's position, strategies or opinion.
Related Articles
About Splunk
The world’s leading organizations rely on Splunk, a Cisco company, to continuously strengthen digital resilience with our unified security and observability platform, powered by industry-leading AI.
Our customers trust Splunk’s award-winning security and observability solutions to secure and improve the reliability of their complex digital environments, at any scale.


