Recover Lost Visibility of IT Infrastructure With Splunk

The news of the “Sunburst Backdoor” malware delivered via SolarWinds Orion software has organizations choosing to shut down Orion to protect themselves. This includes several U.S. government organizations following the recent CISA guidance. If you are considering a similar response in your own environment, a critical next step is quickly restoring the lost visibility to the health and operations of your infrastructure.
To do this, we’ll introduce you to Splunk’s infrastructure monitoring and troubleshooting capabilities that can help you recover much of the visibility lost when Orion was shut down.
This blog was written to give you guidance that can be acted on quickly; to produce maximal outcomes with minimal cost and effort. Chances are good that, if you are reading this post, then you already have Splunk within your environment and that you already have Universal Forwarder deployed to your most critical infrastructure. So with that in mind, we wanted to provide the following immediately actionable steps to help manage the risk created by the Sunburst Backdoor:
- Detect and defend against the “Sunburst Backdoor” attack
- Configure Splunk to collect, visualize and monitor host infrastructure
- Configure Splunk to collect, visualize and monitor network infrastructure
- Expand monitoring to include applications
Detect and Defend Against “Sunburst Backdoor”
As with any cybersecurity threat or attack, detection, containment and mitigation is of the highest priority. Splunk’s security experts are diligently working to provide guidance to help detect activity from, and protect your network against Sunburst Backdoor malware. Check out the blog post, "Sunburst Backdoor Detections in Splunk," for more information.
Prerequisites and Assumptions
Through the rest of this blog, we’re going to make some assumptions about your environment; resulting in some guidance and detail not being covered in this blog. We’re assuming you already have access to a Splunk environment where you can send data. We’re assuming that most or all of the infrastructure you’d like to monitor already has the Universal Forwarder installed. Finally, we’re assuming that you have access to a Splunk administrator or Splunk team that has a decent understanding of how to manage and deploy new configurations via the deployment server or other methods and can help deploy the changes outlined in this blog.
Collect, Visualize and Monitor Host Infrastructure
In this section we’ll cover the steps necessary to allow you to:
- View CPU, disk, memory and network utilization across every Linux and Windows host in your environment
- Search logs and events on a host to more quickly investigate an incident
- Alert when CPU or memory utilization rises above 95%
- Alert when a host is no longer sending data to Splunk
- Alert when a critical process is not running
Configure Data Collection
As always, the first step is getting the necessary data into Splunk to visualize and monitor our hosts. We’ll use the Windows and Unix/Linux Add-Ons to collect information for each host. If needed, configuration of these add-ons is covered comprehensively in the “Apps and add-ons” section of our documentation, and we’ve also linked out to a brief video tutorial covering the basics of getting Windows and Linux data into Splunk. Finally, we’ve linked to example inputs.conf configurations for Windows OS Metrics and Events as well as Linux OS Metrics and Events which you can deploy to the Universal Forwards to effectively monitor your host infrastructure.
Visualize Data
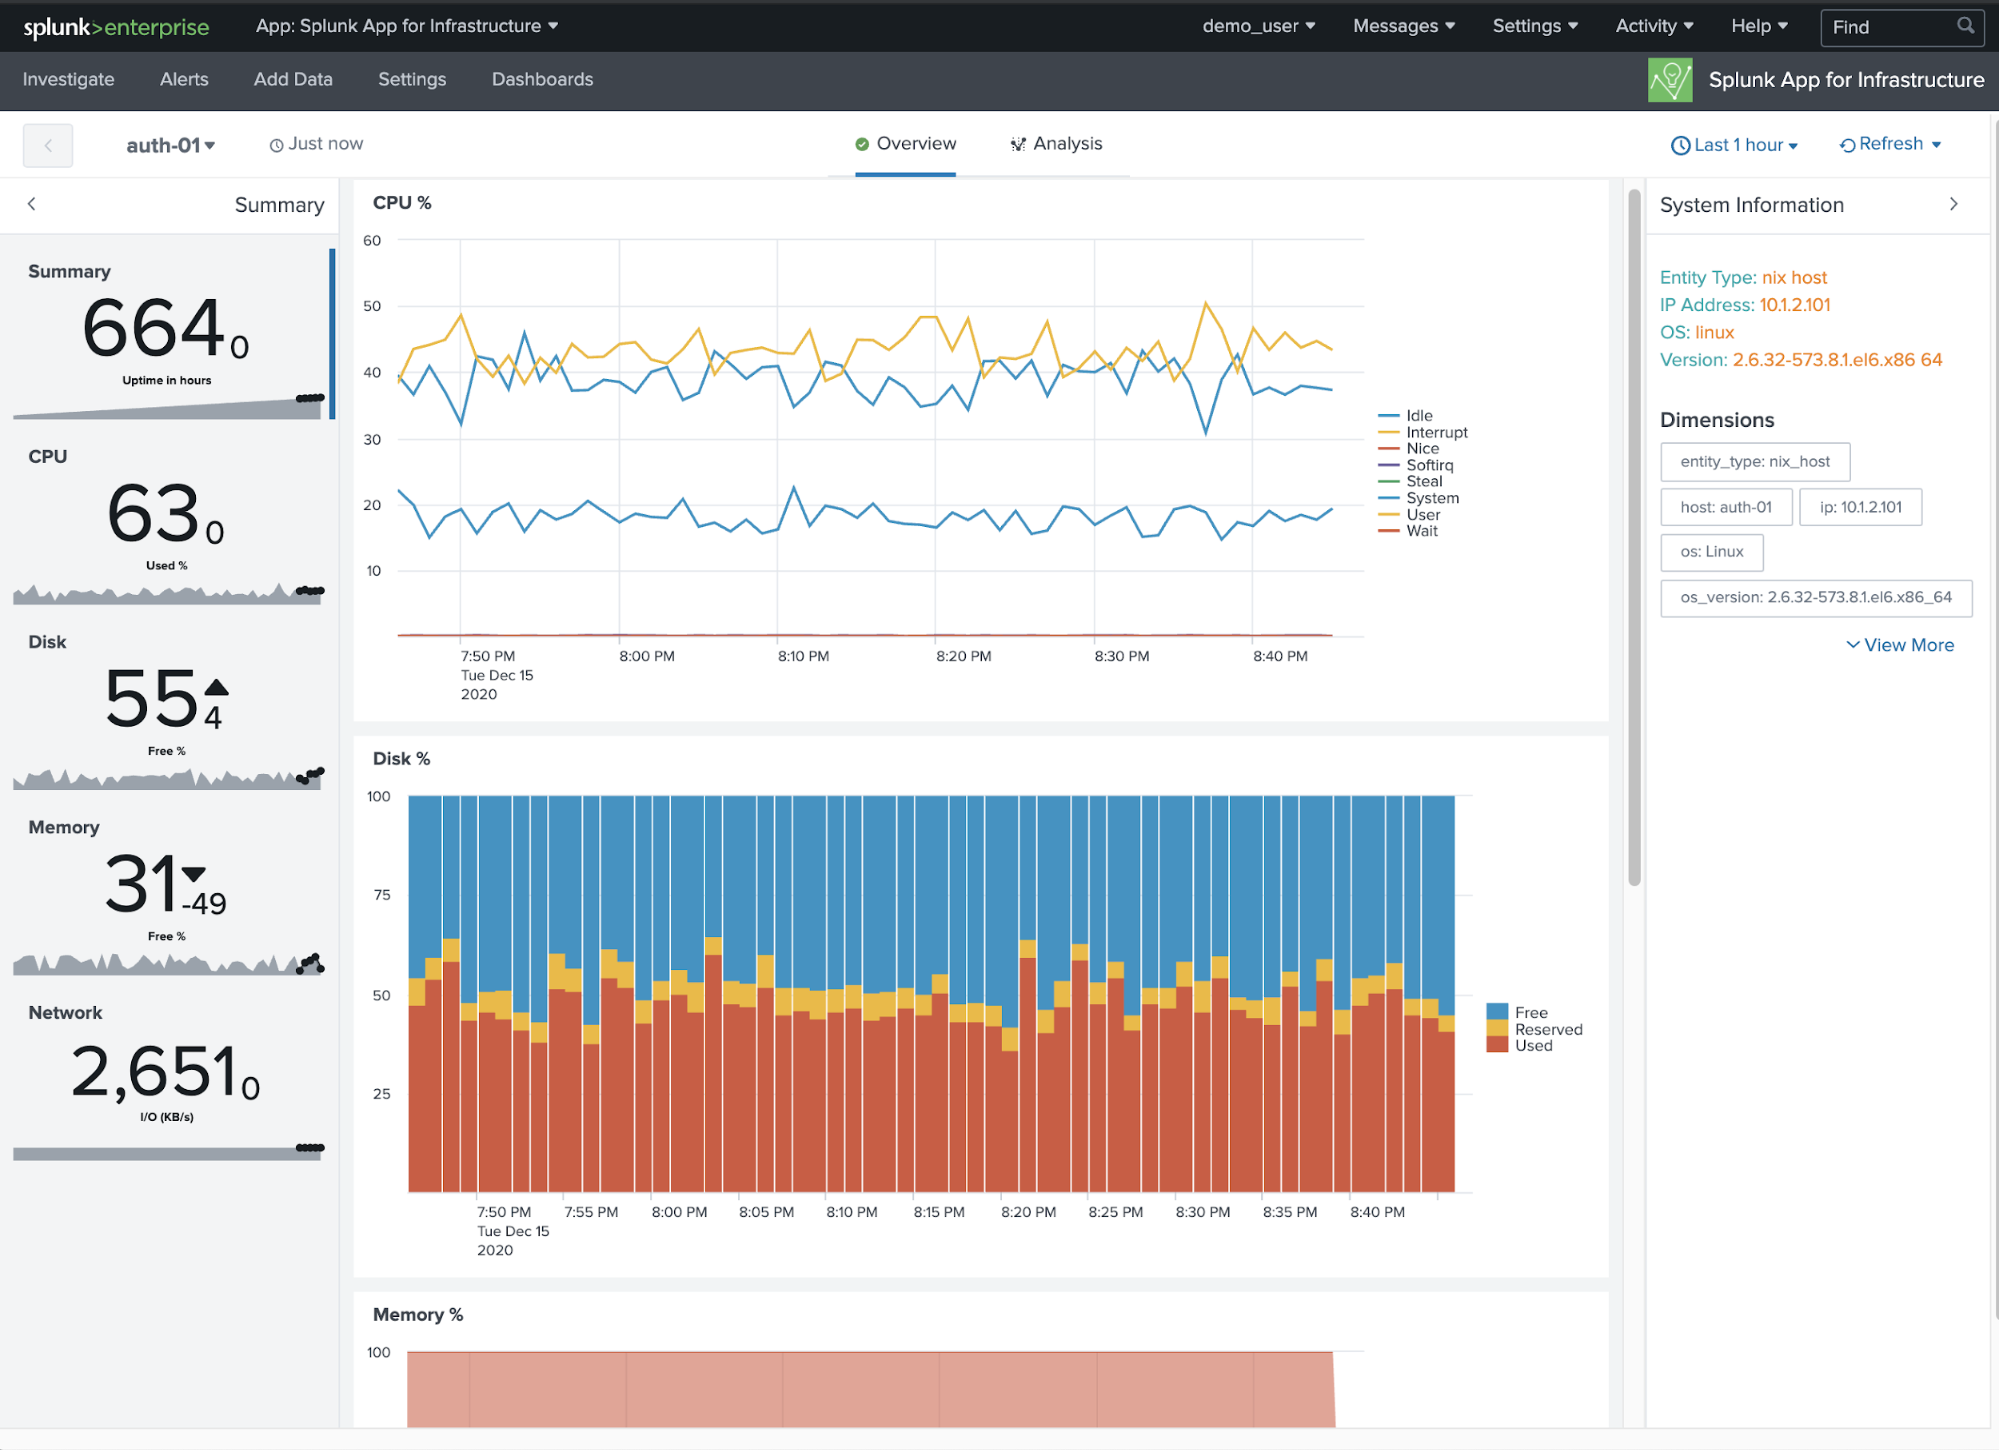
View CPU, disk, memory and network utilization across every Linux and Windows host in your environment.
In the free Splunk App for Infrastructure (referred to going forward as SAI), you can quickly view the health of your entities within the Investigate pane tiles view. You can filter down to specific hosts or leave all entities. In this example, we have color by cpu.system which is an indicator of cpu utilization for Windows or Linux hosts. You can also set a specified threshold for cpu.system within this view and see the tiles light up red when a host exceeds that value.

To visualize all core metrics for a specific host, simply click on the host tile. For example, auth-01.

Search Logs and Events on a Host to More Quickly Investigate an Incident
While metrics help you isolate which hosts are having problems and when those problems began, it’s often the logs and events which contain information needed to get to the true cause of the issue. Use Splunk to isolate logs and events coming from the host and look for any common indicators of trouble such as “error” or “failed”, etc.
index=* host=* sourcetype=* (error OR fail*) |

Monitor and Alert
Alert When CPU is High
High CPU utilization can be an indication that the host is having problems. If your system is being over-utilized, it does not have enough capacity for the CPU demand. Use metrics to detect heavy CPU usage before it impacts system performance, then alert when that metric exceeds a specified threshold.
Note: This procedure can be modified to alert on disk utilization and memory utilization. Use the search below to see all metrics available in your metrics indexes.
| mcatalog values(metric_name) WHERE index=* |
In this example, we will use % Processor Time as our metric for detecting high CPU utilization with a threshold of 95%.
| mstats avg(_value) prestats=true WHERE metric_name="Processor.%_Processor_Time" AND index="em_metrics" AND instance="_Total" span=1m BY host
| stats avg(_value) as cpu_usage BY host
| eval Critical_Usage = if(cpu_usage > 95, "Yes", "No")
| table host Critical_Usage cpu_usage
| where Critical_Usage="Yes"
Save as an alert and customize the trigger actions.

Alert When Critical Process is Not Running on the Host
When monitoring overall health of a host, you will want to monitor and be alerted when a critical process has suddenly stopped running so you can quickly recover to a working state. In this example, we are using windows and metrics collection to detect if a process was running in the last 60 minutes, but not in the last 10 minutes.
| mstats count WHERE metric_name="Process.Elapsed_Time" AND index IN (*) host IN (*) instance IN ("listCriticalProcessesHere") BY host instance span=1m| stats sparkline(count, 1m) as trend count min(_time) as earliest_time max(_time) as latest_time by host instance
| eval minutes_since_last_reported_event = round((now()-latest_time) / 60, 0)
| eval alive = if(minutes_since_last_reported_event < 11, "Yes", "No")
| convert ctime(earliest_time) as earliest_event_last60m ctime(latest_time) as latest_event_last60m
| table host instance alive minutes_since_last_reported_event trend count
| where alive="No"

Alert When Host is Not Sending Data
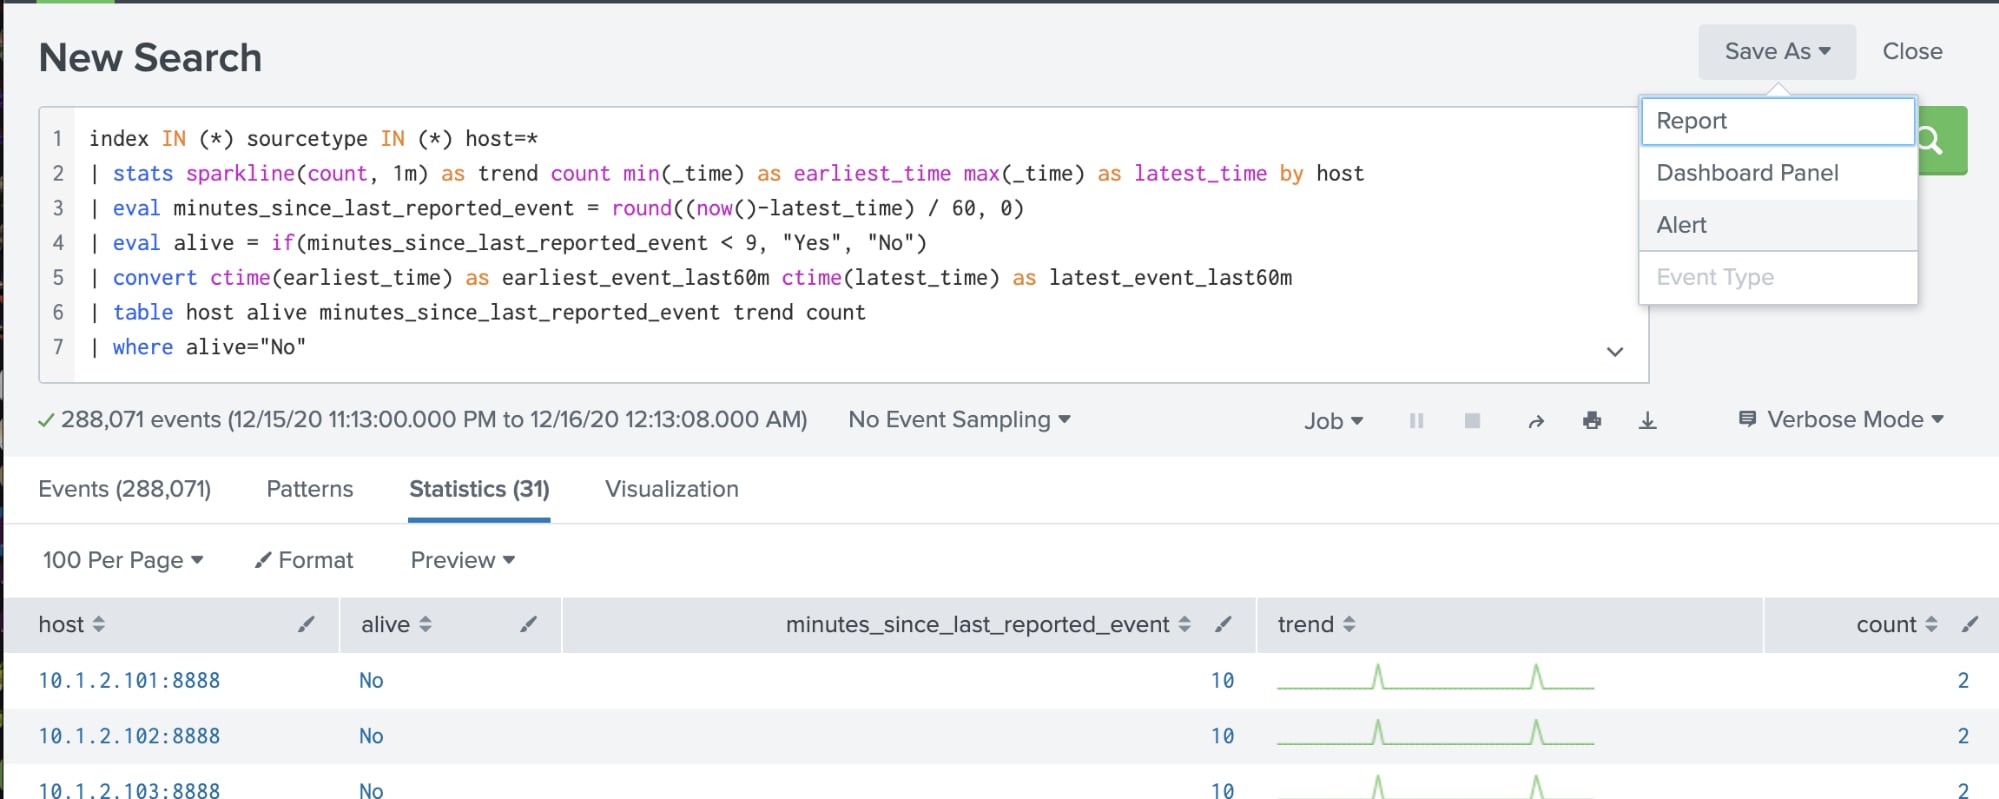
The most basic form of infrastructure monitoring is validating that the host is up and generating an alert when it is not. There are several approaches to host availability monitoring, but Splunk’s approach is to run a “heartbeat check” for a critical metric and alert if the metric stops reporting. If so, either the agent is failing to send data, or the host is offline; both problems require attention.
| tstats count where index IN (*) sourcetype IN (*) host=* by host _time span=1m
| stats sparkline(sum(count), 1m) as trend sum(count) as count min(_time) as earliest_time max(_time) as latest_time by host
| eval minutes_since_last_reported_event = round((now()-latest_time) / 60, 0)
| eval alive = if(minutes_since_last_reported_event < 9, "Yes", "No")
| convert ctime(earliest_time) as earliest_event_last60m ctime(latest_time) as latest_event_last60m
| table host alive minutes_since_last_reported_event trend count

Collect, Visualize and Monitor Network Infrastructure
SolarWinds is often used as a syslog receiver, log analyzer and network traffic monitoring solution. Splunk can help with taking on these capabilities and is one of the quickest way to reestablish the data flow from the various network components throughout your network. The goal is to regain basic visibility into those devices by redirecting syslog traffic and SNMP traps to Splunk for further analysis.
In this section we’ll cover the steps necessary to allow you to:
- Get an inventory of all devices reporting data
- Search syslog for problems associated with a specific device
- Alert when a network device goes down
- Collect and alert on specific network traps
Configure Data Collection
The first step to regaining visibility is getting the necessary data into Splunk to allow us to visualize and monitor our network devices. In this section, we’ll cover the configuration changes needed to collect network syslog and SNMP traps into Splunk.
Because it is Splunk’s best practice, we recommend deploying Splunk Connect for Syslog (SC4S) for syslog data collection; however if you are comfortable with other methods of syslog data collection, those will work as well. Configuration of SC4S is covered comprehensively in this documentation, and we’ve also linked out to this two part blog series (Part 1, Part 2) and this amazing .conf talk which covers the basics of getting started with SC4S.
If possible, we recommend fronting SC4S with the same IP address that SolarWinds was using to collect syslog traffic. This will help prevent the need to reconfigure all network devices and firewall rules that would be necessary to allow syslog traffic to flow to a new syslog receiver.
To collect SNMP traps in Splunk, you will need to run an snmptrapd server on a Linux or Windows machine to collect traps and write them to a file. Once written to disk, you can configure the Universal Forwarder to read those files and forward them to Splunk; this configuration is outlined here in our documentation. This approach was also covered in more detail in the first half of this step-by-step blog post. (Note: The second part of the blog covers ingesting traps into Splunk IT Service Intelligence, which is not required for the networking visibility covered in this blog.)
Visualize Data
Get an Inventory of All Devices Reporting Data
Obtaining an inventory of every device on the network is fundamental to network visibility and management. It sets the stage for availability monitoring and alerting should devices stop sending data.
Note: To further restrict your search, limit the search to include only the indexes and sourcetypes associated with your networking devices
index IN (*) sourcetype IN (*) sc4s_vendor_product=*
| stats count by host, sourcetype, sc4s_vendor_product
Search Syslog for Problems Associated with a Specific Device
If you suspect a particular device is having issues, there will often be evidence of a problem resident in the syslog messages. Use Splunk to isolate syslog messages coming from that device and look for messages with elevated severity.
Note: To further restrict your search, limit the search to include only the indexes and sourcetypes associated with your networking devices. Add the host or IP of the device you want to investigate.
index IN (*) sourcetype IN (*) host=<Hostname/IP of Device> (severity_name IN (emergency, alert, critical, error, warning) OR sc4s_syslog_severity IN (emergency, alert, critical, error, warning)) |
Monitor and Alert
Alert When a Network Device Goes Down
Losing a networking host in the environment is obviously a problem which we need to detect and alert on. By using the presence of syslog data as a “heartbeat” of the host’s presence, we can configure Splunk to alert when a host that was previously sending data is no longer reporting.
Note: The following search will return hosts who have seen data within the last 60 minutes, but no data in the last 10 minutes. These values can be adjusted to fit your needs, To further restrict your search, limit the search to include only the indexes and sourcetypes associated with your networking devices.
index IN (*) sourcetype IN (*) sc4s_vendor_product=* |

Expand Monitoring to Include Applications
While we wanted to focus the majority of our guidance toward host and network infrastructure monitoring, we know that monitoring the applications that run on top of your infrastructure is equally important. Much of the same application monitoring available in SolarWinds can be accomplished using the same techniques we discussed above by first collecting the data followed by visualization and alerting. Splunk’s Splunkbase app store has hundreds of pre-built applications that you can install to help collect, visualize and alert on application data from some of the most prevalent applications and infrastructure. While it’s impossible to call out each one we believe you should check out, we did want to bring up some of the most popular application and infrastructure monitoring Splunk apps for you to explore:
- The Splunk App for Windows Infrastructure
- The Splunk App for Active Directory
- The Cisco Networks App for Splunk
- Splunk App for Network Streams
- Splunk Database Connect
Wrapping It All Up
During a crisis, time is of the essence; and our goal was to provide you with some guidance that you could execute immediately to recover from lost IT Infrastructure visibility. Under normal circumstances, we would suggest a more mature approach to infrastructure monitoring; however, given the circumstances, we opted for an approach that is fast and easy to implement and would best leverage your existing Splunk deployment.
At Splunk, our No. 1 priority is your success and we are here to help. If after reading this blog you feel like you need additional support, we’ve got you covered. We’d recommend that you reach out to your Customer Success Manager, Sales Engineer, or Splunk Account Manager if you need immediate assistance with the recommendations above.
Related Articles
About Splunk
The world’s leading organizations rely on Splunk, a Cisco company, to continuously strengthen digital resilience with our unified security and observability platform, powered by industry-leading AI.
Our customers trust Splunk’s award-winning security and observability solutions to secure and improve the reliability of their complex digital environments, at any scale.


