At Last: Easy, Actionable, and Scalable Alerting in ITSI

Howdy Splunkers, I’m back and this time I’m packin’ a serious punch. I’m so excited to announce the availability of my new IT Service Intelligence (ITSI) Content Pack for Monitoring and Alerting.
For those of you who are already familiar with either my blog series on this topic, "A Blueprint for Splunk ITSI Alerting," or my .conf19 talk, "A Prescriptive Design for Enterprise-wide Alerts in IT Service Intelligence," you’ll be happy to hear that this content pack is more or less a pre-built version of that design; with of course, more bells and whistles!
For those of you who aren't yet familiar with my blog post or .conf talk, you might be wondering what all the fuss is about. No worries, we’ll cover it here at a high level. You might also consider quickly reviewing the .conf talk and blog series for more details.
What's the Problem?
So you've built out your ITSI services and KPIs and the Service Analyzer is lighting up like a Christmas tree. You’ve carefully thresholded your KPIs so that services are turning red when things are unhealthy and staying green otherwise. All is well, right?
Now it’s time to take action and alert someone when things start to go wrong. How do you plan to do that? The following diagram briefly outlines how to produce actionable alerts from ITSI services and KPIs:

The grey boxes represent configurations that you as the ITSI administrator are required to define. So what should you do? Create a multi-KPI alert? Configure a correlation search? Use the new KPI alerting functionality?
How do you configure your notable event aggregation policy to group related notable events? Do you take action on the first critical notable event you see? Do you alert on poor performing KPIs? Or do you only alert when the service health score goes critical? These are just some of the questions you’ll likely be asking yourself as you prepare to configure actionable alerts.
If it makes you feel any better, these aren’t easy questions to answer. And you’re not the only one asking them. That’s exactly why I've created this content pack. It contains pre-built correlation searches and aggregation policies that you can simply enable, and presto! Actionable alerts. Ok ok… it’s not exactly that easy, but it’s close.
What's the Solution?
Splunk IT Service Intelligence (ITSI) content packs provide out-of-the-box content that you can use to quickly set up your ITSI environment. The Content Pack for Monitoring and Alerting addresses the problem described above by providing you with preconfigured settings for service monitoring and alerting as illustrated in the following diagram:

At the heart of the content pack are the following service monitoring correlations searches, notable event aggregation policies, and episode monitoring correlation searches that you can simply enable:
| Object | Description |
|---|---|
| Service monitoring correlation searches | These correlation searches routinely check service and KPI results written to the itsi_summary index and produce notable events based on a variety of noteworthy circumstances related to service and KPI health. For more information about these correlation searches, see About the correlation searches in the Content Pack for Monitoring and Alerting. |
| Notable event aggregation policies | These policies provide configuration for grouping related notable events together in useful ways. The policies also contain action rules that you can tune to meet your organization's alerting strategy. For example, some action rules produce emails, create service tickets, or integrate with VictorOps or other incident response platforms. For more information about these aggregation policies, see About the aggregation policies in the Content Pack for Monitoring and Alerting. |
| Episode monitoring correlation searches | These correlation searches routinely inspect open episodes and produce alerts based on a variety of noteworthy circumstances related to that episode. For more information about these correlation searches, see About the correlation searches in the Content Pack for Monitoring and Alerting. |
Yeah… Yeah… Yeah… What Does This Get Me?

After installing the content pack, go to the correlation searches lister page and enable a small handful of the pre-built correlation searches that come with the content pack.

In doing so, the system automatically detects and creates notable events for these specific noteworthy circumstances. I’ve also chosen to group together the notable events across multiple services since they're all ultimately tied to the Buttercup Tech stack.
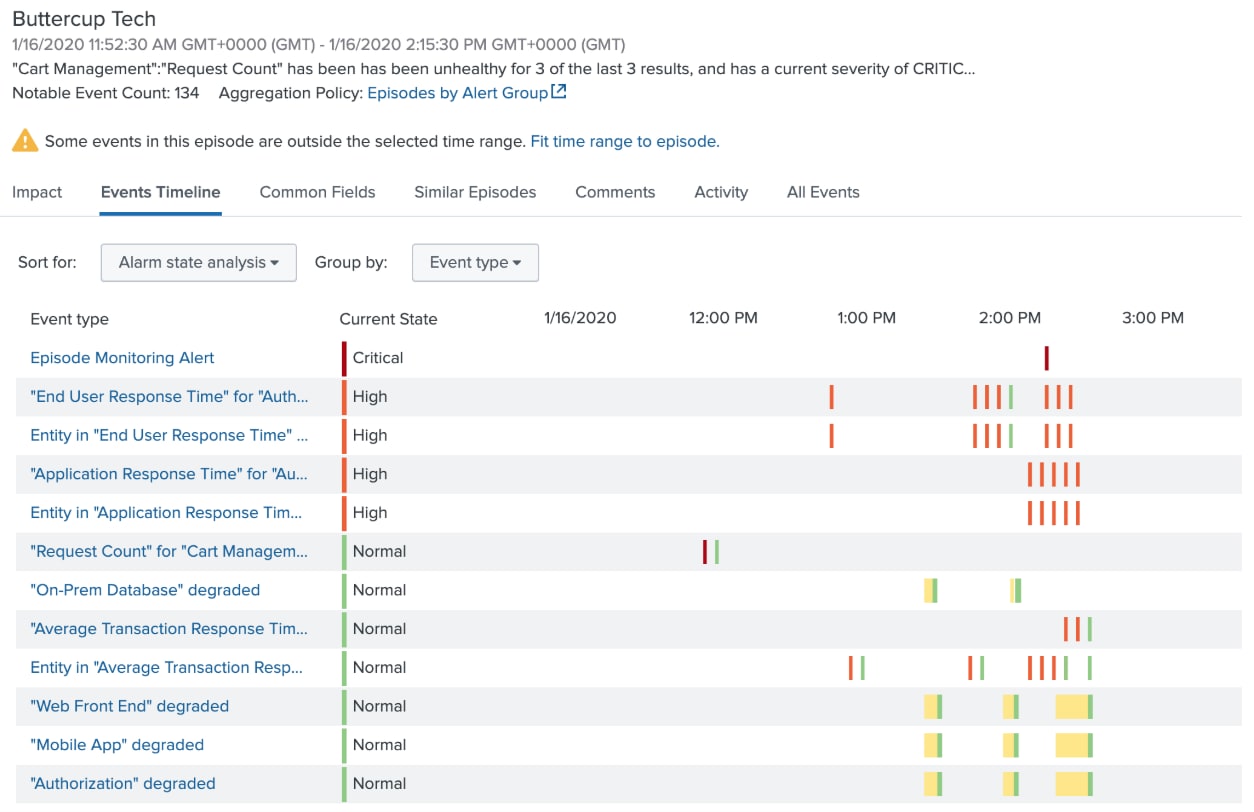
As a service degrades, notable events are automatically created and grouped together in Episode Review. Notice the special Episode Monitoring Alert event at the top. This event is created only after the system has detected a concentration of high and critical notable events in a short period of time. This alert is configured in the notable event aggregation policy to take action once created. Talk about a smarter alert!

Alright I’m In, How Do I Get Started?
Listen, I know… you don’t like to read the installation instructions. Neither do I. But we all have to eat our vegetables every now and then. Skipping installation and configuration steps in the documentation will result in sadness. For instructions on how to get set up and running, see Install and Configure the Content Pack for Monitoring and Alerting in the Splunk ITSI Content Packs manual. You'll see it's as easy as 1, 2, 3… 4, 5.
I Have Questions, Comments, or Concerns. What Should I Do?
Lucky for you, I care… a lot! Your feedback is the secret sauce in the recipe for the success and value of this content pack. If something doesn’t work for you, it probably doesn’t work for others either. Similarly, if something works great, I’d love to know. I’m a sucker for kudos.
If you want to connect with me to discuss something, your best bet is to reach out to your account team and ask them to request a meeting. If that doesn’t work for you, connect with me on LinkedIn and be sure to include a brief reference to this blog post or the content pack. Otherwise I’ll think you’re a recruiter and ignore you. :-)
I truly hope you find this content pack valuable, and as always… Happy Splunking!
Related Articles
About Splunk
The world’s leading organizations rely on Splunk, a Cisco company, to continuously strengthen digital resilience with our unified security and observability platform, powered by industry-leading AI.
Our customers trust Splunk’s award-winning security and observability solutions to secure and improve the reliability of their complex digital environments, at any scale.


