Turn IoT sensor data into Operational Intelligence for logistics

The Internet of Things (IoT) wave may impact businesses and industry verticals differently but with the same potential: IoT opens new doors to interesting use cases that have immediate business impact and value. Splunk has delivered Operational Intelligence and Analytics in IT and Security for years, so why not apply Operational Intelligence and Analytics to IoT?
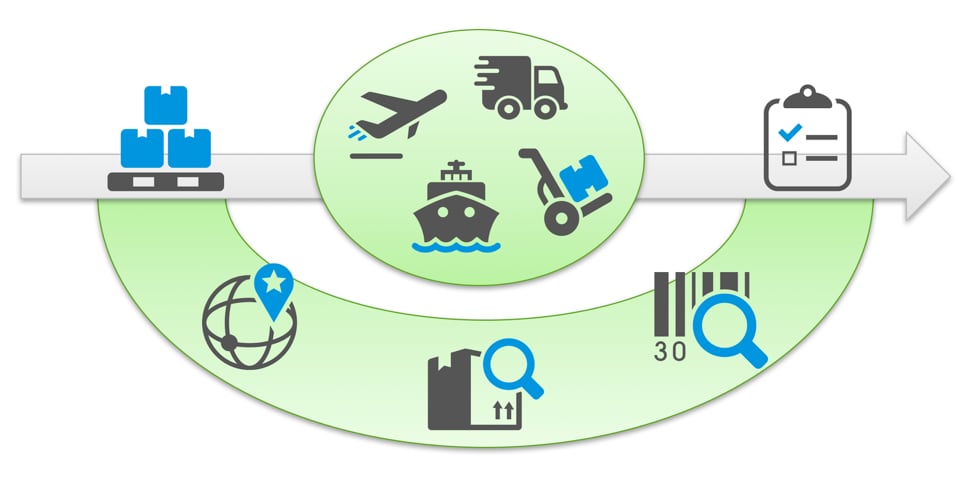
 Referring to the general definition of IoT we consider an object that is connected to the internet, in our case data coming from a sensor which measures acceleration. One use case I want to walk through here is not new to logistics, but a great example to show the value in IoT. As the diagram above depicts the globalized delivery of goods takes place in a complex, interconnected network the process is often hard to understand.
In our example we refer to a (simplified) delivery process that we can capture with sensor data. Using this data we can get visibility of the process and can further enrich with all types of other data that add necessary context information to have the full visibility of goods. Imagine your “just in time” business depends on the delivery of high quality goods but you face the challenge that some of them were damaged during transport (maybe due to improper handling). The information that tells you when, where and why such incidents happen can massively improve our service quality and ultimately customer satisfaction. On top of that, imagine we can be notified about anomalies in real time and thus know about issues before the actual delivery.
OK, sensor data. Let’s get started.
If we want to track whether our goods were damaged during delivery, we can attach some sensor device on the packaging, e.g. a Thingsee (there’s a nice Splunk App available for it), a Bosch XDK device or sensors from LP Research – just to name a few of them. These devices have sensors onboard that provide us with information such as accelerometer data which can be used to detect impacts.
What does this kind of sensor data look like? Basically, it’s time-series data of the sensor measurements, in our case acceleration on three spatial axis X, Y, Z. If we do a quick, first pass data exploration we might end up with some stats and plots like this on a Splunk Dashboard. On the left we have the raw data and some summary statistics. On the right we used a 3D scatter plot custom visualization with a clustering algorithm to separate higher accelerations (yellow dots) from the majority of more stationary measurements (blue dots).
(Click to enlarge)
This first pass at analytics might be good for an overview but what else can we find out? Let’s plot our sensors over time and see what our data looks like.
(Click to enlarge)
We have notable impacts on the Y and Z axis while X seems not too bad. As we want to detect impacts from this data we now definitely have an idea that there are impacts, but how do we spot them and ideally spot them automatically?
In this case we can aggregate the signal data and combine it with the acceleration of all three axis to get a new numeric feature that we can further use, e.g. for anomaly detection. So we calculate the sum of absolute deviations normalized to each axis stationary value (roughly the average of all values on each axis). This new feature is ready to be used for anomaly detection. In part 2 of this blog series (on Monday) we will explain how to detect IoT anomalies automatically and help to discover geospatial patterns for data driven insights in logistics.
Follow @phdrieger
Follow @SplunkDE
Related Articles
About Splunk
The world’s leading organizations rely on Splunk, a Cisco company, to continuously strengthen digital resilience with our unified security and observability platform, powered by industry-leading AI.
Our customers trust Splunk’s award-winning security and observability solutions to secure and improve the reliability of their complex digital environments, at any scale.


