The Hidden Side of Observability

Let’s face it, everything is “observability” these days. You need more budget to modernise your toolset, just say the magic word ”observability”. The budget is approved, so now you have an observability project. You start searching for a solution and quickly realize that every single vendor uses the same wording and offers the same solutions… “we collect metrics, traces and logs, using OpenTelemetry and our backend offers APM, Infrastructure Monitoring, Real User Monitoring, Synthetic Monitoring etc etc”. Sounds familiar? Did anybody say “observability-washing?”
But not all solutions are created equally. In fact, they are very different once you look behind the (architectural design) curtain. They have very different architectures and don’t collect data in the same way. I’ll try to explain why not all solutions are the same, in particular for organizations using modern approaches like microservices and containers (but not limited to, this works the same way for on-prem classic 3-tier apps).
Vendors Have (VERY) Different Architectural Designs
Let’s start with the architectural design. In the cloud-native world, everything moves very fast. Containers or functions are created, and they crash and restart or get deleted super fast. That’s why you need a solution that can keep up with this new pace. Who cares? Well, your users care. According to a 2016 Google study, you could lose up to 53% of your customers if your transactions took longer than 3 seconds. Now imagine that in 2023?! Not only is speed important to avoid losing revenue, but it can also generate revenue. Another study by Deloitte shows that in some industries like retail, a 0.1-second improvement in your mobile app performance can result in an increase in average order size by almost 9%. Last but not least, if your site is too slow and not reactive enough (= not compliant with Google Core Web Vitals) you could be spending millions of dollars on SEO and still not be ranking at the top of Google.
So yes, seconds matters, even milliseconds. This means you need near real-time solutions. You must know that after 3 seconds you have lost customers. You need to know if there is a memory leak on container X before Kubernetes restarts it to make it “up and running” again.
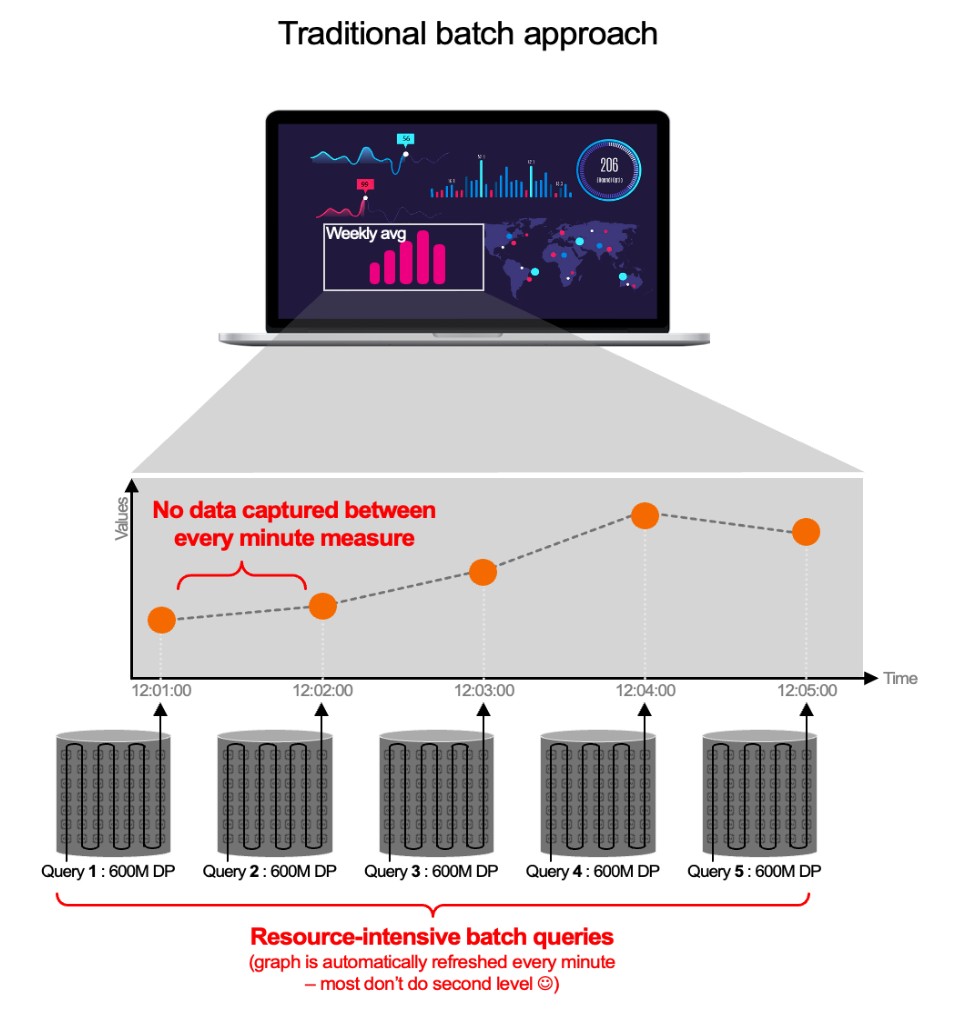
“Is that really a problem though? The vendors I talked to said they only need 15 seconds to collect telemetry data, metrics etc… that should be good enough”. But it isn’t enough. Because they don’t tell you what happens next. Collecting data in 15 seconds and storing it in a time series database (TSDB) is easy. But it’s also useless. At the moment you only have data that costs you money but doesn't provide any added value (no alerting, no reporting, no analysis, nothing…). In fact, to “make use” of those metrics and traces etc most vendors will use a batch to query this database, and that takes a lot of time (often a minute or more). This means that your alert will not show in 15 seconds, but in 75 seconds instead! In summary, this “traditional” batch approach means:
- You need to wait for the data to settle before you can make a query
- The queries are slow due to the batch approach (usually configured with 1mn or 5mn precision in most IT solutions)
- This means a huge volume of data points per query response time
- They cannot handle the explosion of container metadata (due to container churn, and because these solutions were built before the cloud-native era)
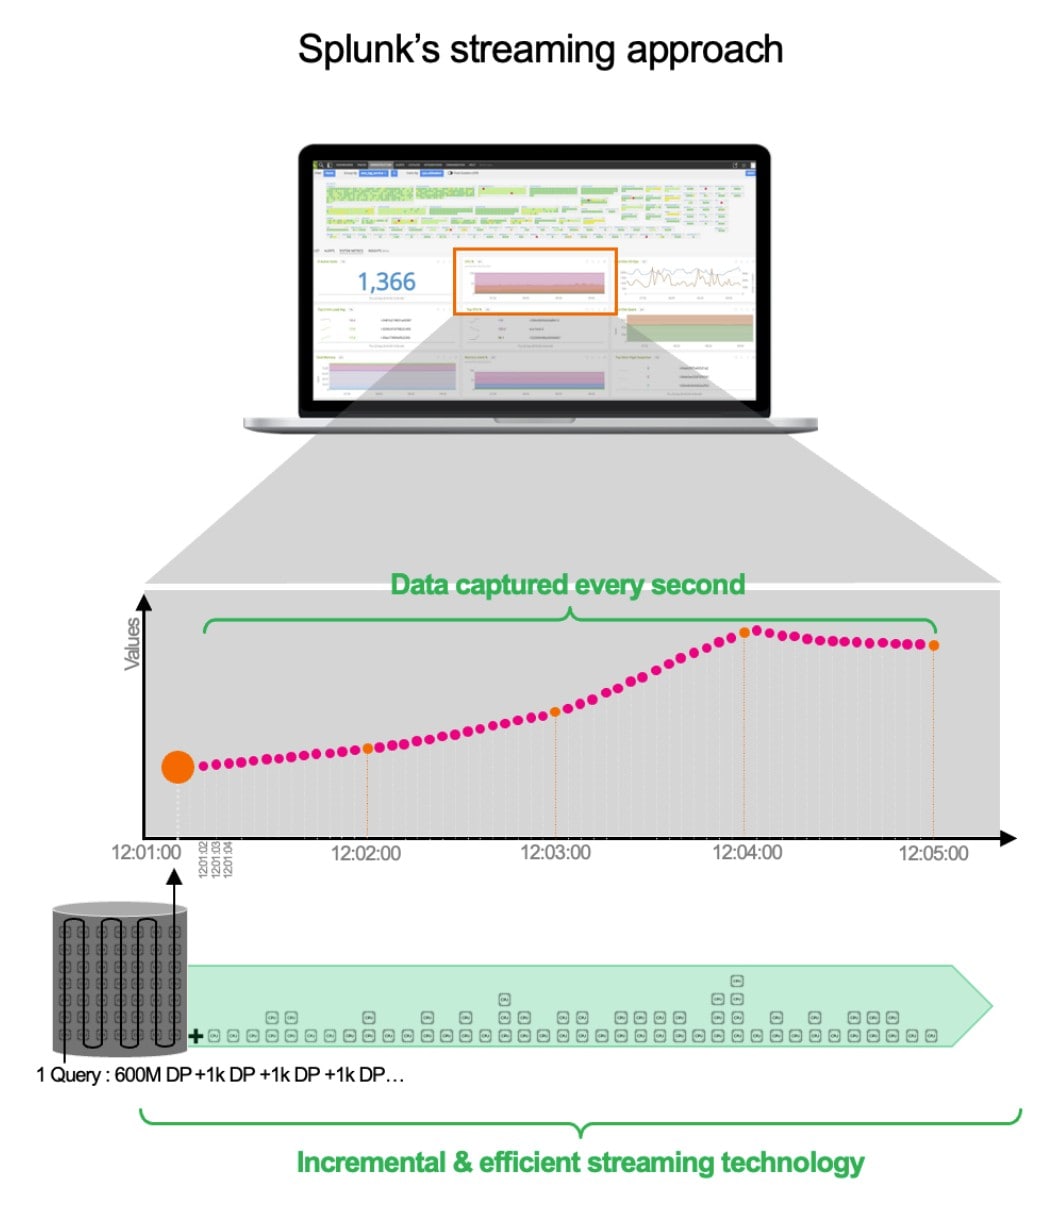
 Let’s take an example: “I want the CPU for my 1000 containers cluster for 1 week at a resolution of 1 second“, that means 600 million data points (604800 seconds/week x 1000) need to be analysed to generate a single graph (the CPU).
The traditional approach means that the observability solution must generate a query every minute that collects 600 million data points. Not only that but because a batch is used every minute, your environment is “unobservable” for 59 seconds!
This happens for every graph (memory, IOPs…) in a dashboard, every user etc. That's why you have to handle many 600M data point queries, which are not suitable for modern environments like containers.
Splunk Architectural Design
At Splunk, we decided to use a streaming architecture. Of course, when the service starts, we also need to fetch the first 600M data points, but we will not generate a new large query a minute later. Our query remains. We simply update it every second with the new data (in increments of 1K data points ). Not only is it more efficient and much more scalable and faster, but it also guarantees you to capture everything, from impatient customers to functions with memory leaks etc. But it doesn’t stop there. It gets even better. Do you need to change the view? Do you want to average the total? Don’t worry we precalculate some data in the backend for even more efficiency.
 The Splunk streaming architecture allows:
- Fine grade detection with a resolution of 1 second Faster MTTD/MTTR - alerting occurs before other solutions even detect the incident (add automation and you can resolve issues in seconds)
- We pre-aggregate every series while we ingest it for lightning-fast visualisation
- All calculations are performed in the backend, so there is no overhead for your environment
- Our queries are persistent, incremental and not repeated. This makes it the best solution for containers and serverless (but not limited to) with hundreds of thousands of concurrent queries.
- Results: Only 2 to 3 seconds latency between ingesting and alerting vs 1mn mini for existing solutions: 3000% more efficient alerting.
Vendors May Have Different Ways Of Supporting OpenTelemetry
OpenTelemetry (OTel) is becoming the de facto standard for collecting telemetry data… It’s open source, not a black box like any proprietary vendor agent, and lightweight. This means you can use a single agent to collect observability data (metrics, traces and logs), and process it (transform, filter, anonymise…) before sending it to any observability provider backend that supports OTel. Cool, isn’t it? Do you use an OTel agent and would like to change the backend provider? Do you want to change your APM? No problem, send the data to the new provider and you’re done. It’s free and saves resources across your entire environment.
If you want to know more have a look at https://opentelemetry.io/ .
OTel is the new kid on the block, so everybody wants and needs to support OTel. But again… supporting doesn’t mean you are OTel-native. Just be aware that some observability solutions that support OTel will require you to add their proprietary agent if you want to take advantage of any fancy feature their backend offers.
At Splunk, we decided to be fully OpenTelemetry native, without having to use our existing Universal Forwarder Agent (you can if you already have it, but you don’t need to at all). In fact, Splunk is heavily involved in the project (among others, like Microsoft, Lightstep, AWS, and Cisco…or organisations like Shopify, and Uber… ) and we just released our zero-configuration for the Otel Collector which allows you to automatically search what services are running in your environment and decide if they need to be instrumented by the OTel agent without any manual work.
In conclusion, yes everybody does observability… we just do it differently ;)
Related Articles
About Splunk
The world’s leading organizations rely on Splunk, a Cisco company, to continuously strengthen digital resilience with our unified security and observability platform, powered by industry-leading AI.
Our customers trust Splunk’s award-winning security and observability solutions to secure and improve the reliability of their complex digital environments, at any scale.


