Setting up and Understanding OpenTelemetry Collector Pipelines Through Visualization

Observability provides many business benefits, but comes with costs as well. Once the (not-insignificant) work of picking a platform, taking an inventory of your applications and infrastructure, and getting buyin from leadership (both from the business and engineering sides of the house) is done, you then have to actually instrument your applications to emit data, and build the data pipeline that sends that data to your observability system.
OpenTelemetry is the industry-standard for getting observability-related telemetry data into a backend observability platform. One of the things that we hear from users of OpenTelemetry is that it can sometimes be difficult to understand exactly how their pipelines are set up, or to get a visual understanding of how data flows from their applications to the observability backends based on the configuration. Additionally, YAML configuration as used in the OpenTelemetry collector configuration is whitespace-sensitive and otherwise has a few quirks that can make it difficult to verify at a glance.
To help with these issues, the OpenTelemetry community has come to action with a great tool called OTelBin. With this (free and open-source) tool, you can not only visualize what your pipelines look like and see how each of the main signals flows through the collector, you can also get a syntax-highlighted, validated, YAML-linted version of the configuration in the same place. You can even validate your configuration against what components and config options are supported by several of the leading observability vendors, including against Splunk’s distribution of the OpenTelemetry collector (thanks to Splunker Robert Castley for submitting the PR needed to get this support added!)
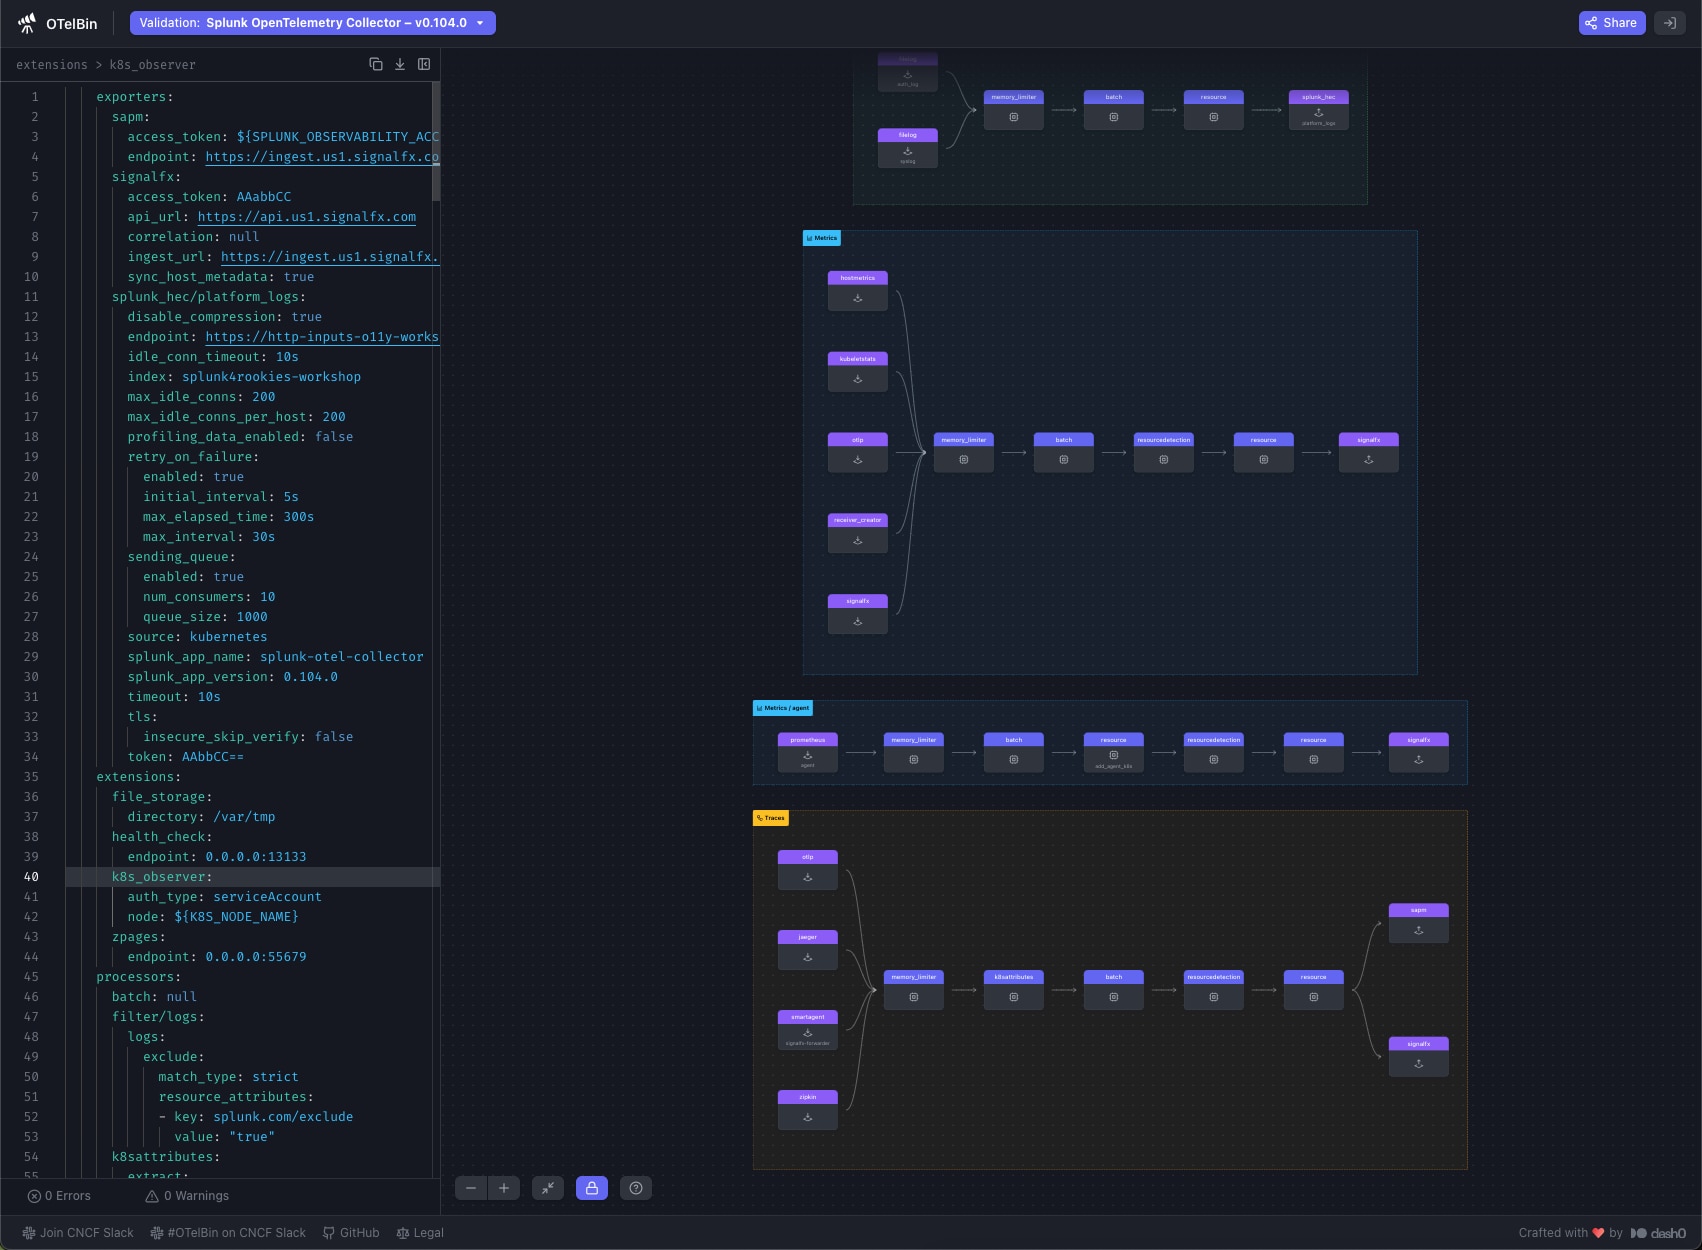
Here’s a screenshot of what OTelBin can do. Notice that the config file is shown on the left and the resulting pipelines are visually represented on the right.

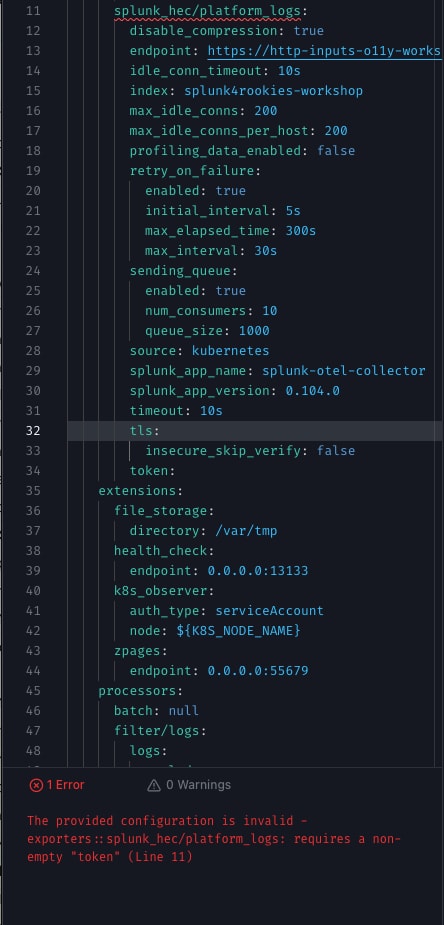
You’ll also notice the dropdown at the top of the screen letting you pick what distribution you’re using, letting you validate that all the components in your pipeline are supported by that distribution, and even detecting some common errors. For example, one common error is forgetting to supply an access token when setting up an exporter. OTelBin lets you see that easily:

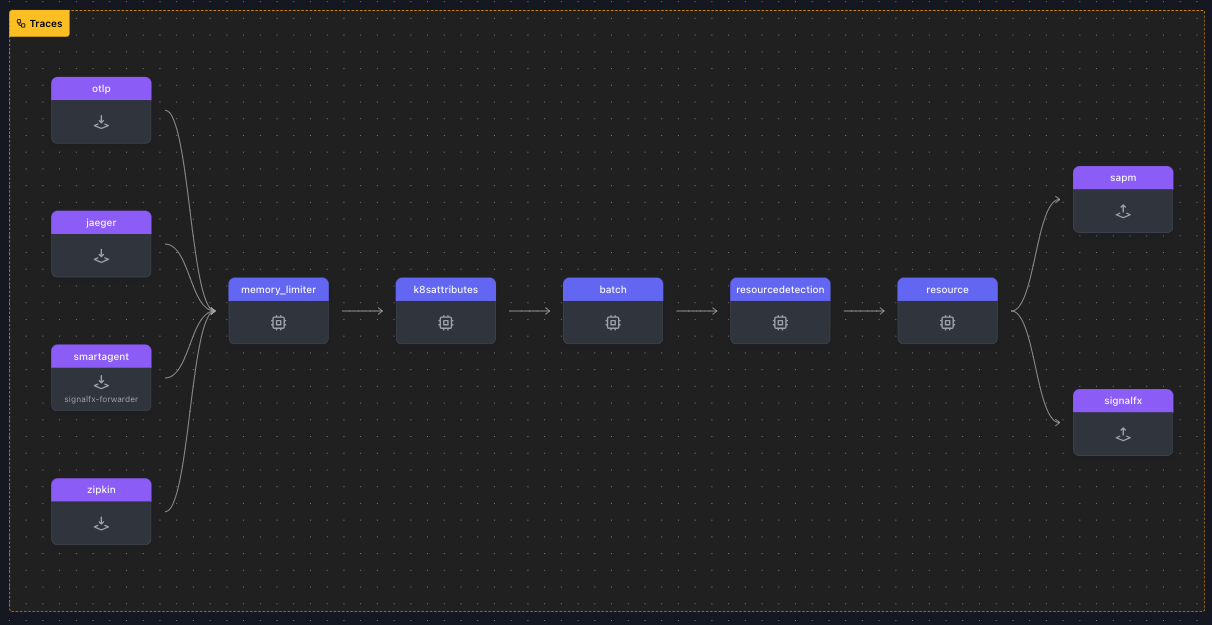
Finally, let’s take a look at the closeup of a pipeline visualization:

In this example, you can see at a glance that for traces there are 4 receivers, 5 processors, and 2 exporters. Even though the config used to generate all the pipelines in this example is 482 lines long, you can easily determine where data is coming from, how it’s being processed, and where it’s going.
OTelBin also lets you generate shareable URLs, great for asking for help setting up your OpenTelemetry pipelines from others. These URLs let others see your configuration and visualize it in the same way you did. While these aren’t live-editable at the same time, it certainly makes it easier to share configurations and see the results of the setup at a glance. You can also export images of your pipelines which you can then easily pop onto a wiki or other documentation. While Splunk didn’t develop OTelBin, our native support for OpenTelemetry lets our customers take advantage of great tools like it to help start and run their observability data pipelines better, faster.
Of course, we will always work to make getting data into Splunk easier and faster. Look for more features around OpenTelemetry data ingestion coming to our products over time. If you don’t currently have an observability backend, give Splunk Observability Cloud a try for 14 days absolutely free. Any instrumentation you do to experience the trial will be industry-standard OpenTelemetry that you can use no matter where you end up in your observability journey.
Related Articles
About Splunk
The world’s leading organizations rely on Splunk, a Cisco company, to continuously strengthen digital resilience with our unified security and observability platform, powered by industry-leading AI.
Our customers trust Splunk’s award-winning security and observability solutions to secure and improve the reliability of their complex digital environments, at any scale.


