Put Your Issue Detection and Response on Fast-Forward With GenAI

Most engineers will tell you this: Troubleshooting today feels like trying to find your way out of a wild jungle, in the middle of a storm, at night, while a countdown clock is running. In other words, it’s ambiguous, nerve-racking, and plain difficult. But should this be the norm?
The sheer volume of data combined with growingly distributed environments has brought on more complex and opaque computer systems, making finding the root cause of an incident harder and uncertain. Additionally, the number of monitoring solutions each engineering team has to manage has substantially increased, leading to more tool sprawl. Unsurprisingly, 76% of tech execs admit data sprawl is a major obstacle to addressing downtime. Even if teams decide to use only a handful of tools, there’s little to no time to learn how to properly use them, which eventually leads to low adoption and churn. All these factors lead to higher mean time to detect and resolve incidents, low system reliability, and poor operational efficiencies.
Meet AI Assistant in Observability Cloud, a new Splunk in-product chat experience powered by GenAI in which you can use natural language to detect, investigate, and respond to incidents in your environment. Using powerful domain-specific and in-context Large Language Models (LLMs), the AI Assistant allows engineers to ask questions to the chatbot directly in plain language and gain key insights about their systems faster, regardless of their level of experience in Splunk or observability, reducing their mean time to investigate (MTTI) detect (MTTD) and resolve (MTTR) incidents.
In this blog, we’ll cover three use cases the AI Assistant can unlock: accelerated troubleshooting, deeper visibility of your tech stack, and faster daily operations.

Speed Up Your Incident Response With Guided Troubleshooting
A deployment issue, a configuration error, an application bug. When these come up they can break an entire system. As an on-call engineer, you must act quickly and accurately. If not, you’re running the risk of negatively impacting key business revenue across your organization and damaging your company’s reputation. But identifying an issue's root cause in today's ever-complex environment can be quite challenging. The Assistant can help make sense of that opaque system by swiftly analyzing thousands of metrics and traces in seconds, reducing the mean time to detect the cause and resolve problems.
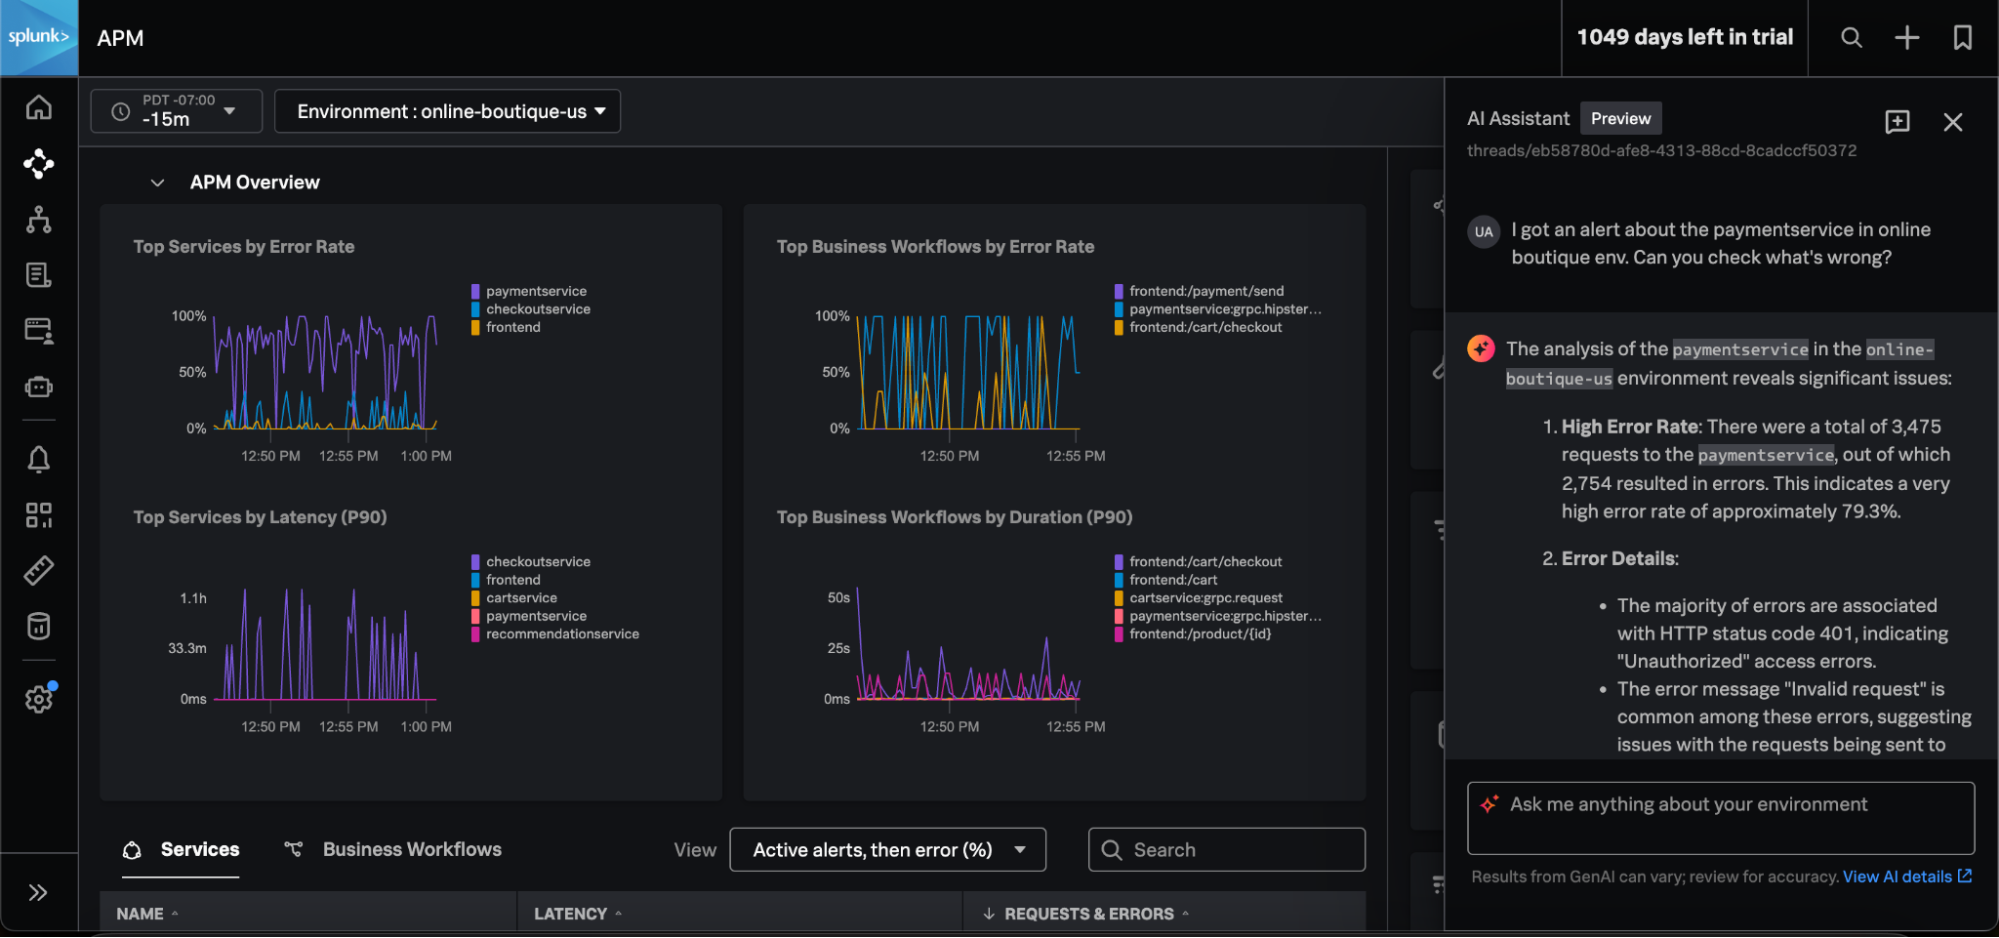
Let’s take an example. You’re an on-call SRE for a midsize e-commerce company. You get an alert that customers are not able to pay for their items after they check out their carts, causing them to leave your website. It’s 3 am (why are they shopping this late?), you’re on your own and you’re not sure where to start. What you do know is that this can become a bigger problem soon if you don’t take action immediately.
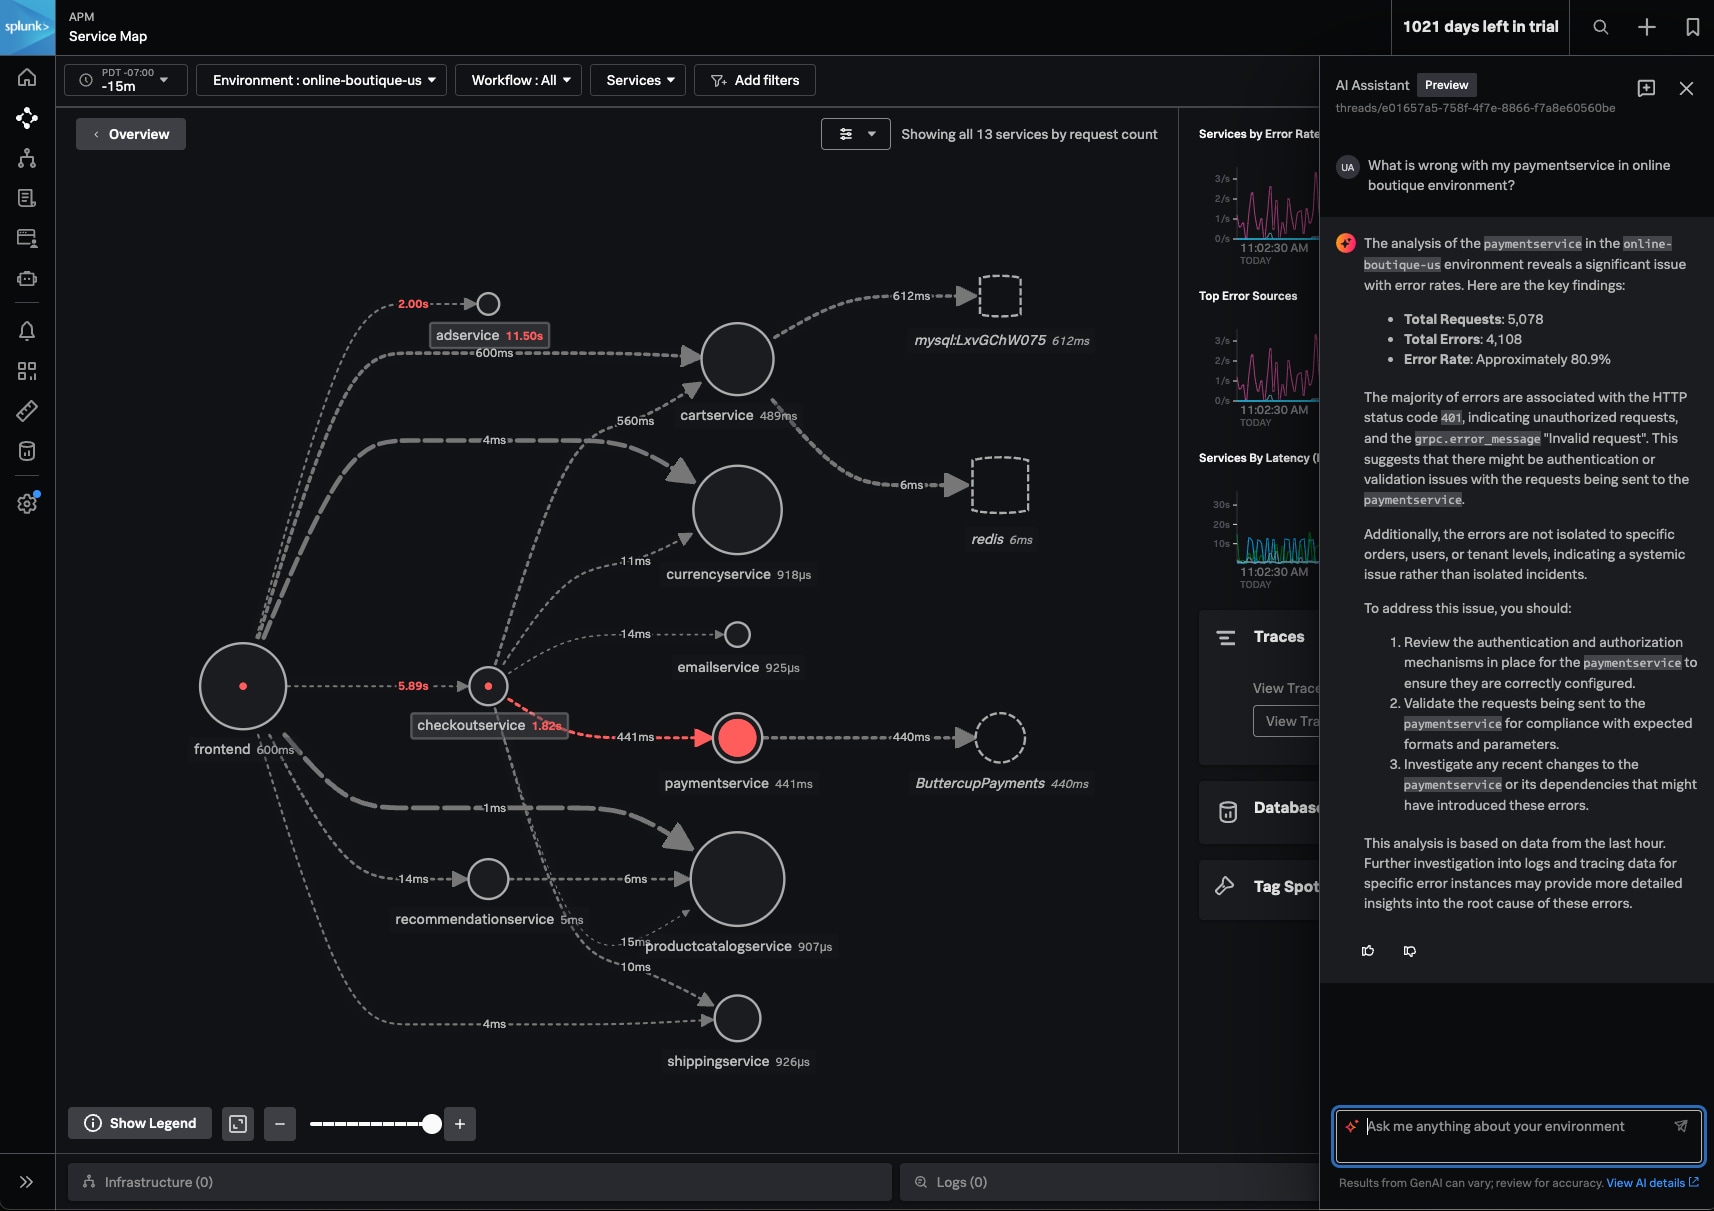
Enter AI Assistant in Observability Cloud. Simply type in “What’s wrong with my payment service?” in the chat and get immediate answers on why and where the application is failing.

The AI Assistant scans your applications and infrastructure within Splunk Observability Cloud, including requests, latency, and error rates, giving it a thorough understanding of your systems. This allows it to quickly point you in the right direction and find the source of the issue - in this scenario, an authentication or validation problem. Additionally, the Assistant will provide you clear troubleshooting guidance with key step-by-step instructions on how to fix the incident, for a timely and faster resolution. Being on-call doesn’t sound so bad after all now, does it?
Unveil More and Deeper Insights About Your Environment
We’ve said it before and we’ll say it again: your environments are dense, complex, and hard to monitor. There’s often more than meets the eye and when analyzing your systems, you might be missing the bigger picture about the health of your digital operations. Splunk’s AI Assistant helps reveal key information about your mission-critical applications and infrastructure by browsing across all your log, metrics (real-time and custom), and trace data, as well as nodes, clusters, services, and business workflows, so you can better monitor and optimize the performance of your production environment.
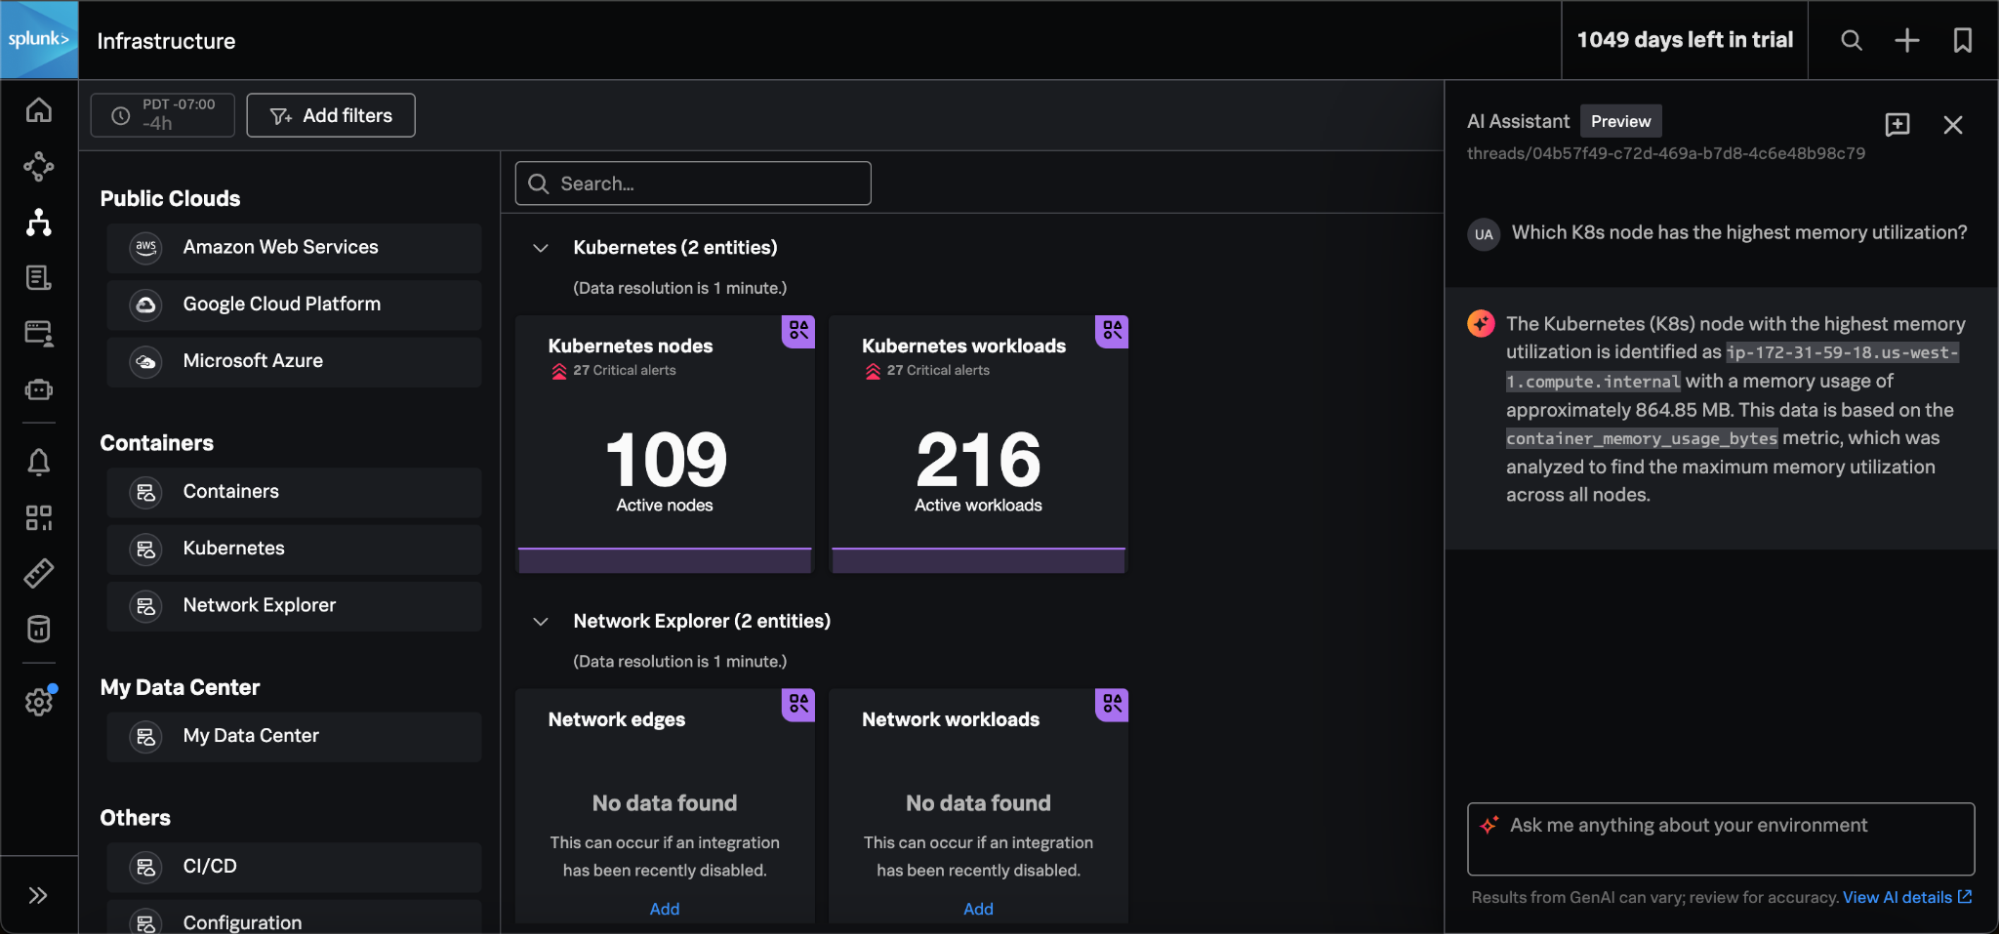
For instance, you’ve noticed an increased latency and performance degradation in one of your critical applications. It might be a node issue, but you’re uncertain which ones are behind this issue and want to ensure it’s addressed before a customer notices it.
Thankfully, your engineering teams use Splunk Observability Cloud. All they have to do is type “Which K8s node has the highest memory utilization?” to find out in just a few minutes which node is experiencing memory utilization issues and may be contributing to the performance degradation. With AI Assistant, not only can you get more details about your production environment, but you’re also ensuring that your tech stack is always well-performing and optimized, for a more reliable operative system.

Simplify Your Day-To-Day and Most Tedious Tasks
The new AI Assistant is incredibly powerful in streamlining engineers’ average daily operations, like summarizing past incidents in a report or writing SignalFlow to create charts and dashboards.
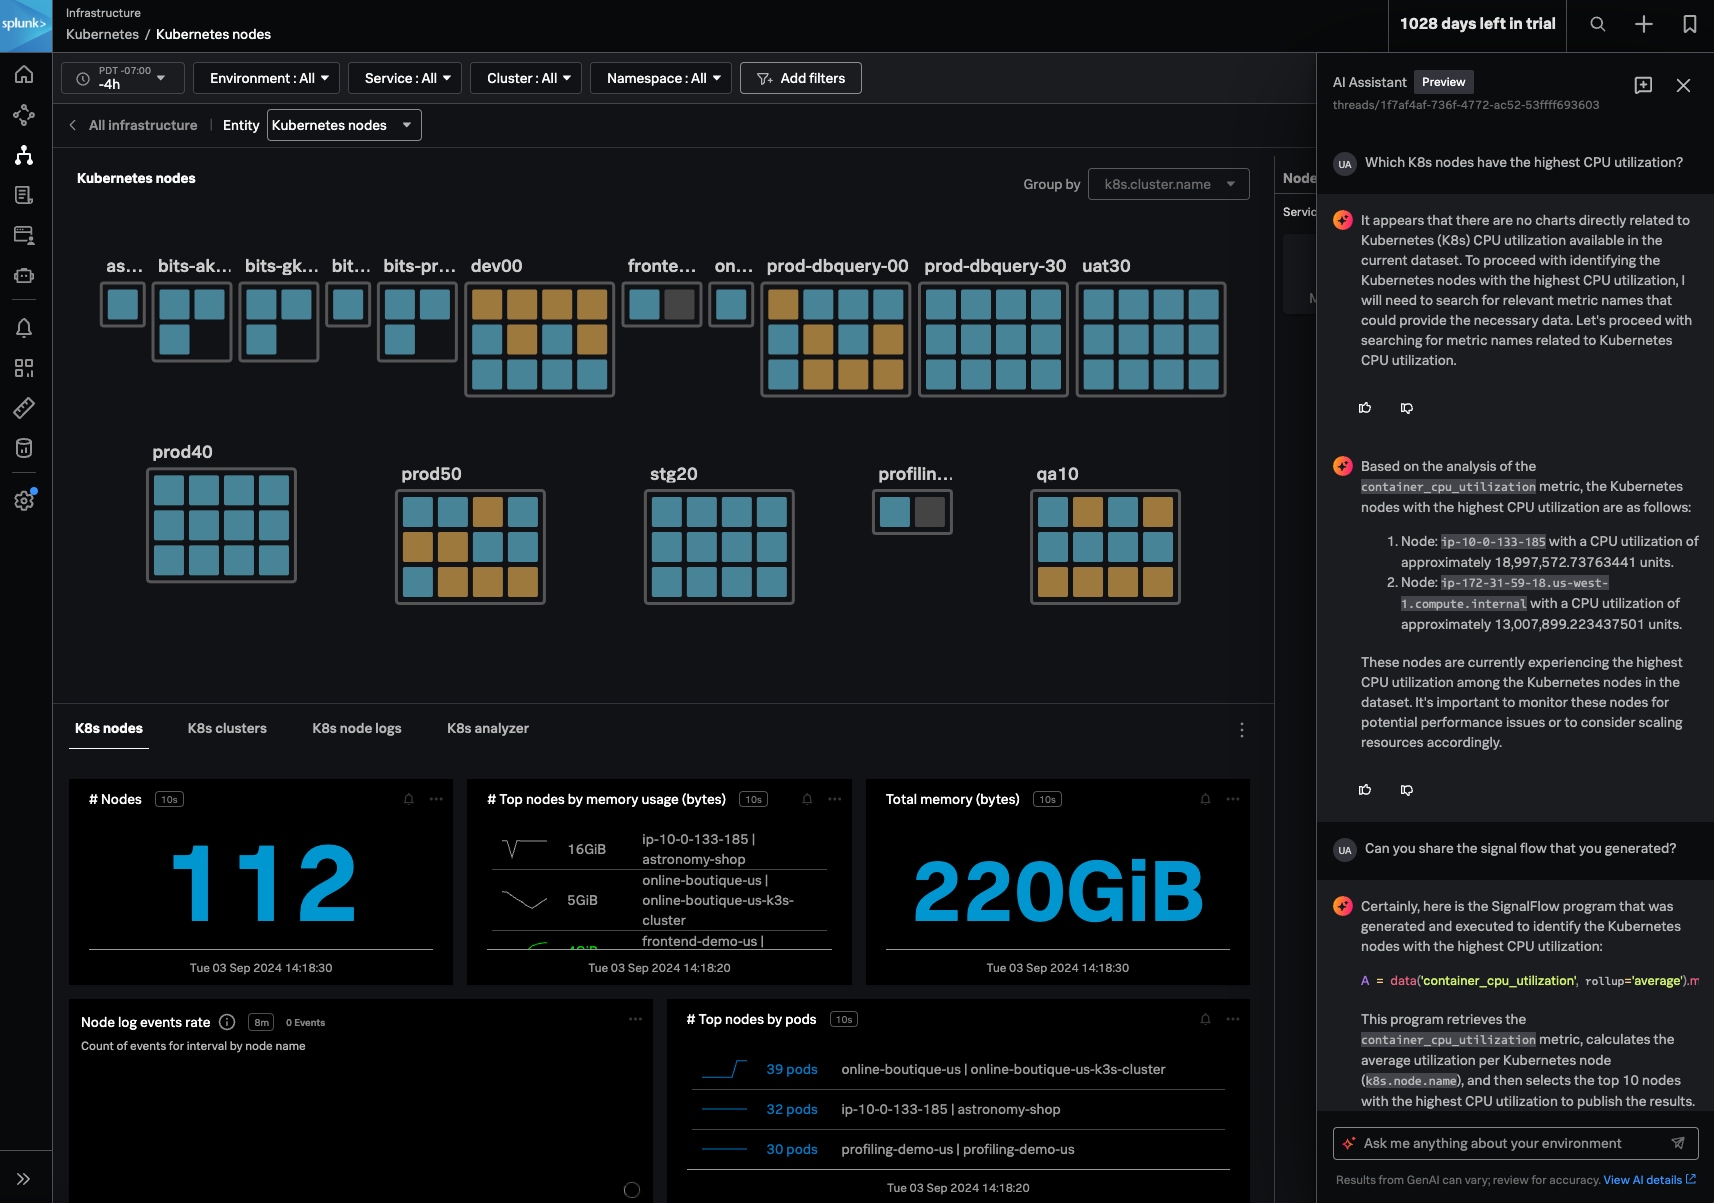
Let’s continue our previous scenario to illustrate this use case. You’ve just identified the Kubernetes nodes that have high memory utilization but now you want to be able to keep an eye on all those nodes so you can anticipate potential future performance degradation. You want to easily visualize and monitor those nodes, and decide to build a chart. While you’re aware that SignalFlow is a powerful code language that allows you to write custom chart analytics, unfortunately you’re not familiar with it and not sure where to start. The result? You spend too much time trying to write it yourself or end up using out-of-the-box dashboards that aren’t specific to your team’s needs.
No more. Now, you can ask the AI Assistant to help you write SignalFlow and build your custom chart by simply asking “Can you share SignalFlow to monitor the top 5 K8s node with the highest CPU utilization?”. In a matter of seconds, the AI Assistant will generate a SignalFlow code using this methodology, which you can easily copy and paste into the Dashboard Tab to get the custom chart you want.


Splunk’s AI Assistant simplifies and accelerates your daily operations, including chart creation. It eliminates knowledge barriers and helps you build the visuals and reports you need for all your monitoring needs.
In a world where most are lost in a stormy wild jungle, be the engineer with a secret (read GenAI-powered) compass! By integrating AI Assistant in Observability Cloud, you combine the breadth and depth of Splunk Observability with the ease of use and expertise of a GenAI-powered chat. It’s never been easier to slash your MTTx, accelerate your workflows, and build more stable, reliable, and resilient digital systems.
AI Assistant in Observability Cloud is currently in Private Preview, available for qualifying Splunk customers. Reach out to your sales representative if you believe you qualify or sign up directly here! Learn more about our AI strategy for security and observability and find out how you can build digital resilience.
Related Articles
About Splunk
The world’s leading organizations rely on Splunk, a Cisco company, to continuously strengthen digital resilience with our unified security and observability platform, powered by industry-leading AI.
Our customers trust Splunk’s award-winning security and observability solutions to secure and improve the reliability of their complex digital environments, at any scale.


