OpenTelemetry, Auto-Instrumentation and Splunk Observability Cloud: A Jump Start

Have you been meaning to learn about OpenTelemetry and the integration of all available application and service telemetry? If you like to learn things by doing; get ready to dive in and have some fun with OpenTelemetry and Splunk Observability Cloud. Quickly learn more about OpenTelemetry auto-instrumentation and collectors at your own pace with these walkthroughs and guides:
- Observability Quick Start Demo and the Hipster Shop Guided Example: Use a familiar microservices demo application to help one quickly get started evaluating the features of OpenTelemetry and Splunk Observability Cloud.
- OTEL Me More: Splunk-OTEL-JS and Express emitting to an OTEL Collector: A video walkthrough to generate an application and auto-instrument with splunk-otel-js emmitting metrics through an OpenTelemetry Collector emitting to Splunk Observability Cloud.
- OTEL Me More: A quick start guide to OpenTelemetry-JS and Express: A video walkthrough of the Auto-Instrumentation of OpenTelemetry-JS and Express JS emitting the to output trace and log data to the console
- Learn about OpenTelemetry by deploying a microservices demo to a Kubernetes cluster running a local OpenTelemetry (OTEL) collector. Within minutes of deploying pods to a cluster, one can observe all of the outputs from the instrumentation in Splunk Observability Cloud: Application Performance Monitoring, Infrastructure Monitoring and Real User Monitoring.
 Figure 1-1. The Hipster Shop Guided Example is now available in the Splunk Observability Cloud Integrations
Do You Have Telemetry, Monitoring and Observability to Confidently Answer Your Questions?
- "Can you observe all of your telemetry outputs in one place?" If you could would it help you to better understand how to utilize or implement Observability for your organization?
- “Do you know how many clicks or errors a user may encounter in your consumer experience?"
- “Do you know when my software is being deployed and how it is working, is there a bottleneck or broken release gate?”
An application or service can be auto-instrumented with OpenTelemetry with minimal modifications to the application itself, configuration files or build pipelines. After pipeline modifications to include supporting libraries and the injection of environment variables, one may even want to Observe Jenkins Pipelines. Doing this helps bring visibility into the software development life cycle and can help you be proactive in reducing consumer friction.
Auto-Instrumentation of an existing application is easy. For a node.js application, it can be as simple as modifying the npm start up script to include and instantiate the splunk-otel-js libraries if a local OpenTelemetrycollector is running. To get started one can modify an existing application or start with a blank express.js project. To this blank project, just add the auto instrumentation bits to package.json. If one would like to try this without a collector emitting telemetry directly to Splunk Observability Cloud it is possible to do so with a few additional environment variables.
 Figure 1-2. Configuration example of how to send directly to Splunk Observability Cloud through a local OpenTelemetry Collector
Check Splunk Observability Cloud to View Application Performance Monitoring and Real User Monitoring
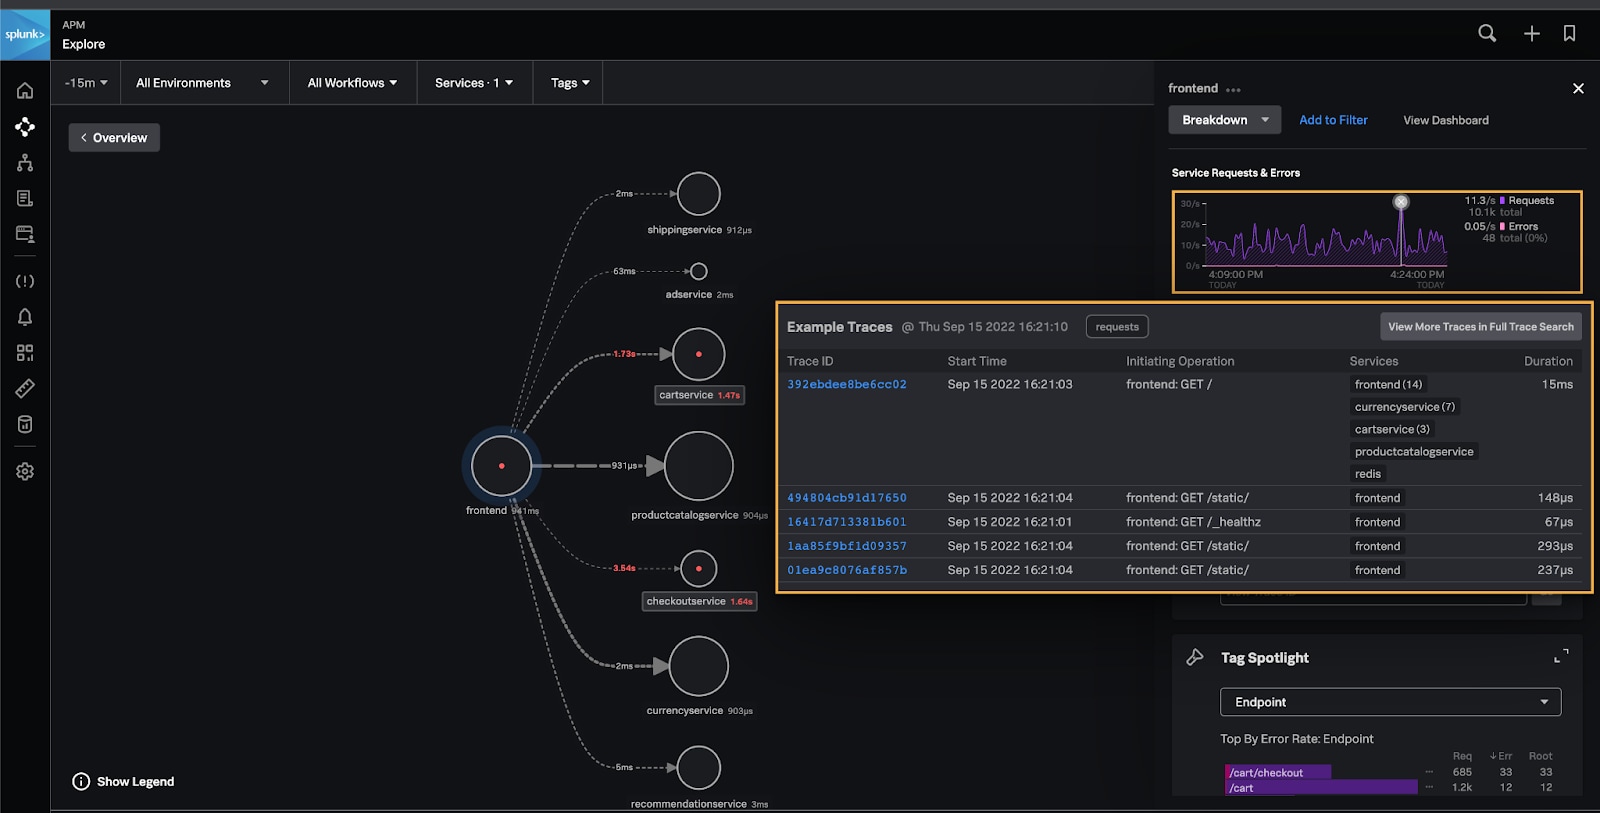
After an application has been instrumented and configured with OpenTelemetry and a collector is emitting metrics from or a Kubernetes cluster running with Hipster Shop, head over to Splunk Observability Cloud. Once logged in, click into APM overview and one will be able to see telemetry, insights and integrations all working together.
 Figure 1-4. A view of Splunk Observability Cloud with a new Trial License activated
Explore services and applications distributed traces in the service map. The service map’s connections will grow as you navigate through the demo microservices website. If you would prefer to just observe, use the traffic generation tooling distributed with the hipster shop demo to automate load generation.
 Figure 1-5. Splunk Observability Cloud -> Infrastructure -> Kubernetes: Customer Map with OpenTelemetry Collector
If running the microservices demo or another service on kubernetes, be sure to check out the infrastructure in the Splunk Observability Cloud Infrastructure Monitor. The example below shows the cluster map of the OpenTelemetry collector deployed with a Helm chart provided by Splunk.
 Figure 1-6. Splunk Observability Cloud -> Infrastructure -> Kubernetes: Customer Map with OpenTelemetry Collector
If you want to see how real users are experiencing the web application, navigate to the Real User Monitoring (RUM) Section of Splunk Observability Cloud. The RUM service dashboards highlight Key Metrics such as Largest Contentful Paint (LCP), Cumulative Layout Shift (CLS), First Input Delay (FID), Time To First Byte (TTFB), Javascript/Network Errors and Backend/Resource Request Duration. Find out about consumer friction before support tickets are filed with proactive monitoring available through Splunk Synthetic Monitoring. (Note: Splunk Synthetic Monitoring is not included as part of the trial at this time.)
Observability is One or Many Views at a Time – Get Started Today and Sleep Better at Night
Now you know how easy it is to add auto-instrumentation of OpenTelemetry to applications as well as how to configure and deploying a local OpenTelemetry collector. This enables you to proactively monitor your services and applications from front end to back end, monitor proactively and take action with alerts as needed, Bring DevOps, DevSecOps, Operations and Executives together with Observability, OpenTelemetry and Splunk Observability Cloud.
What one accomplished with these exercises:
- Explore how Real User Monitoring works with the Hipster Shop Guided Example and how this can help with your organization’s proactive monitoring.
- Instrumentation of splunk-otel-js or otel-js using example node.js application and output Traces, Metrics and Logs directly from the application to Splunk Observability Cloud and through an OpenTelemetry Collector.
- Build and Deploy example applications, services and infrastructure to a Kubernetes utilizing a local OpenTelemetry Collector to relay telemetry to Splunk Observability Cloud.
- Observe all of the outputs from the instrumentation in Splunk Observability Cloud: Application Performance Monitoring, Infrastructure Monitoring and Real User Monitoring
Next Steps
Get your applications and services instrumented today with Splunk and OpenTelemetry auto-instrumentation. Utilize Splunk and OpenTelemetry's technical capabilities to integrate Observability into your continuous delivery, security, version/process control to promote high levels of software delivery performance. Take proactive steps to improve Customer Satisfaction and reduce your consumer friction with Splunk Real User Monitoring. As one instruments more services and applications, confidence will grow and likely there will be more questions and more solutions that derive more business value. Explore how your infrastructure performs under load and find bottlenecks in production in near real time by sigining up to start a free trial of the Splunk Observability Cloud suite of products today!
This blog post was authored by Adam Schalock, Solutions Innovation Engineer at Splunk with special thanks to: Jeremy Hicks
Related Articles
About Splunk
The world’s leading organizations rely on Splunk, a Cisco company, to continuously strengthen digital resilience with our unified security and observability platform, powered by industry-leading AI.
Our customers trust Splunk’s award-winning security and observability solutions to secure and improve the reliability of their complex digital environments, at any scale.


