New Splunk Synthetic Monitoring Features Help Integrate Uptime and Performance Across the Entire Splunk Platform

For teams that build or maintain modern applications with their end-users in mind, the acquisition of Rigor means that Splunk now offers the most comprehensive synthetic monitoring solution on the market. Rigor, now Splunk Synthetic Monitoring and Web Optimization, provides best-in-class synthetic monitoring capabilities enabling IT Ops and engineering teams to detect and respond to uptime and performance issues within incident response coordination and throughout software development lifecycles. Splunk’s ongoing market leadership in ITOM, and it’s momentum in observability through Splunk APM, Infrastructure Monitoring, and Real User Monitoring (RUM) products, result in faster troubleshooting and better user-experience.
Since the acquisition, Splunk Synthetic Monitoring engineering teams have continued to make tremendous progress at delivering features that help find and fix issues faster across your full stack, and deliver better user-experiences. Here’s a quick update on Splunk Synthetic Monitoring’s integration across the larger Splunk platform, new web optimization best practices, and how your organization can start using Splunk Synthetics.
Synthetics Connected Into the Entire Splunk Suite
Teams using Splunk Synthetic Monitoring can now troubleshoot faster by adding the outside view of the health and responsiveness of their web applications in context with the larger Splunk suite, including our APM, Infrastructure Monitoring, Cloud, and Enterprise platforms.
Splunk Cloud and Enterprise
Splunk Cloud and Enterprise users now have visibility into Digital Experience Monitoring and their end-user experience. Metrics from Real Browser, Uptime, and API tests are now streamed to Splunk Cloud and Enterprise via the Synthetics HEC integration. These metrics provide IT Ops teams critical information about how pages and API endpoints respond to end-user transactions. Some metrics include: Response time, Time to First Byte, and DNS time along with 50+ performance metrics and custom user timings for Browser-based transactions.
Splunk APM
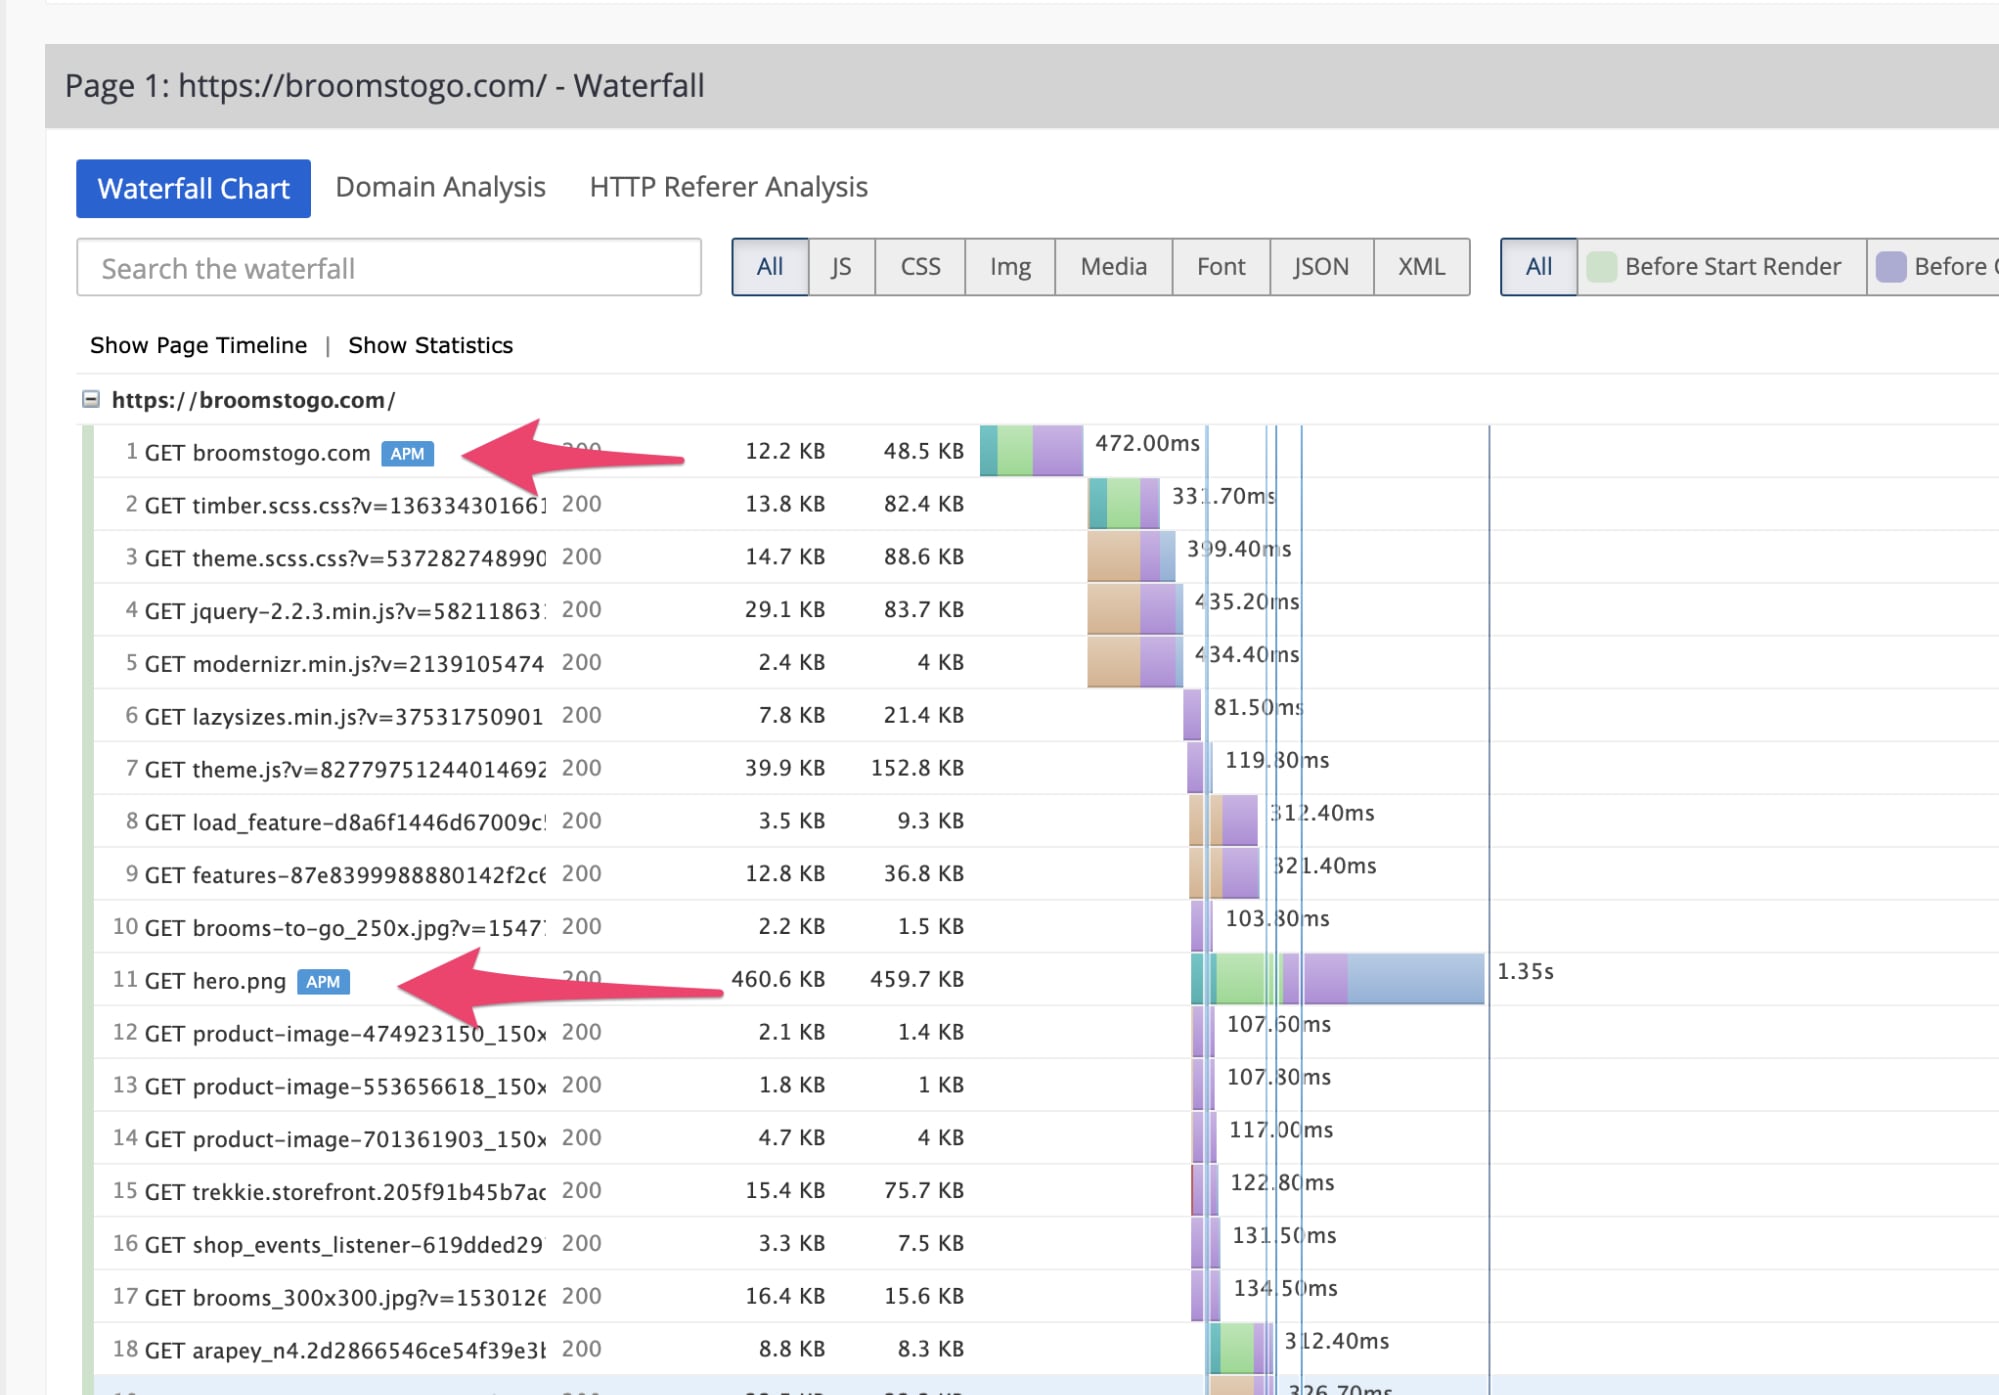
Synthetics’ integration with APM helps you baseline, alert, and troubleshoot faster by easily viewing latency from spans and traces in web browsers and backend services. Splunk users can now quickly pivot from customer experience issues like latency in the frontend, through spans and traces from backend services in Splunk APM. For example, if TimeToFirstByte (TTFB, a measurement of server-side performance) spikes, oncall engineers can quickly view bottlenecks within APM’s backend data, providing rapid context to improve MTTR.

View server-side dependencies in waterfall charts

Easily navigate transaction traces from frontend synthetic test results
Splunk Infrastructure Monitoring
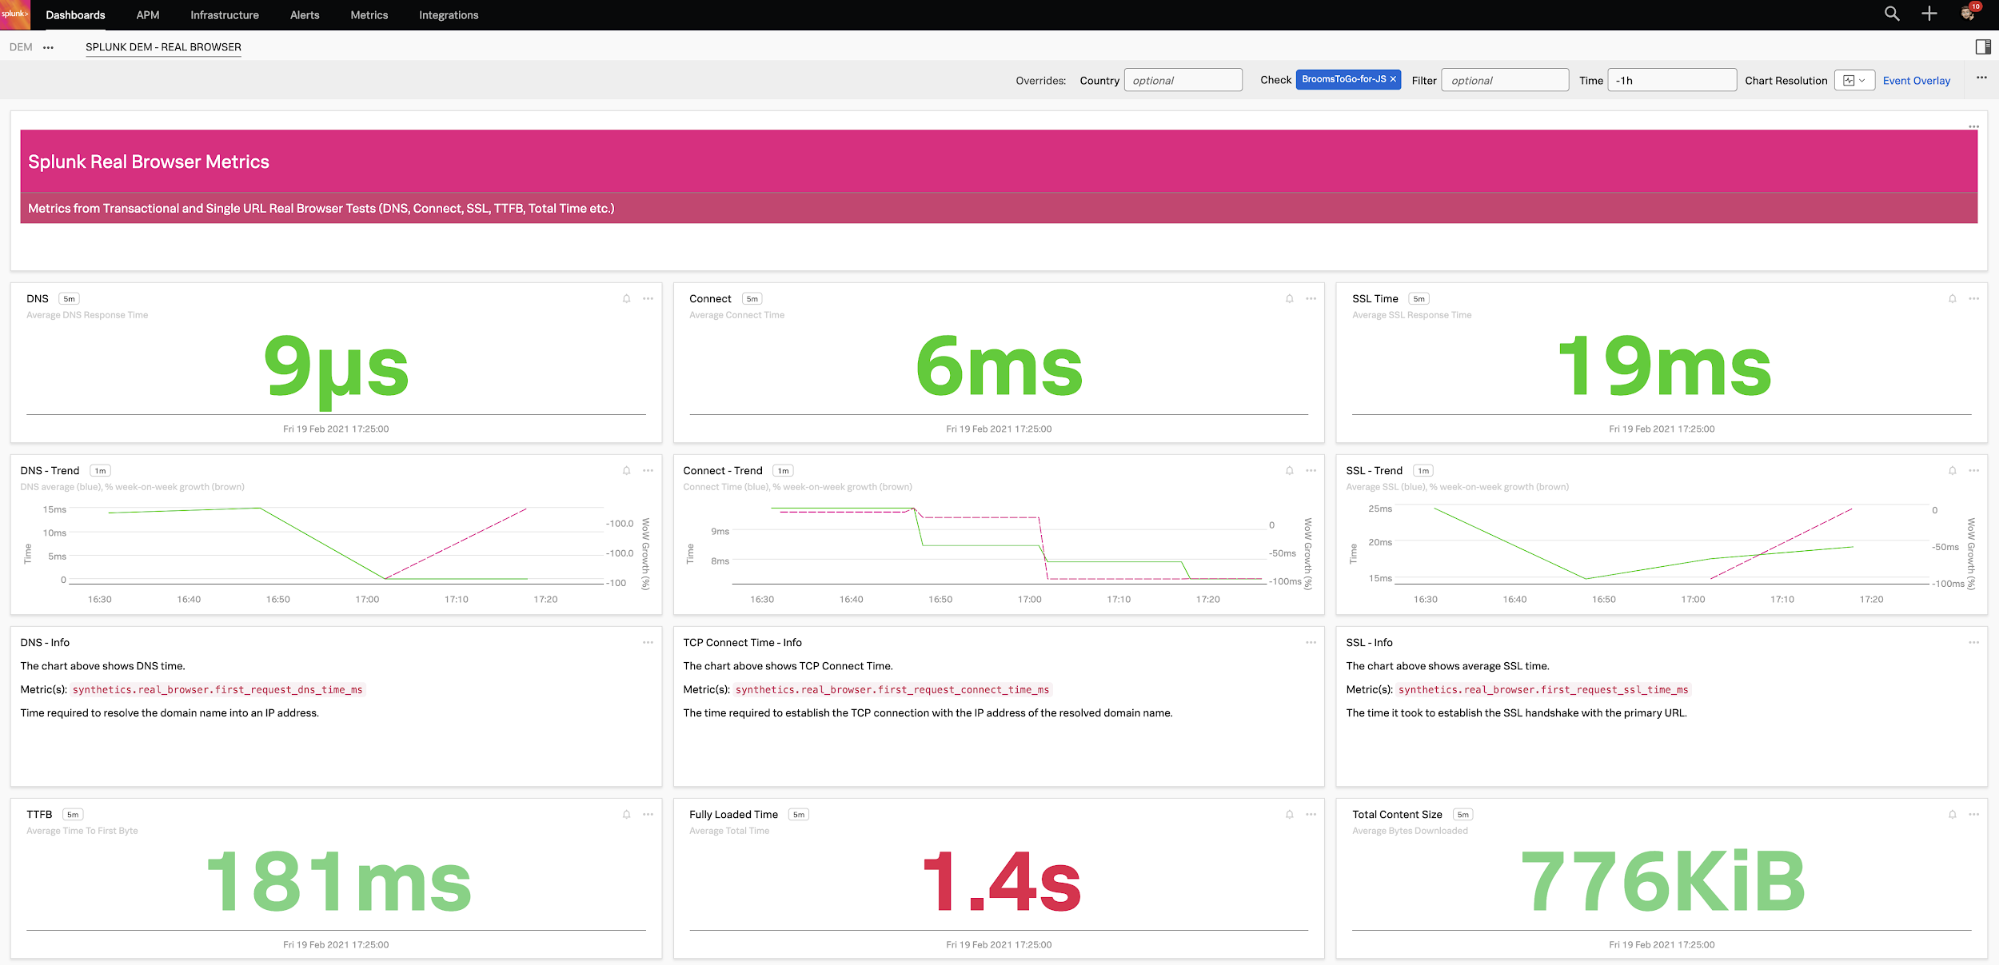
Teams can compare the health of their end-user experience alongside their infrastructure, with easy-to-create dashboards that show client-side performance. Quickly measure how trends in server-side performance impact end user experience by choosing from over 50 frontend performance metrics, and compare against infrastructure health.
To view frontend performance within Infrastructure Monitoring dashboards, see our docs for step-by-step instructions.

View frontend metrics within your Infrastructure Monitoring dashboards
Splunk On-Call
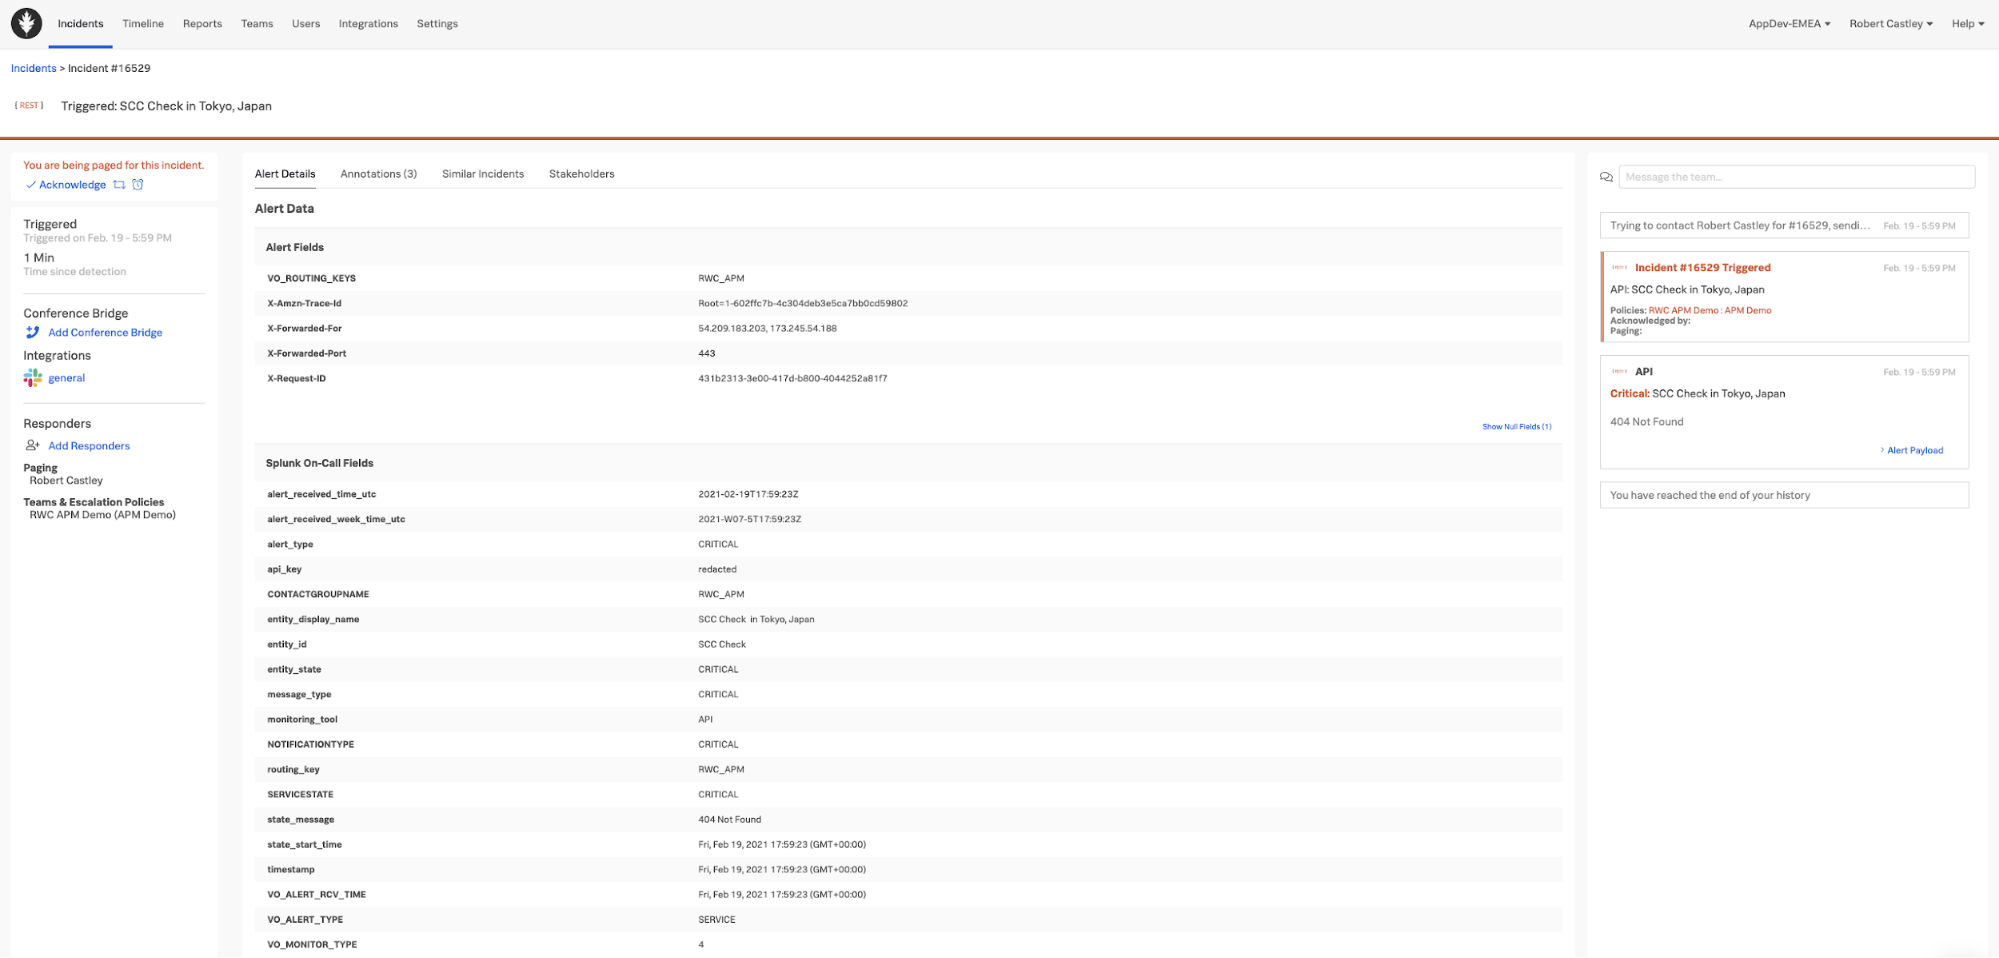
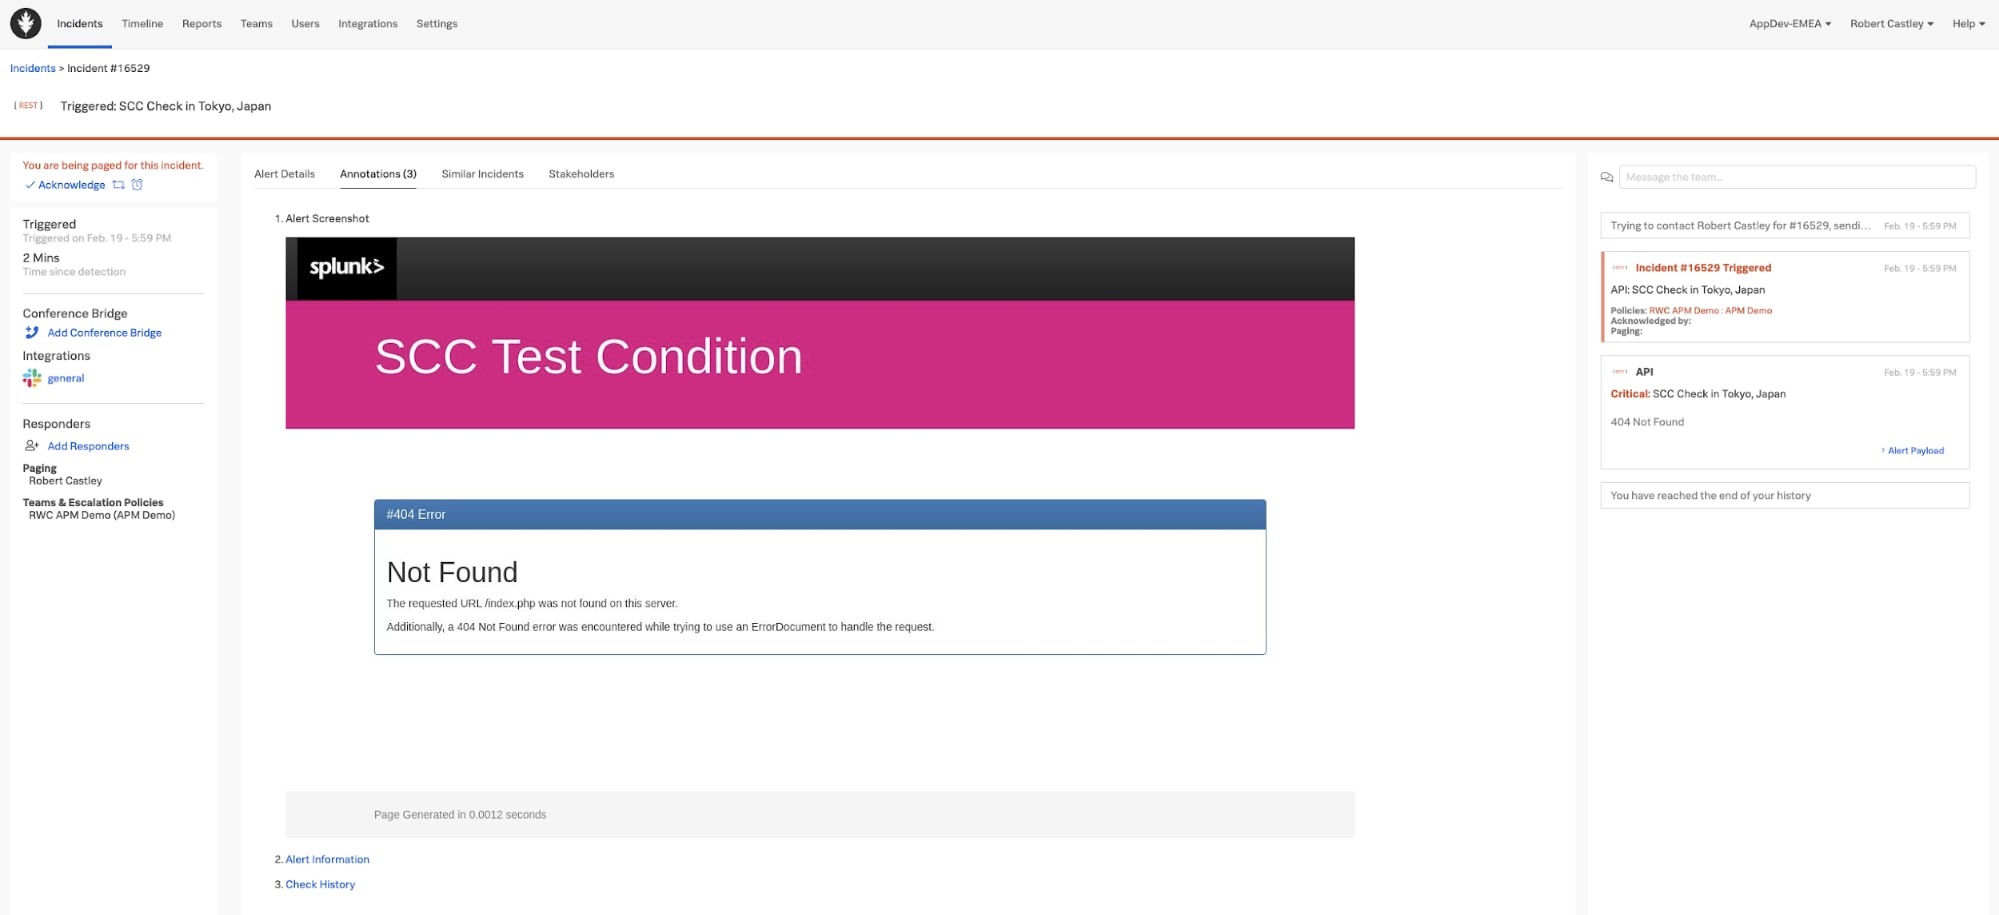
Incident response teams can now detect, correlate, and resolve issues faster with Splunk Synthetic Monitoring’s integration into Splunk On-Call. Alerts from Synthetics are sent via webhook to Splunk On-Call and correlated against other issues. This helps teams understand digital experience and API endpoint health and uptime against ongoing issues across an entire architecture, to help teams communicate severity and impact of problems and begin to coordinate a response. Incident response teams can download the Splunk On-Call mobile app from the App/Play Stores (Android / iOS).

Connect outages and failures from synthetic tests to your incident response in Splunk On-Call

Synthetics helps you add context into alerts and outages for API endpoints
To send alerts directly to Splunk On-Call, see our docs for step-by-step instructions.
New Web Performance Optimization Best Practices
Using Synthetics to monitor page performance and user experience is only half the battle. Customers need insight into what modern web optimization best practices they are missing, or misusing. To this end Splunk Web Optimization has added support for 16 new best practices.
Adopting proper image optimizations and best practices directly improves key UX metrics like LCP, FCP, and Speed Index is critical. In addition to our 31 existing, we now support 6 more, such as identifying Offscreen Images without Lazy Loading and WebP Candidate images.

Optimizing how fonts are delivered and rendered improves metrics like Google’s Core Web Vitals. To support this, six font-specific best practices are added such as Combinable Google Fonts, Unused Google Fonts, as well as Delayed Rendering for Web Fonts.

Splunk now also finds cookie problems, such as missing security features like Cookie without SameSite Attribute. Four additional defects impacting performance, quality, and security, are such as API Response without Caching, Web page missing Strict-Transport-Security, and Shared Resources CDN Detected.
Unlocking More Insights with Splunk Synthetics and Web Optimization
As we have seen, Splunk Synthetic Monitoring and Web Optimization are now integrated into the broader Splunk platform, allowing you to gain even greater insights into the health and performance of your web applications and APIs. You can request a trial and get set up in minutes. But we aren’t done yet! Stay tuned for upcoming integrations, new features, improvements, and best practices from the Synthetic Monitoring team!
Sign up for a free trial today!
Related Articles
About Splunk
The world’s leading organizations rely on Splunk, a Cisco company, to continuously strengthen digital resilience with our unified security and observability platform, powered by industry-leading AI.
Our customers trust Splunk’s award-winning security and observability solutions to secure and improve the reliability of their complex digital environments, at any scale.


