Maintaining Thresholds: Advanced Splunk Observability Detectors

Alerting can be hard. Think about how detectors are set up to alert engineers in your organization. How many inactionable individual alerts are going off in your environment? Are you ever confused about how to alert on more complex combinations of signals in a detector? Are you running near your limit of detectors? These are all common problems with solutions we’ll discuss in this post! Some of the problems you’ll learn to address in this blog post are:
- Live within org limits: Combine alerts into a single detector to stay within detector limits for large deployments
- Simplify alert maintenance and management: Combined alerts can also enable configuration as code to drastically reduce orphaned assets.
- Alert on complex conditions with numerous signals: Sometimes a behavior you’d like to be alerted to isn’t as simple as monitoring a single metric. Compound condition alerting is possible!
Does this sound valuable for your organization? Read on!
Many Alerts, One Detector
Realistically we all start our alerting journey creating simple alerts on things like request rate or resource metrics for a given service or piece of infrastructure. But as time goes on, these alerts tend to accumulate, making maintenance of your observability tools and alerts more difficult. You may even run into limits on the number of detectors you can create. Combining alert conditions into a single detector can help in numerous ways.
- Combining multiple alerts into a single detector makes responding to an issue more straightforward. When you’re on call and get paged at 2am, having to look through multiple alerts to establish what is going on takes important brain cycles. Alerts that include the 4 Golden Signals: Latency, Errors, Traffic, and Saturation (L.E.T.S.) can illustrate the shape of an issue in a single Detector.
- Multiple alerting conditions in a single detector can help templatize alerting for other services and important software being monitored in your organization. This is especially useful when combined with configuration as code such as Terraform. For example, setting up a detector for all of the basic host metrics grouped by host and deploying it through configuration as code helps make sure that no hosts go unmonitored and provides a single source of truth for those alert definitions.
- Detector limits may force you to combine alerts to stay under your limit. Though limits can be raised, keeping this in mind early on can help save cycles on maintenance and cleanup.
When combining alerts it’s best to consider ahead of time which groupings would be most useful to responding teams. Grouping by service name is a common choice as it encompasses not only software functionality but can also include the infrastructure that software is running on. Other common groupings include: host, region, datacenter identifier, owning team, or even business unit. When creating these groupings it is important to consider who will be responding to the detector and what information they will likely need to accomplish their response.
The following Splunk Lantern article describes in detail how to use signalflow to create detectors with multiple alert signals:

Figure 1. All of the Golden Signals can be contained in a single detector! This detector will be triggered if any of the LETS golden signals are out of range.
By following these directions you can quickly reap the benefits of combined detectors and signalflow! Armed with this knowledge you can start exploring new ways to group and use alerts. Grouping by service, region, or environment are just the beginning, and any dimensions you include can be used to create better organizational clarity. For advanced organizations this may mean grouping by business units or even revenue streams for greater observability to the business and executive leadership.
But signalflow can also be useful in other ways.
Many Signals, One Alert
Imagine you’ve got a complex behavior requiring multiple metrics you would like to alert on. For example we may have a service that can simply be scaled when CPU utilization is high, but when disk usage is also above a certain level a different runbook is the correct course of action. In these sorts of situations you need to be able to utilize multiple signals and thresholds for the alert defined in your detector.
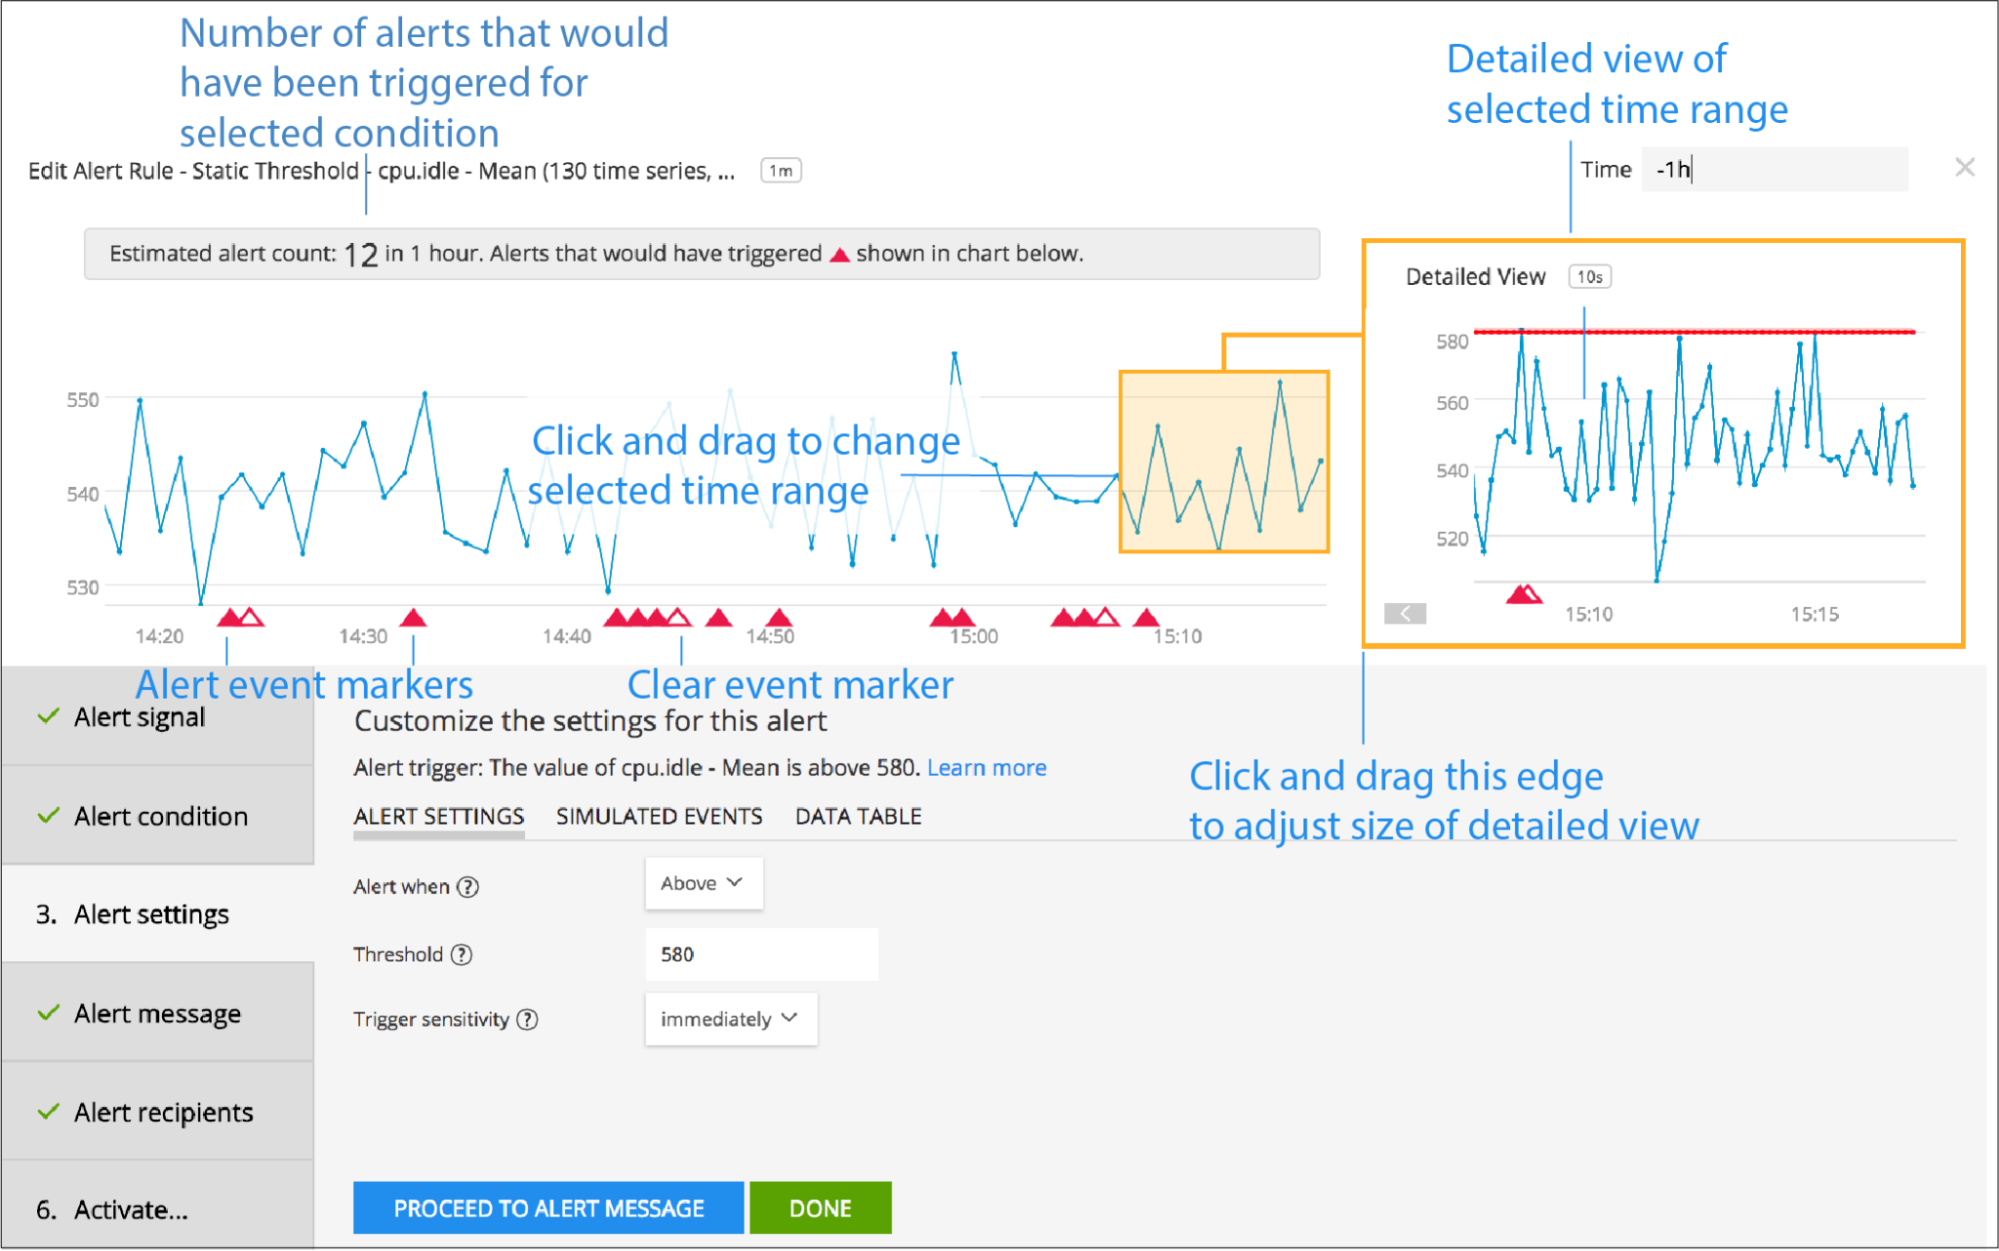
Creating compound alerts is possible in the Splunk Observability UI. But it is also possible to set up these sorts of alerts with signalflow! As noted above, signalflow can help you when laying out your configurations as code in Terraform. When creating compound alerts it is important to leverage the preview window for fired alerts. With the preview window you can easily tweak your thresholds to make sure you’re only alerting on the specific behavior being targeted

Figure 2. Alert preview can help you determine the correct thresholds for each of your compound signals in a complex alert (source).
Additionally you may find it useful to link to specific charts when using compound or complex alerting. Using linked charts can help draw eyes to the appropriate locations when a complicated behavior is setting off your detectors. When every second counts, a little bit of preparation and forethought put into which charts are most important, can go a long way!
What’s Next?
If you’re interested in improving your observability strategy or just interested in checking out a different spin on monitoring you can sign up for a free trial of Splunk Observability Cloud today!
This blog post was authored by Jeremy Hicks, Observability Field Solutions Engineer at Splunk with special thanks to: Aaron Kirk and Doug Erkkila
Related Articles
About Splunk
The world’s leading organizations rely on Splunk, a Cisco company, to continuously strengthen digital resilience with our unified security and observability platform, powered by industry-leading AI.
Our customers trust Splunk’s award-winning security and observability solutions to secure and improve the reliability of their complex digital environments, at any scale.


