How to Test a User Workflow To Resolve Issues Before Impact

Whether you have zero frontend monitoring in place or you have performance monitoring embedded into your CI/CD automation, it’s imperative to test your most important user workflows so that you can find and fix issues before real users are impacted. Splunk Synthetic Monitoring helps you understand what your users are experiencing and proactively test what you need them to do.
Splunk’s simplified test configuration makes it easier to scale up your frontend monitoring, on top of flexible data and detector management via GUI or API. Plus having your Synthetics connected to Real User Monitoring (RUM) and Application Performance Monitoring (APM) shows a more complete picture of your application health, end user experience, and the root cause of issues.
Synthetic testing in pre-production will help you catch some issues before your own app changes are pushed to production. Also, testing in PROD – up to every minute around the clock and around the world – allows you to understand what your end users are actually experiencing, increasing the chances that you'll catch issues before users notice them.
Prioritize What To Test
It’s important to document the user workflows that you want to prioritize testing. Ask yourself: what are the most important transactions that need to be available and fast for my users and my business to succeed? Some examples:
- signing in to a portal
- filling and submitting a form
- paying a bill or buying merchandise
- browsing a product or course catalog
Emulating these actions in a synthetic browser test captures the frontend experience and all first and third-party resources that go into its performance. This is not where you want to test all of your buttons and menu items; while your functional testing ensures everything works, synthetic testing focuses on the speed and availability of the workflows that impact your users and your business.
Sidenote: API and uptime tests should also be used to test the internal and external resources that are critical to making your user scenarios successful – and because these tests are cheaper and faster, they can be run more frequently for optimal coverage.
Configure Tests Intentionally
Where are your users and what devices are they on? Look to your RUM and business analytics to learn more. When you know your users, you can tailor tests to the geolocation, device types, connection speed, and workflows that are most like your real traffic.
Google has created Core Web Vitals to quantify user experience, which we measure in Synthetics – it's a great place to start baselining and improving your frontend performance. Because Google sets industry standards for digital performance metrics, run synthetic tests in Chrome and leave the other browsers for your functional tests and RUM.
Create some spoof user accounts based on the personas you want to test. Store credentials and other sensitive information in concealed global variables so they are usable across tests. When you have defined your test configuration strategy, you are better prepared to create the tests.
Creating a Multi-Step Browser Test In Splunk Synthetic Monitoring
Let's say you have a new application feature and need to ensure the browser experience is optimal for your end users. Start with a clear, concise user workflow. Starting simple will help you understand the process of creating reliable tests, and then you can go into more complex tests with advanced settings and javascript steps, for example.
First, open an incognito browser window to create your test. You can either start up a recorder like the built-in Chrome recorder, or simply inspect the DOM as you go. Size your browser window based on the viewport you want to test, to account for elements and layouts that change at responsive breakpoints.
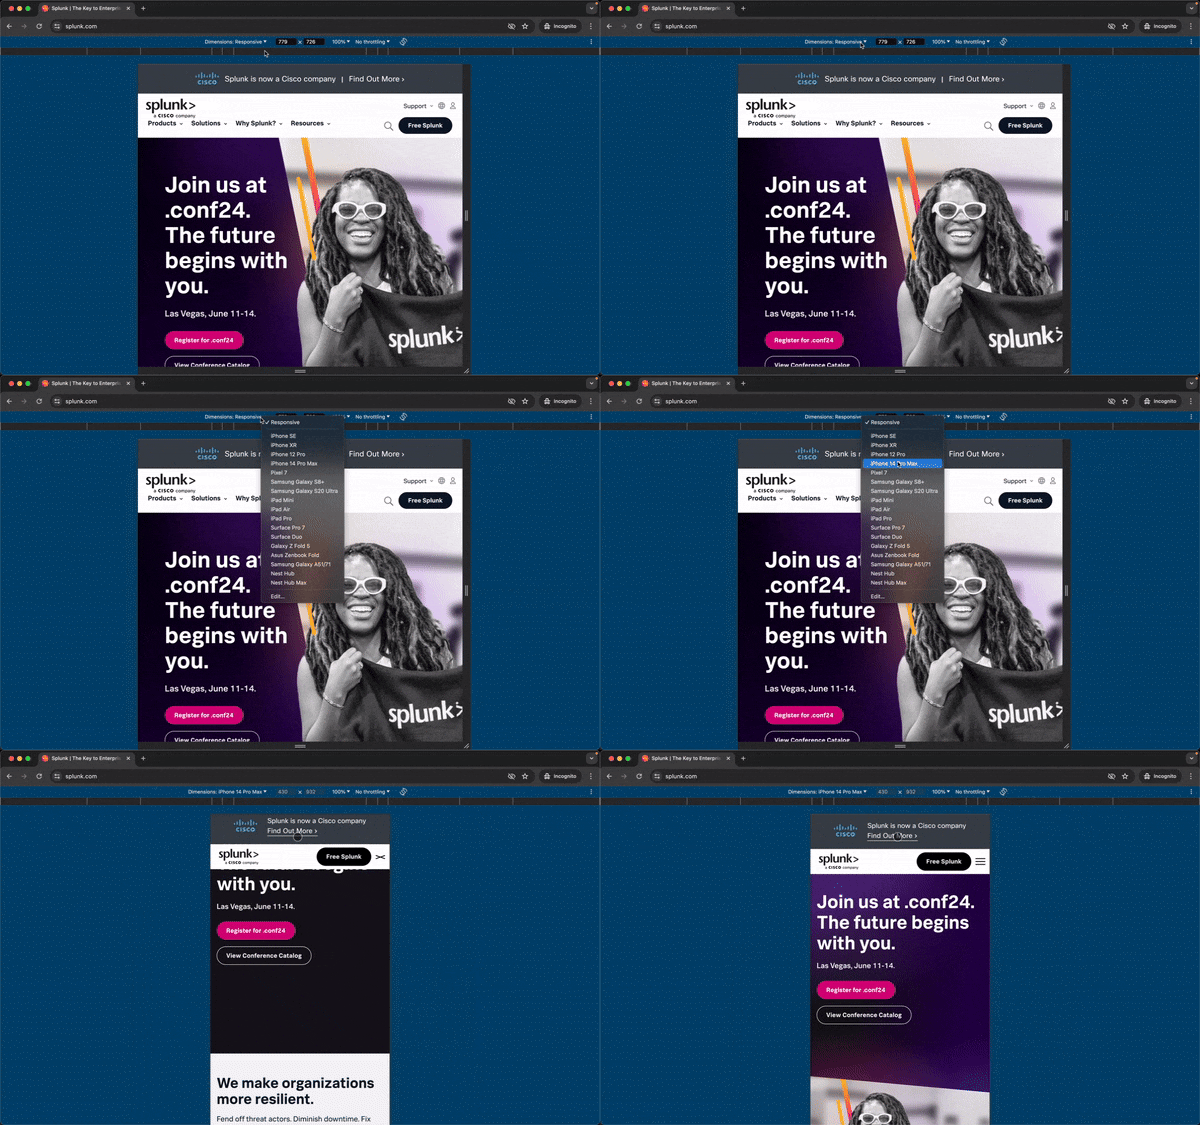
Go to your starting URL and begin capturing the user actions that you want to test. Remember that you are testing a real user workflow: what are the actual steps your end users need to take?
If you are using a recorder, replay the recording in a new incognito window to make sure the test is valid. When steps fail, it is usually because a fragile selector was chosen – //span/div/span[2]/div[2] is considered fragile because it is position based and could break if the page layout changes. A better selector would use unique id or data attributes for example.
Using a recorder is fine as a starting point, but taking care to manually ensure resilient selectors will save you headaches in the future. Check out Lantern for selector tips and tricks.
To create a test in Splunk Synthetics, you can manually build steps in the GUI, or import JSON steps from a recording either in the GUI or via API. The following steps focus on using the GUI.
- Go to Splunk Observability Synthetics and click "Add new test" on the top right of the screen, and select Browser Test.
- Name the test something clear and in line with any patterns you wish to have in your naming convention. Keep in mind that when building custom dashboard charts you can pull in test names with a wildcard.
- Add tags like device or environment in the custom properties field. These tags can be used in filters.
- Set the testing locations, device, and frequency that you'd like the test to run.
- Tip: if creating a complex test for the first time, try it from just one location at first to reduce variables in troubleshooting.
- If testing a non-public site, refer to the Private Location guidance.
- Unless you are testing something critical that needs to be tested from multiple locations at the exact same time, leave "Round Robin" turned on so the test takes turns running from the selected locations.
- Remember that you are not only capturing first-party resources, but also third-party resources that might fail at unexpected times.
- In the "Steps" section, select "Import" if importing JSON, or "Edit" if building the test from scratch.
- After importing, the dialog will indicate if any steps were not compatible.
- After importing, the dialog will indicate if any steps were not compatible.
- Edit the test transactions and steps.
- Grouping test steps into transactions allows you to understand not only what step failed in a test, but also monitor and alert on what part of the user journey was affected.
- Assigning transactions also helps break down a browser test for a Single Page Application (SPA) which doesn't have the built-in breakdown by URL.
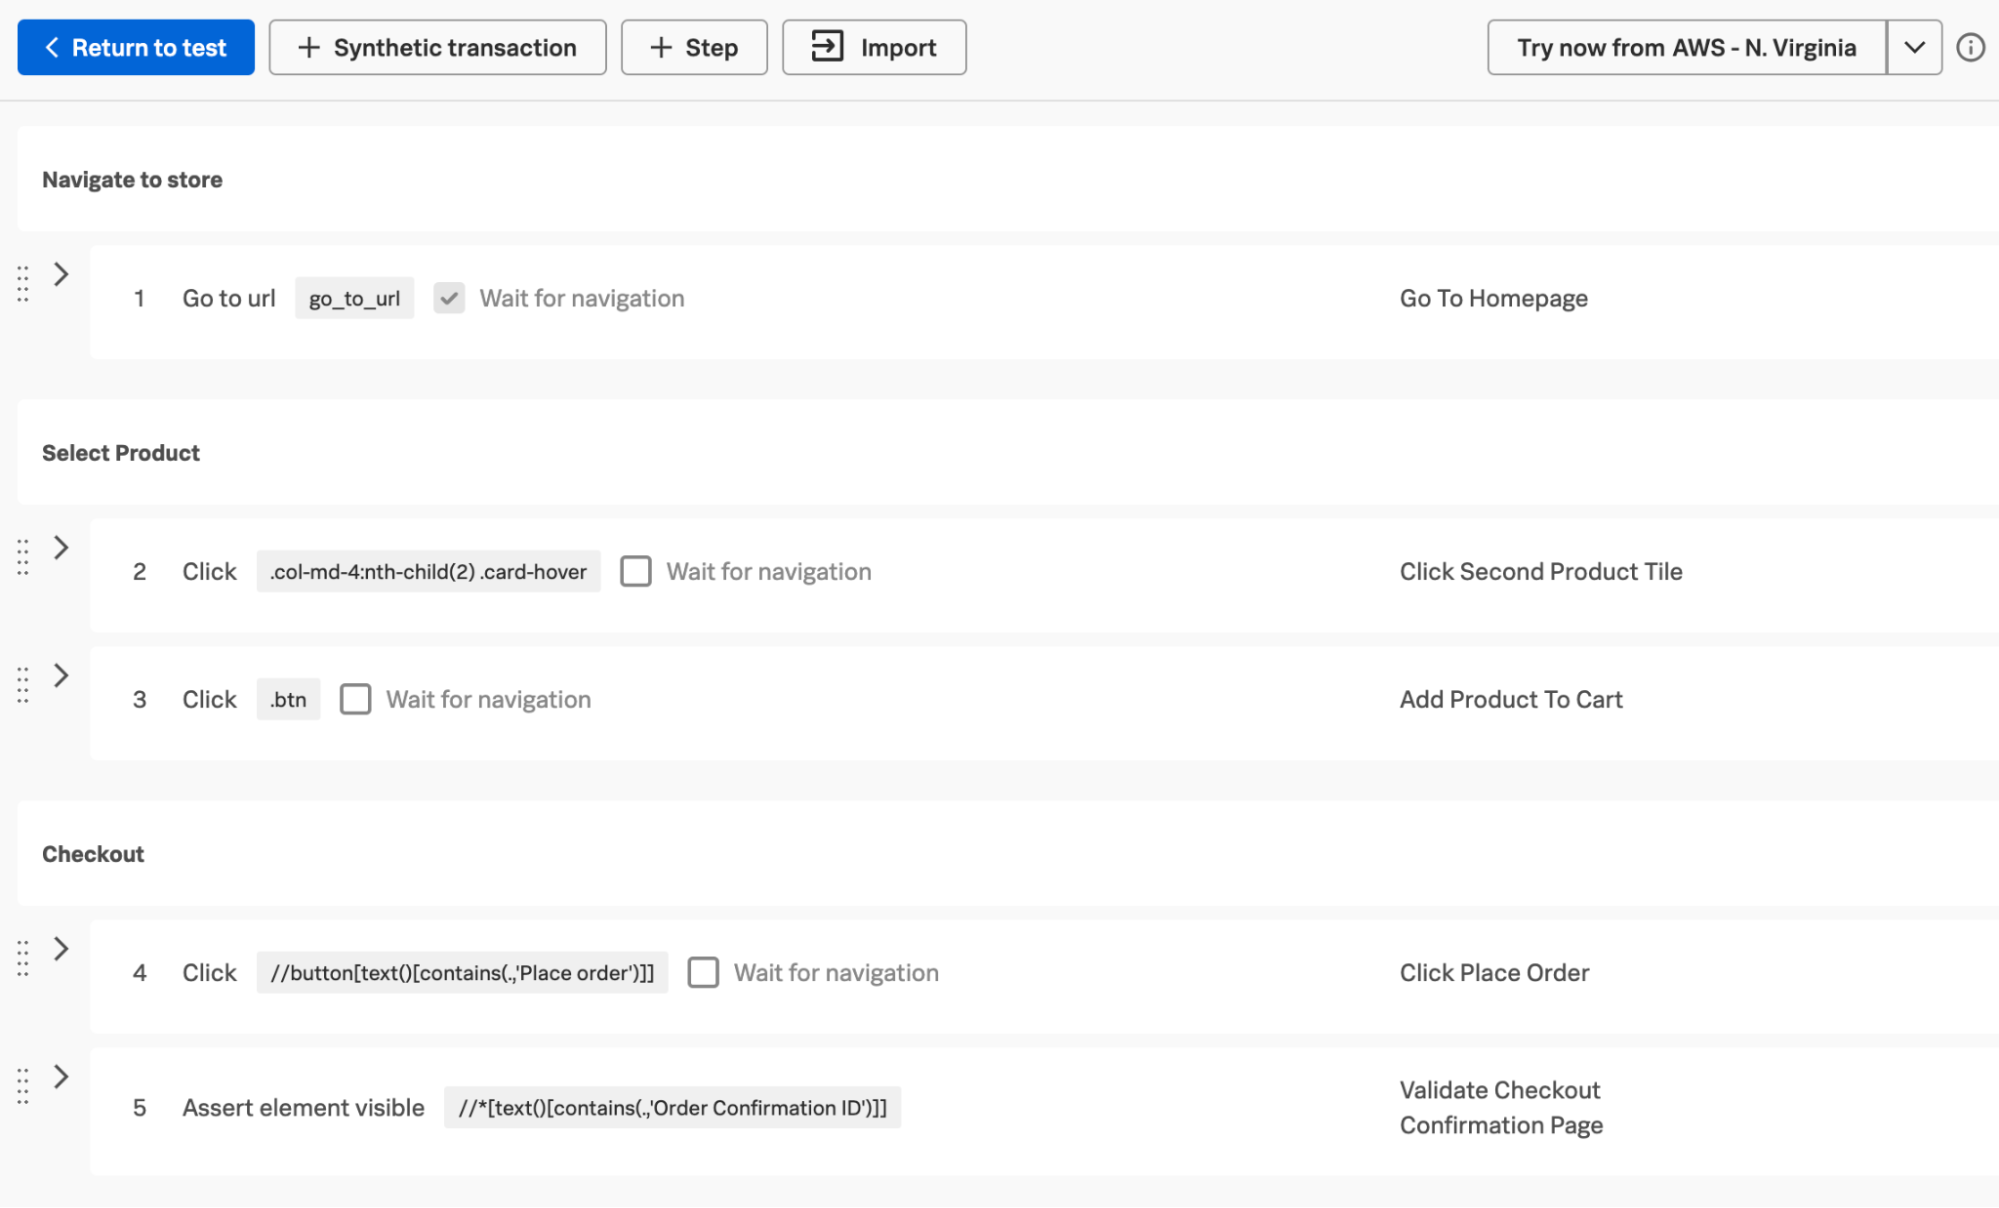
- Add readable step names so that issues are easier to identify and troubleshoot.
- Review the step selectors and pick the most robust options possible. Remember to review selector tips in Lantern.
- Complete the journey: make sure the last step validates the completion of the user workflow. So rather than end a login test with submitting the login form, add a step to validate the view an authenticated user would see.
- Grouping test steps into transactions allows you to understand not only what step failed in a test, but also monitor and alert on what part of the user journey was affected.
- After you build your test in Synthetics, run "Try now" from any location to validate the test before it starts running. You'll get a replay of the test and exactly where it failed, so that if there is a typo or brittle selector for example, you can fix the test before activating it.
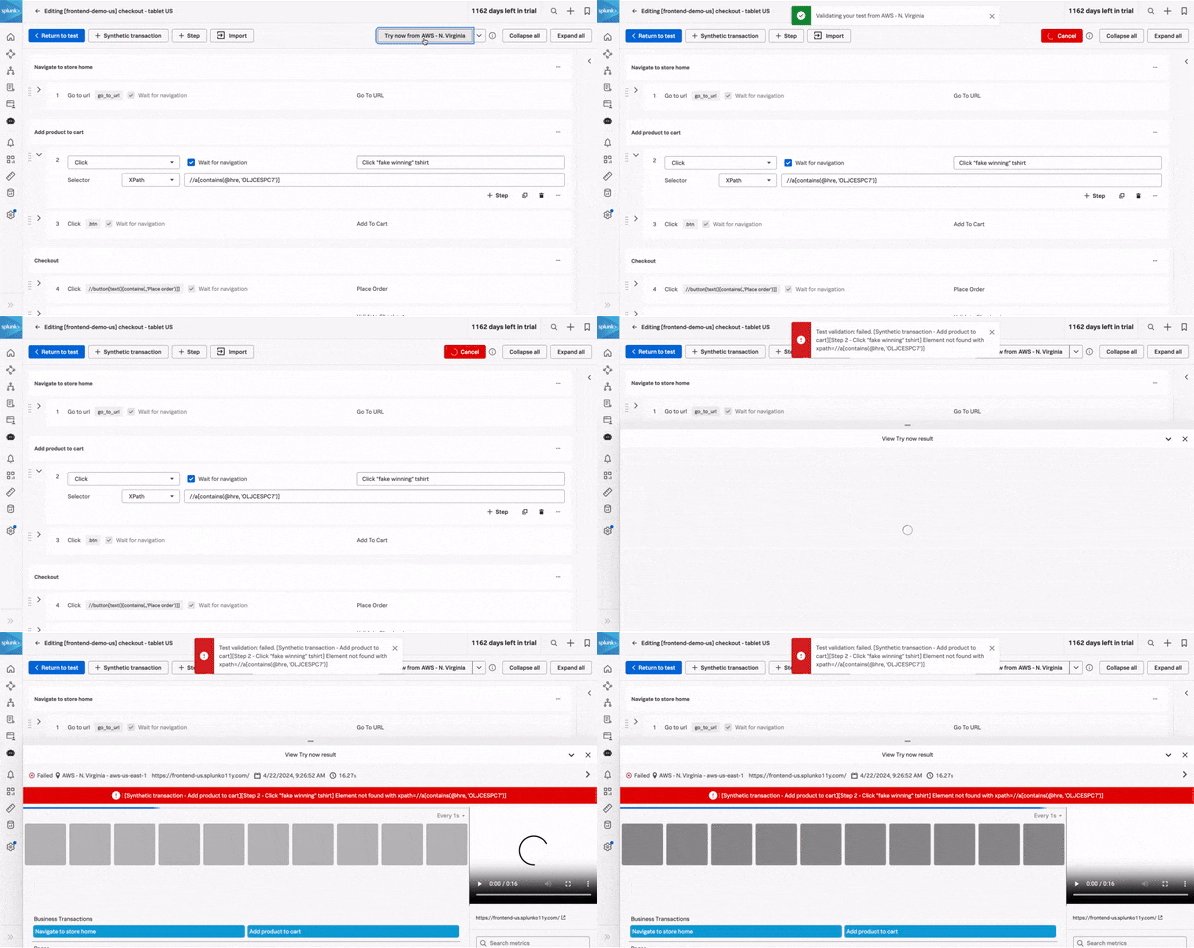
- Once you have validated that the test is reliable, return to the test configuration page and save your test!
Review test results to see if there is an issue with third-party resources, bloated content, or clues to backend issues. Use the transactions to better understand where in the user journey there is room for improvement.
Get The Most Out Of Synthetic Testing With Splunk Observability
In Splunk Synthetic Monitoring, test results are automatically shown in context with your RUM and APM data instrumented in the same app. So what can you do to get the most value out of Synthetics?
- Proactively test the front end in PROD and pre-PROD to increase the chance you will learn about a first- or third-party resource outage or latency before real users are affected.
- Cut down on MTTR by understanding if your Synthetics test has captured a frontend clue to a backend issue, quickly diving from Synthetics to the specific trace in APM. And with Related Content, all relevant log, infrastructure, service, and frontend data is at your fingertips.
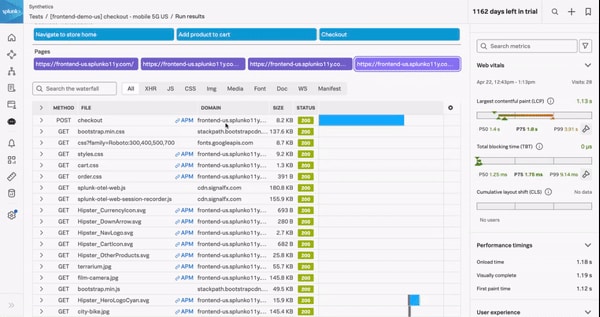
- Directly compare Synthetic test results to real user experience to understand the impact of issues. Click through to see relevant RUM sessions: did your test catch something obscure or something your users are starting to experience? How does the test condition compare to the real user demographic; what is the scope of impact on your end users?
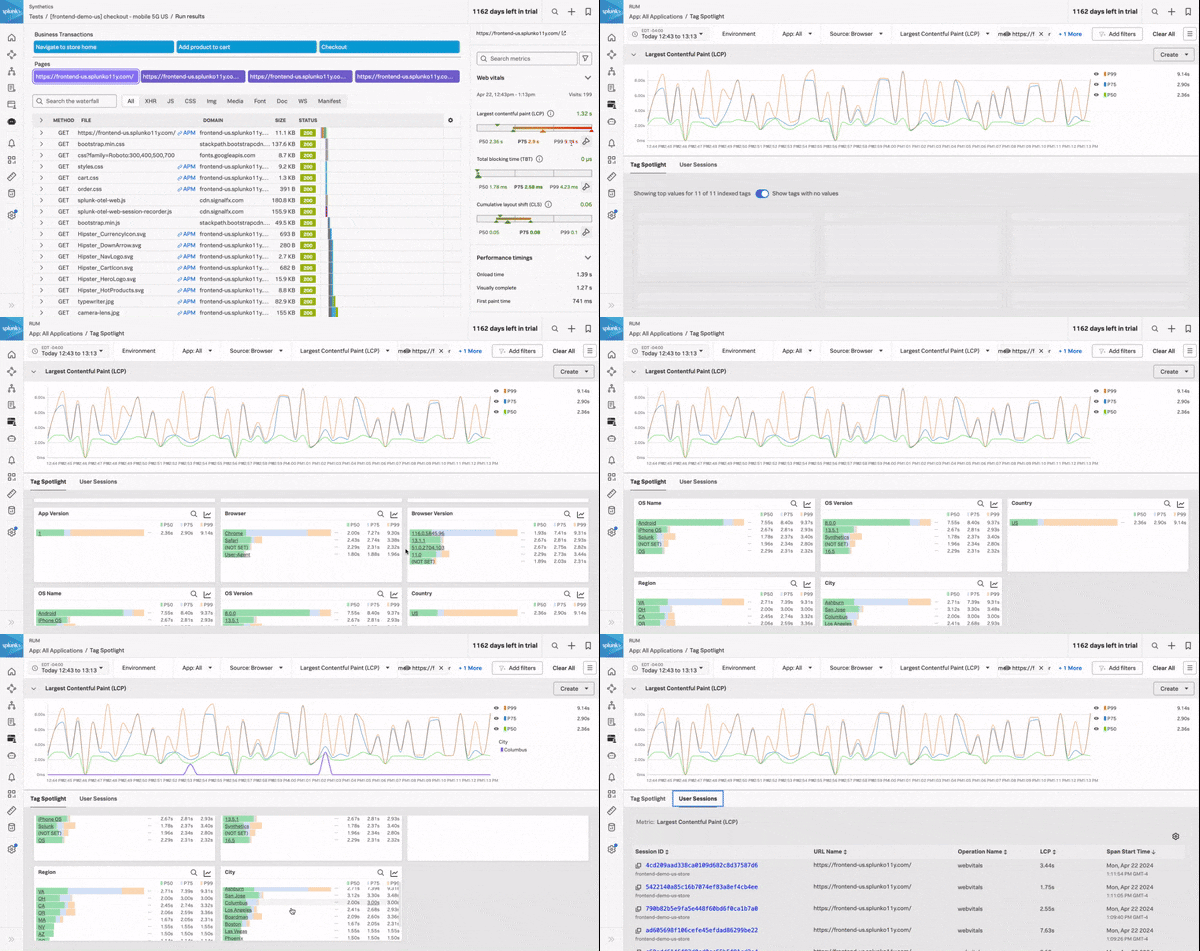
So not only do you get coverage of your first- and third-party resources to understand the end user's experience, but you also get immediate related information about your real users and backend services. When that happens, understanding the context for your real users helps triage issues.
Following Up On Tests
Monitor your app, make improvements, document those improvements, and iterate on your tests. View your KPIs in context with events like code deployments. Push custom events to your observability dashboards via GUI or via API so it's easier to understand if changes might relate to your events.
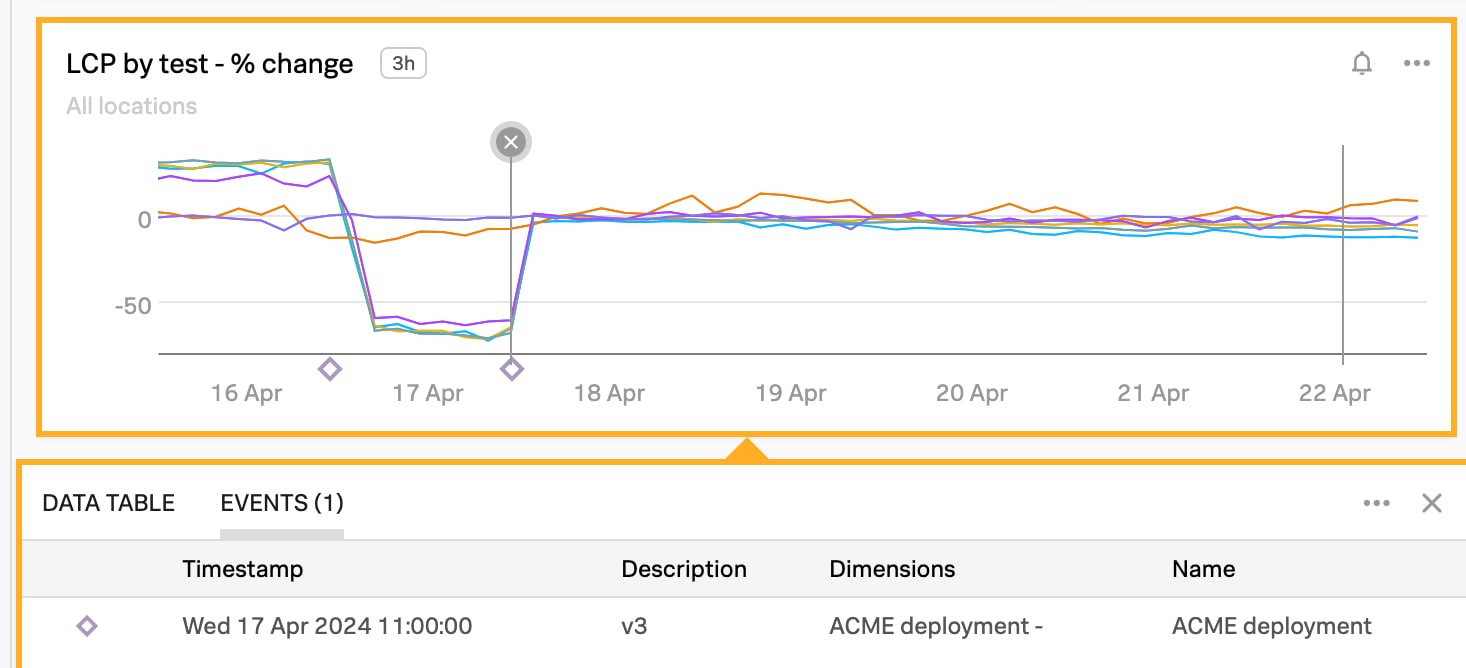
Performance is an ongoing project. There are always new variables being brought into play, new features on the horizon, and new technologies to keep up with. Set static or dynamic detectors on your KPIs so you can be alerted as soon as something is out of its expected range. Detectors can be created for an individual test, or, my favorite: created on custom dashboard charts.
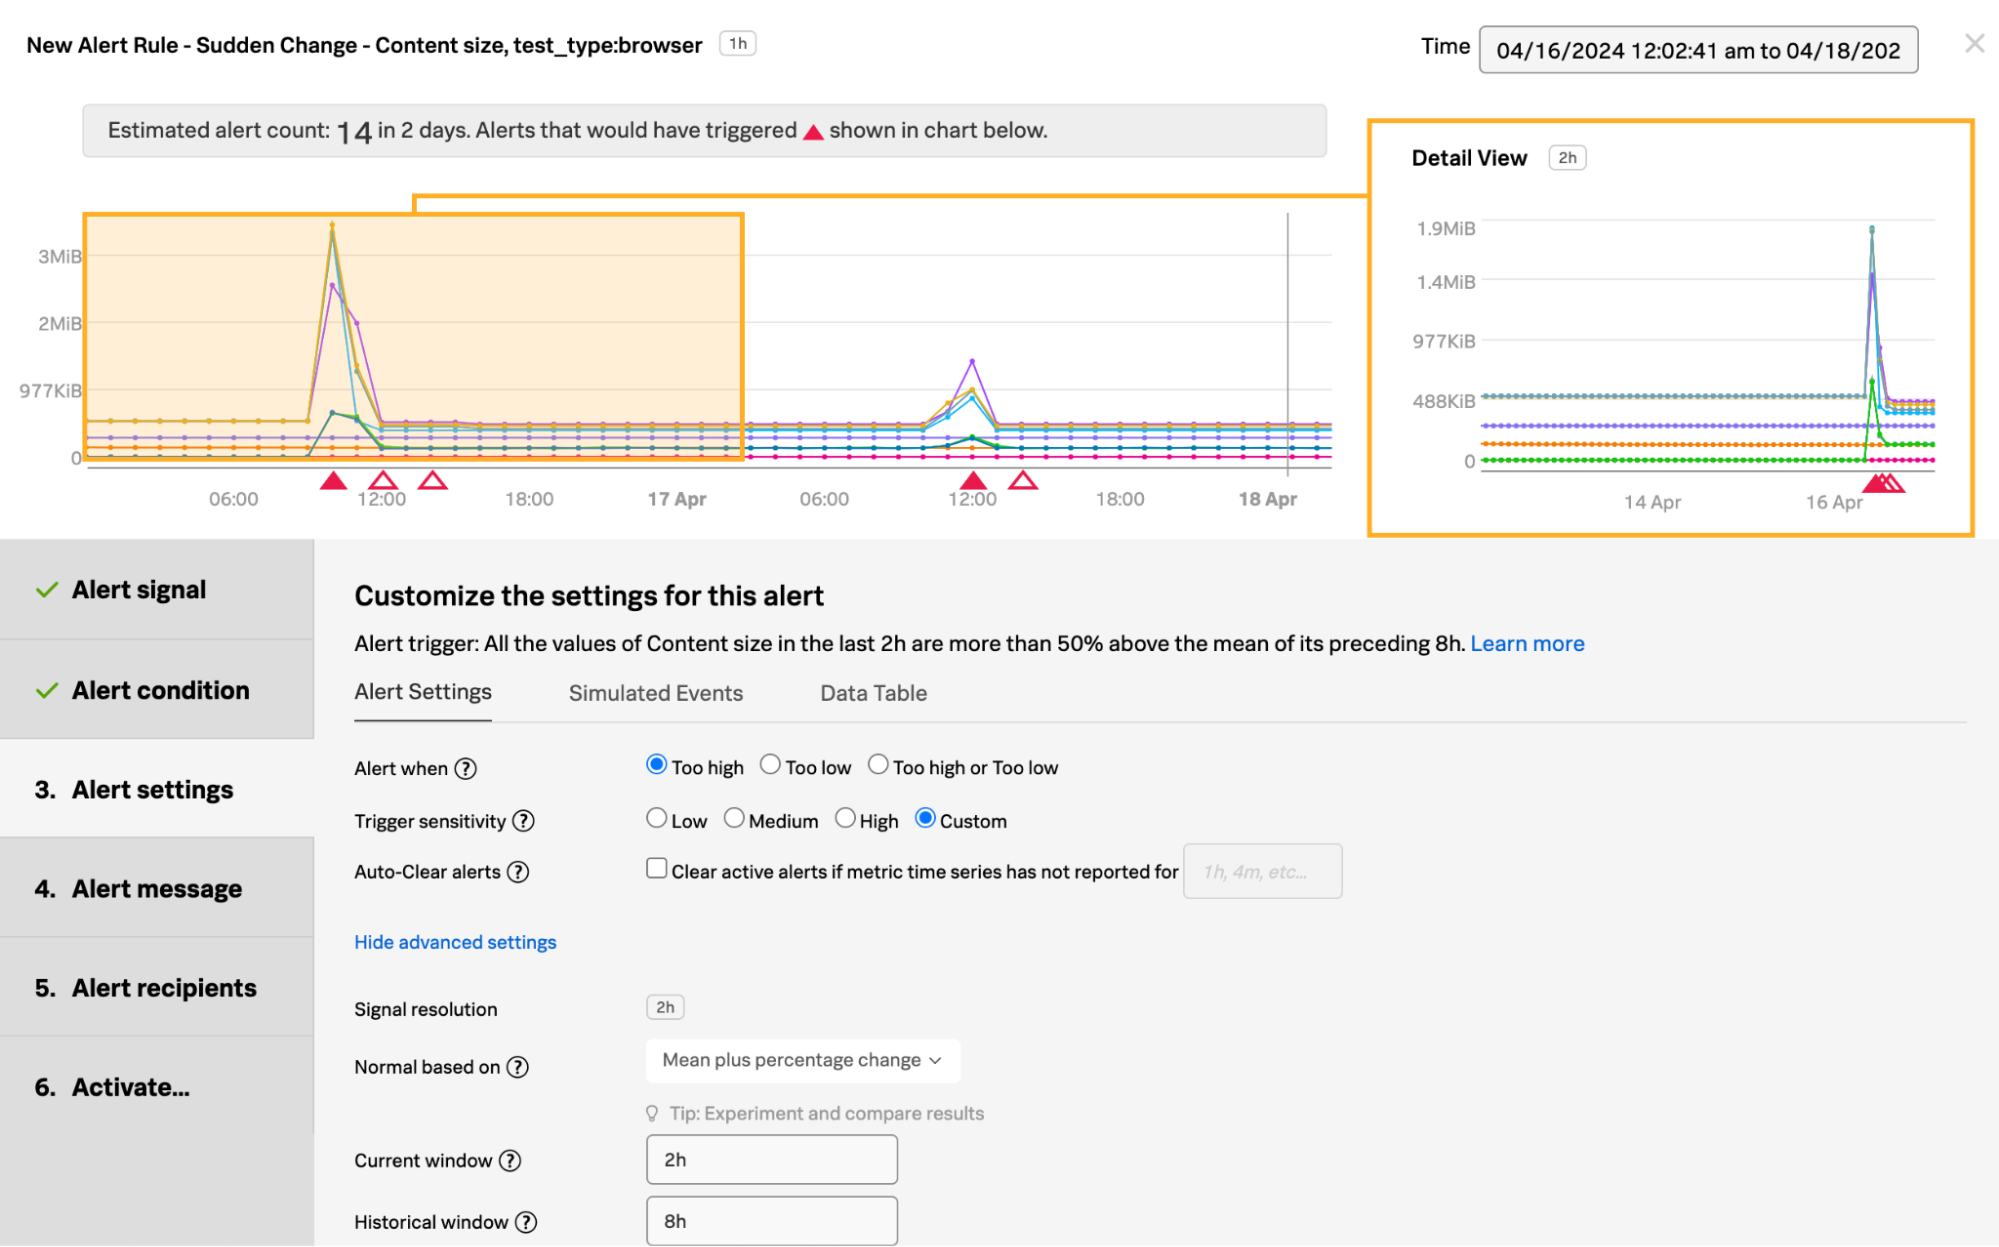
If you want to automate more, go beyond just alerts and integrate synthetic testing with your CI/CD, leverage webhooks and the API to trigger automation in your workflow based on your performance budget. Consider making more advanced tests, such as using custom headers for A/B performance testing.
Did you reach a new performance goal due to changes in a recent release? Celebrate it! Present it internally: the before state, the work put into identifying and implementing improvements, the new state, and the impact on the business. Acknowledge who contributed and what the next steps will be.
Ready to start proactively optimizing your end-user experience with Splunk Synthetic Monitoring? Get started with a free trial today and discover how Splunk can help you test your critical user journeys to ensure optimal performance.
Related Articles
About Splunk
The world’s leading organizations rely on Splunk, a Cisco company, to continuously strengthen digital resilience with our unified security and observability platform, powered by industry-leading AI.
Our customers trust Splunk’s award-winning security and observability solutions to secure and improve the reliability of their complex digital environments, at any scale.


