Debugging Microservices with Distributed Tracing and Real-Time Log Analytics

 As more organizations adopt DevOps disciplines and develop applications in today's cloud age, they are quickly migrating from typical monolithic deployments to a microservices approach. While a microservices-based deployment can offer organizations improved scalability, better fault isolation and architectures agnostic to programming languages and technologies, the primary benefit is a faster go-to-market.
The flexibility of a microservices-based application architecture allows for easier and faster application development and upgrades. Developers can quickly build or change a microservice and plug it into the architecture with less risk of coding conflicts and service outages. But with all of these benefits come a new set of challenges.
Want to skip the reading and experience it for yourself? Start a trial instantly.
What Challenges Can Microservices Bring?
As the number of microservices increases, managing them can become difficult. Best practices show that DevOps engineers should plan microservices management before or while being built. While the modularity helps, things can very quickly get out of hand if not managed well. Engineering leaders have stated that the mismanagement of these services is a problem similar to those faced during the initial stages of the transformation from monolithic applications.
What Is Distributed Tracing, And How Can It Help My Microservice Deployment?
Distributed tracing follows a request (transaction) as it moves between multiple services within a microservices architecture allowing engineers to help identify where the service request originates from (user-facing frontend application) throughout its journey with other services. This type of visibility allows DevOps engineers to identify issues quickly, affecting application performance.
How Do We Do It?
Our approach to building an observability solution for microservices is fundamentally different. Splunk APM uses all your data and leverages our unique full-fidelity NoSample™ ingestion to analyze and store all traces in our cloud. This "Observe Everything" approach delivers distributed tracing with detailed information about your request (transaction) to ensure you never miss an error or high-latency transaction when debugging your microservice. We also embrace open standards and standardize data collection using OpenTelemetry so that you can get maximum value quickly and efficiently while maintaining control of your data. Splunk APM is the future of data collection, standardizing access to all telemetry data and helping organizations avoid vendor lock-in.
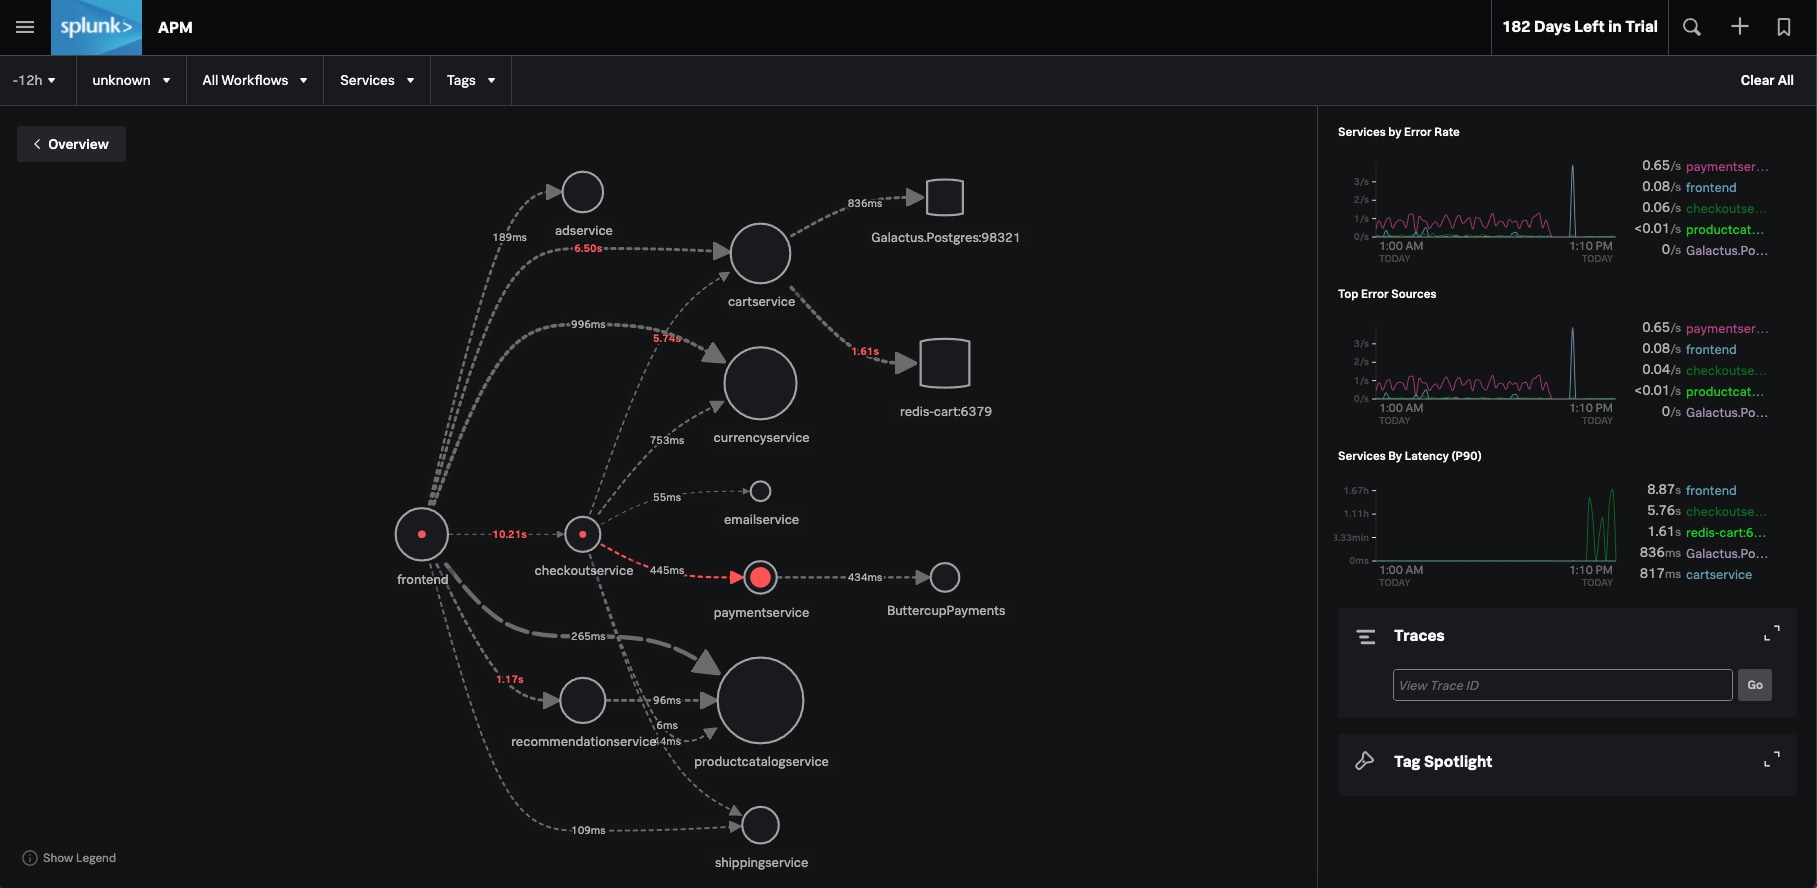
Our dynamic service map is just one example of how Splunk APM makes it easy to understand service dependencies and helps you debug your microservices more quickly. It is automatically generated and automatically infers services that are not explicitly instrumented, including databases, message queues, caches and third-party web services. You can easily search across all traces, slice-and-dice to view metrics for inferred services and view traces that span inferred services. Root cause error mapping with our dynamic service map also makes things easy when debugging a microservices-based deployment. Unique to Splunk APM is our AI-Driven Directed Troubleshooting, automatically providing SREs with a solid red dot indicating which errors originating from a microservice and which were originated in other downstream services.
Here is an example of distributed tracing in action with Splunk APM’s dynamic service map from an online retailer with a microservices-based eCommerce site. Note how the dynamic service map breaks down all dependencies for each microservice’s latency between each request and monitors alert status. You also have a quick summary of each service by error rate, top error sources and service by latency (P90).

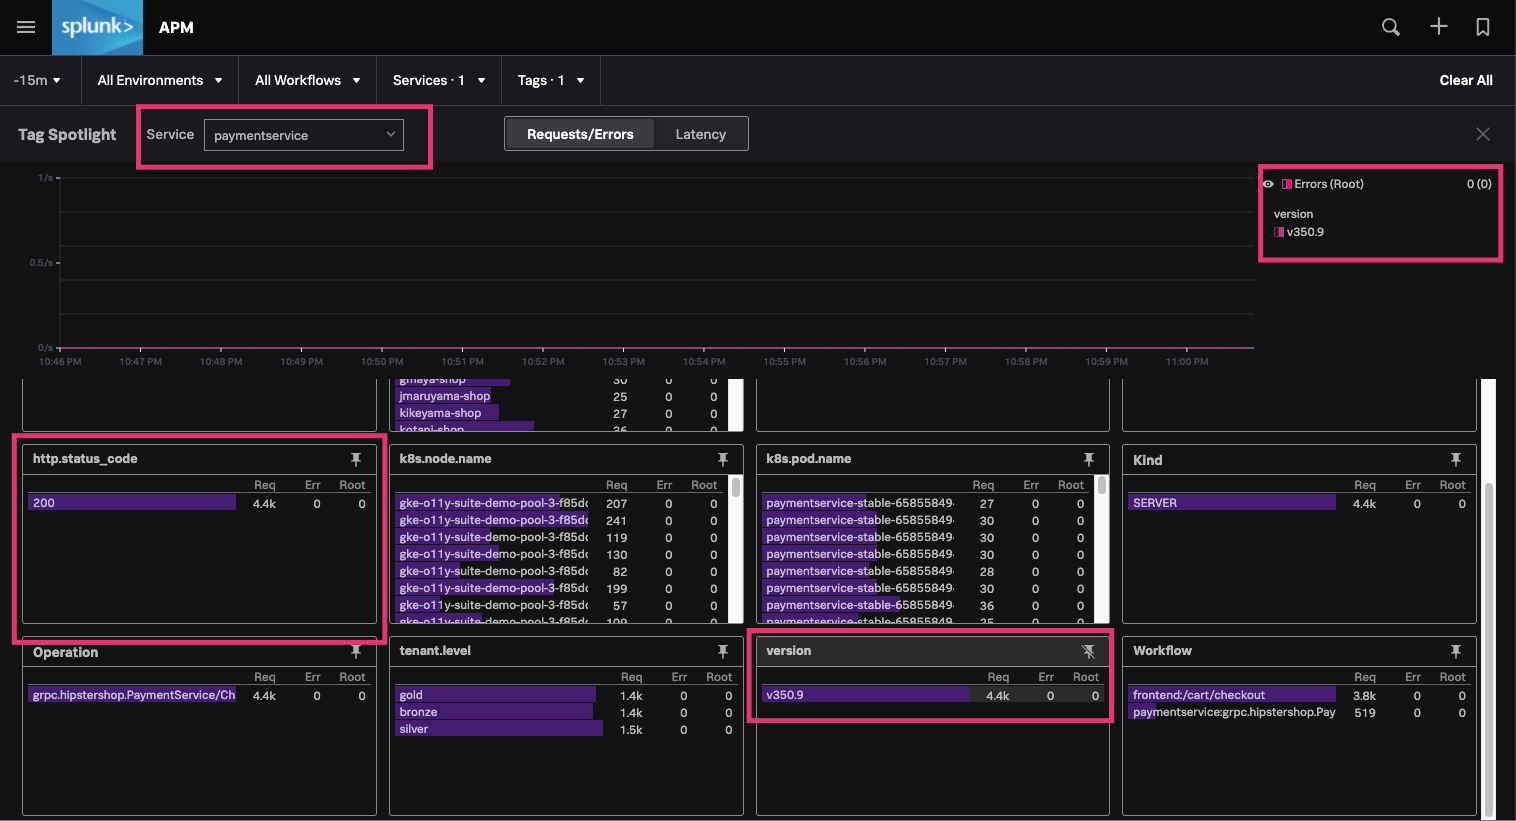
In addition to our dynamic service map, another example of how Splunk APM can help you debug microservices faster is Tag Spotlight. Tag Spotlight is a one-stop solution to analyze all infrastructure, application and business-related tags (indexed tags). It significantly cuts down the amount of time to determine the root cause of an issue, from hours to minutes. It breaks down SLIs by individual tag values, making it easy to correlate peaks in latency and errors with specific tag values, all within a single pane of glass.
In the example below, Tag Spotlight shows metrics for the paymentservice microservice. We can see from the screenshots successful POSTs to the third-party payment service API, ButtercupPayments, before the v350.10 code change.
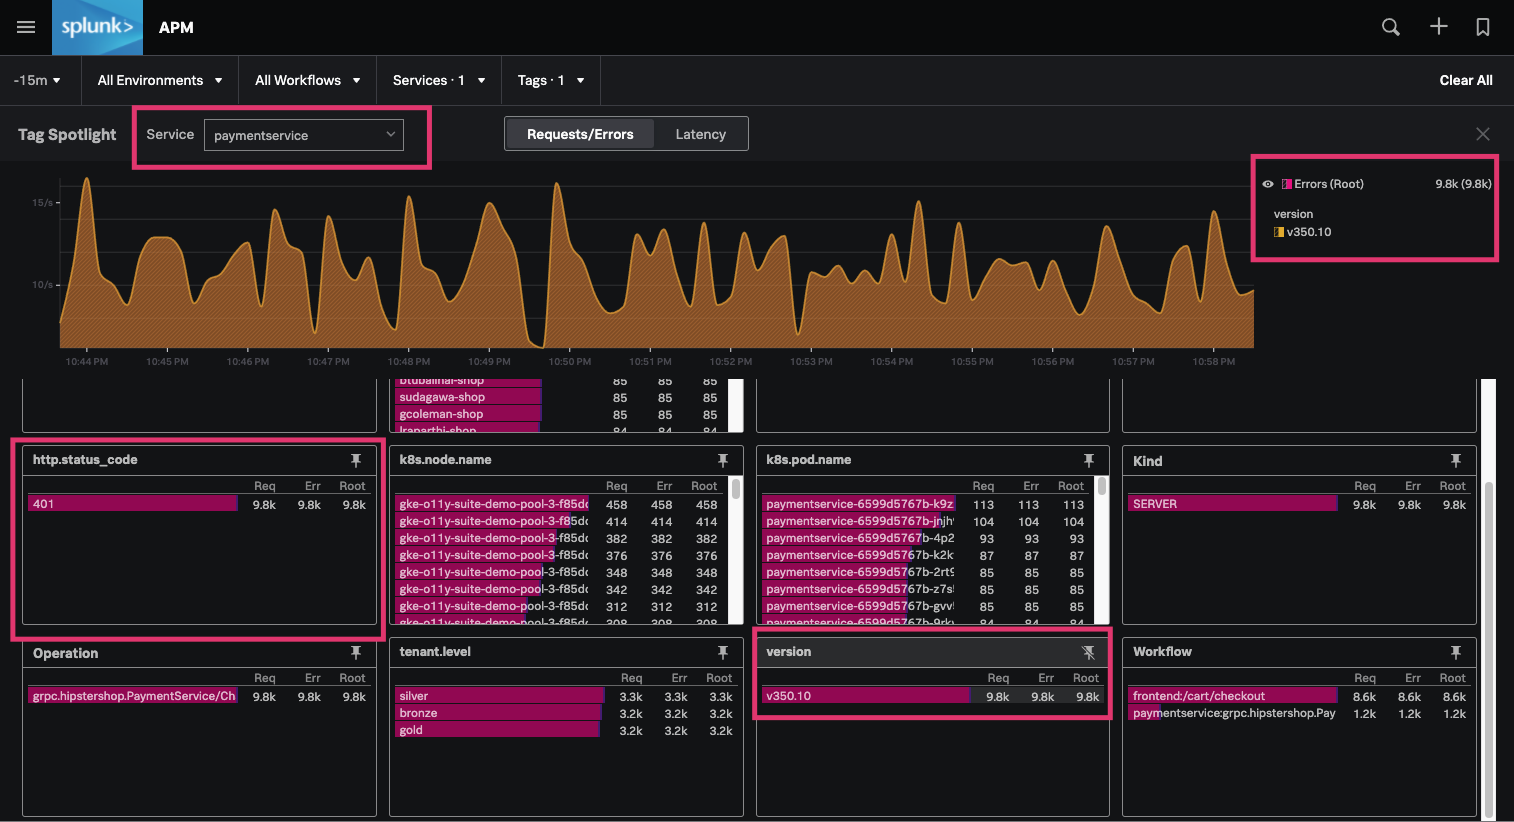
After code change (v350.10) - Note the increase in 401 errors in the HTTP status codes.
From within Tag Spotlight, you can easily drill down into the trace after the code change to quickly view example traces and dive into the details affecting the paymentservice microservice.
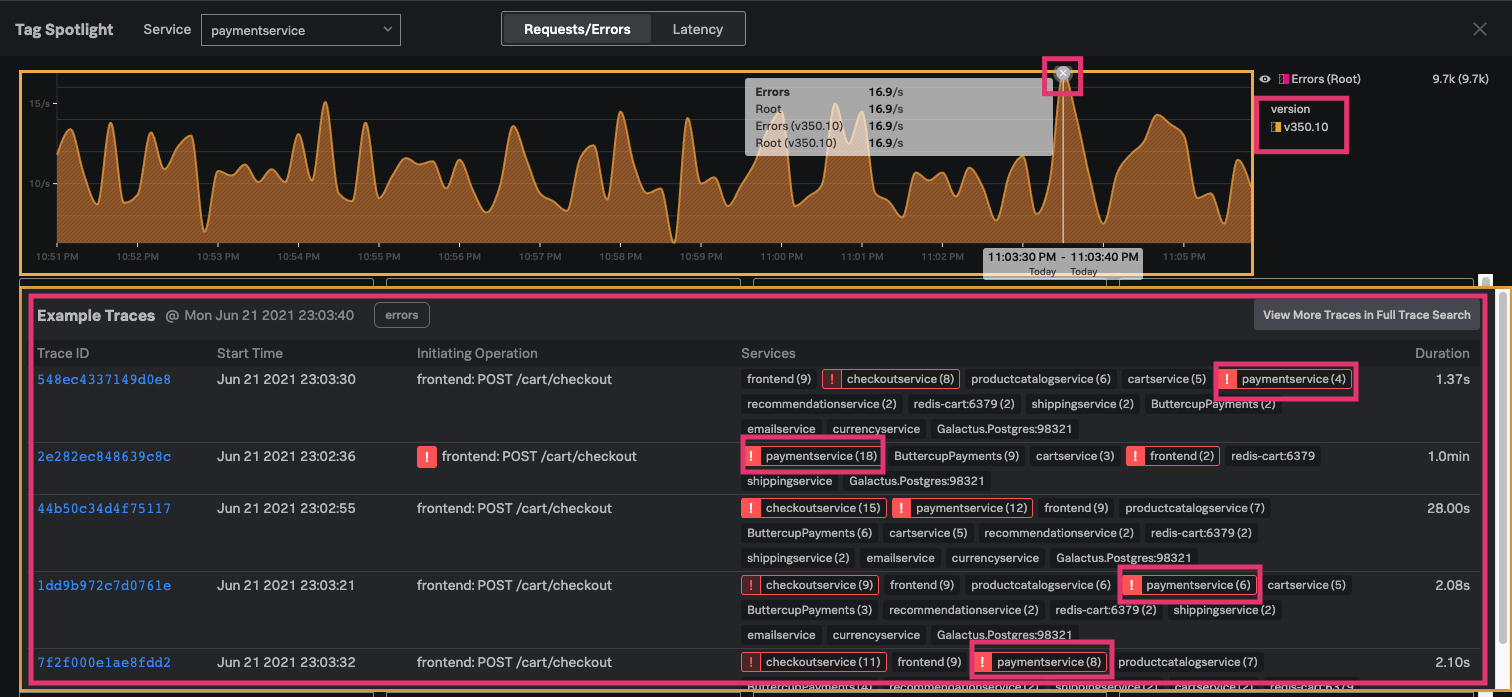
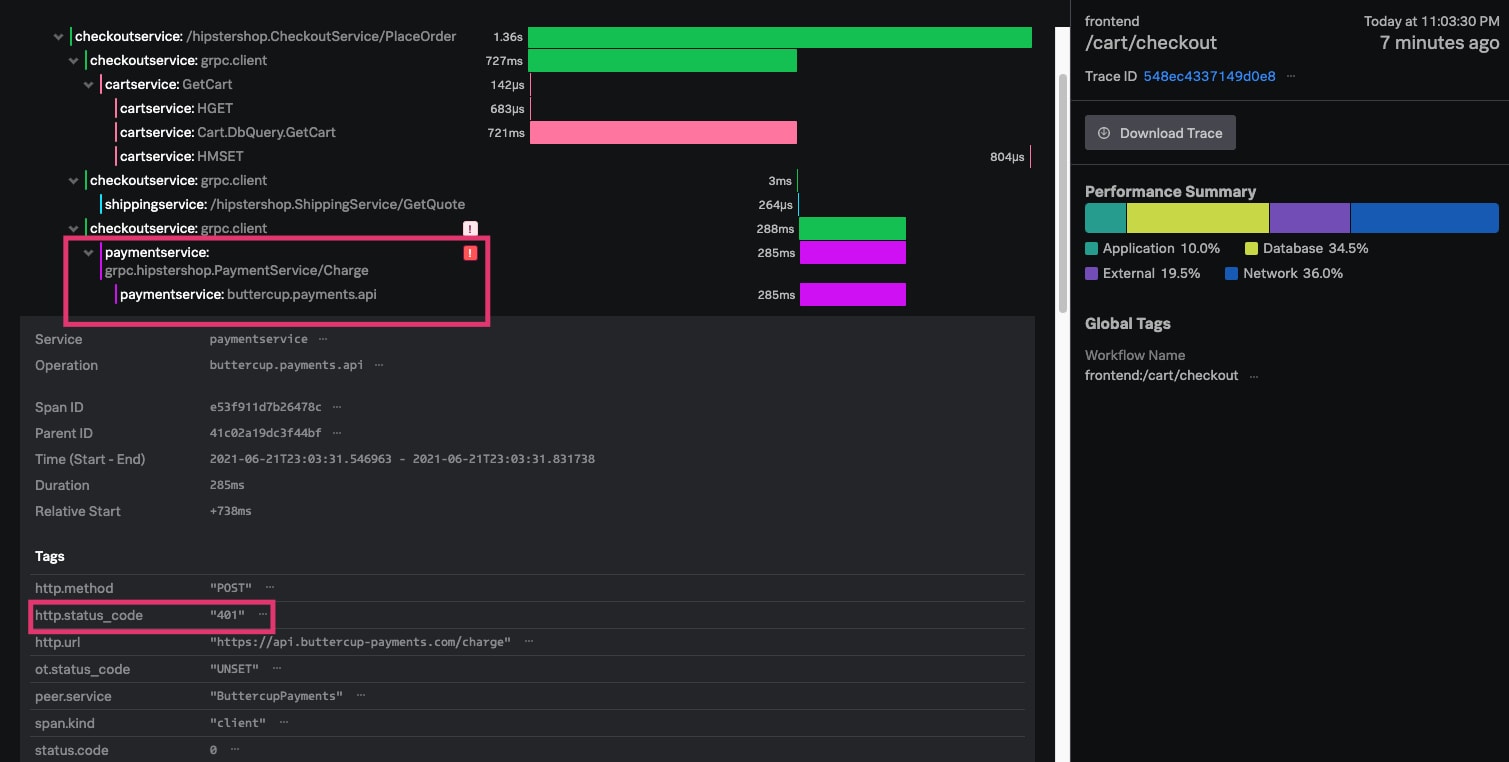
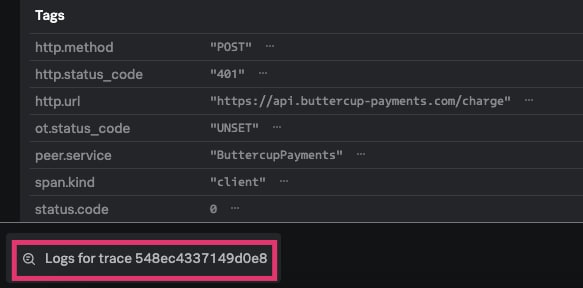
After selecting one of the traces, we quickly see that the ButtercupPayments API shows a 401 HTTP status code. With Tag Spotlight, it’s possible to go from problem detection to pinpointing the problematic microservice in seconds.
How Can We Quickly See the Why?
Splunk Log Observer
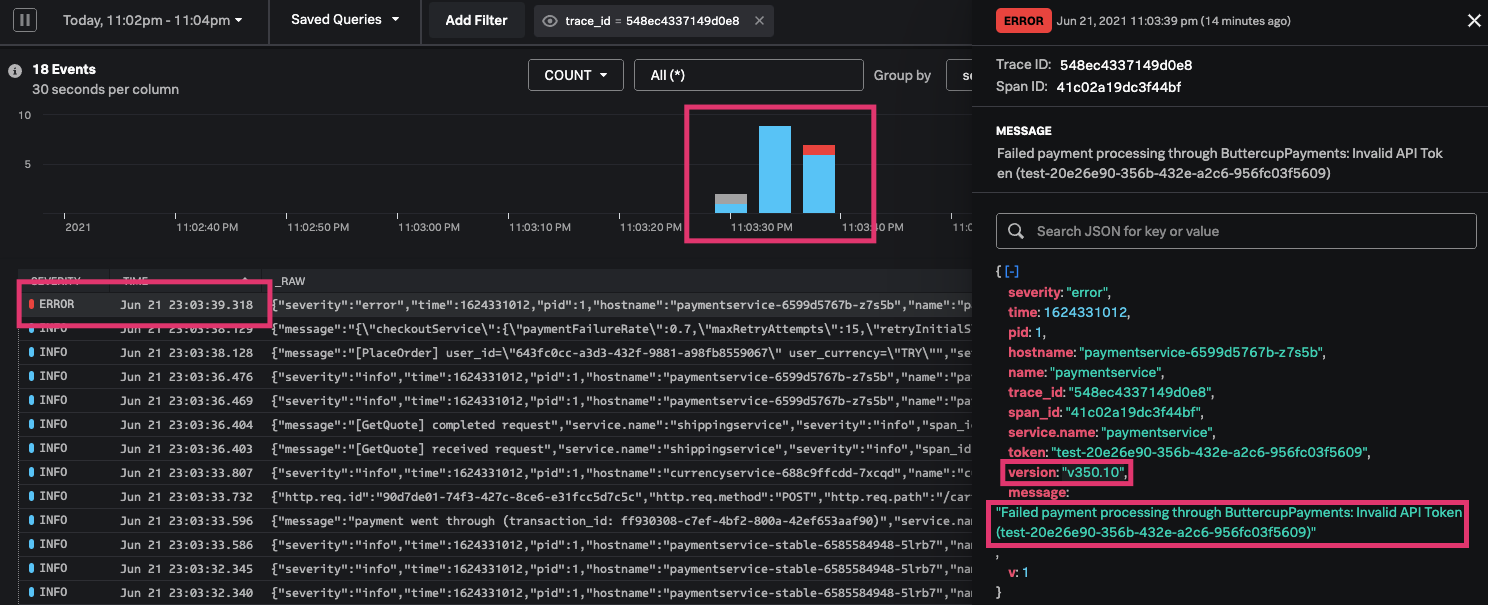
Splunk Log Observer is designed to enable DevOps, SRE, and platform teams to understand the “why” behind application and cloud infrastructure behavior. Let’s take a look at a quick example of Splunk Log Observer in action to help identify why we are experiencing a 401 HTTP status code with our most recent code push. From within Splunk APM, we quickly located the trace showing the 401 HTTP status code. Splunk Log Observer’s native integration to other Splunk Observability Cloud services like Splunk APM easily allows you to inspect logs from the selected trace. The screenshot shows the “Logs for trace 548ec4337149d0e8” button from within the selected trace to inspect logs quickly.
We can see from the logs within the timeframe the code was deployed showing a failed payment due to an invalid API token. A quick inspection of the API token indicates that the word “test” is present on the token resulting in restricted access to the Buttercup Payments API. Now that they identified the root cause of the issue, the developers can easily go ahead and fix it.
Troubleshooting issues in a microservices-based environment using legacy monitoring tools would have required a large team of engineers to spend several hours sifting through separate data sets and manually correlating data. With Splunk, a single person can easily identify the root cause in a matter of minutes. For SREs this means reduced stress and achieving better MTTRs. For developers, this means more time focusing on creating new features. And for users, this means fewer glitches in the product and an overall better experience.

How Can I Get Started with Splunk APM and Splunk Log Observer?
Splunk APM and Splunk Log Observer are part of Splunk Observability Cloud. You can sign up to start a free trial of the suite of products – from Infrastructure Monitoring and APM to Real User Monitoring and Log Observer. Get a real-time view of your infrastructure and start solving problems with your microservices faster today.
----------------------------------------------------
Thanks!
Johnathan Campos
Related Articles
About Splunk
The world’s leading organizations rely on Splunk, a Cisco company, to continuously strengthen digital resilience with our unified security and observability platform, powered by industry-leading AI.
Our customers trust Splunk’s award-winning security and observability solutions to secure and improve the reliability of their complex digital environments, at any scale.
