Data Storage Costs Keeping You Up at Night? Meet Archived Metrics

We all have been there! Getting the largest metrics plan available, turning on real-time monitoring, and…. You know what happens next… BIG BILL!
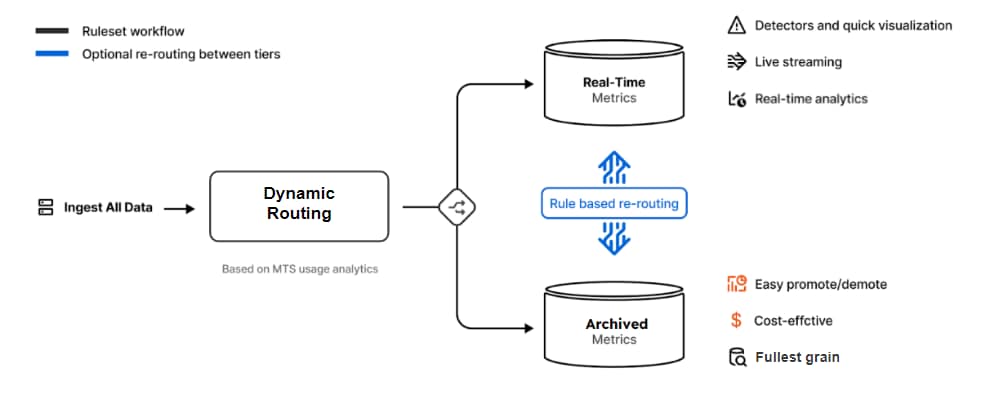
With the explosion of telemetry from microservices, containers, and cloud stacks, engineering teams often have to choose between data and budget. To help our Splunk champions, we are introducing Archive Metrics to make storing data up to ten times cheaper. Available within Splunk’s Metrics Pipeline Management, Archived Metrics is a new capability that allows you to dynamically route your less critical metric series data into low-cost cold storage, without any agent or code changes.
With the release of Archived Metrics, you get to pick and choose which metrics you want to keep for real-time analysis and which ones you want to store in cheap storage, for better cost control and data management.
1. Rising Observability Data Volume Has Become a Cost Problem
Telemetry has never been so important for troubleshooting, and yet so costly at the same time.
As your organizations scale, your data needs grow significantly, leading to more operational data management. This is particularly true today when businesses increasingly migrate to the cloud and deal with hundreds of microservices and containers. As a result, monitoring costs are skyrocketing and engineering teams face a poor monitoring experience due to performance latency in their metrics and analytics solution. On top of this, budgets are tighter than ever, and engineering teams are under constant scrutiny to limit their monitoring bills.
At Splunk, we believe no organization should have to choose between data and costs.
2. Control and Optimize Data Volume With Metrics Pipeline Management
To help balance metrics data and your monitoring costs, Splunk released Metrics Pipeline Management in 2023.
Available in Splunk Infrastructure Monitoring, Metrics Pipeline Management (or MPM) is a capability that allows flexibility and choice to control metrics data at the point of ingest, without re-instrumentation. With a UI or API approach out-of-the-box, Platform Engineers have the ability to create aggregations on specific metrics identified and filter any unused data using dynamically-defined policy rules.
With aggregation features, engineers can convert high cardinality metrics to lower cardinality by aggregating away unwanted dimensions. Data drop rules help discard unnecessary metrics before they are stored, all done quickly and easily in the interface without any configuration changes at the collection point.
Metrics Pipeline Management offers Platform Engineers a simple way to unify enterprise controls and centrally manage usage and costs across teams, eliminating the need to maintain in-house solutions that create team silos. Now, organizations can scale without sacrificing budget or service reliability, while providing a self-service observability experience to their developers.

3. Keep Metrics in Low-Cost Storage With Archived Metrics
For real-time analysis, visualization, and alerting, MPM lets you route your high-value metrics into the Real-time Metrics tier where you get access to out-of-the-box features including customizable dashboards and charts with live streaming, built-in navigators, key pivoting capabilities, actionable alerts, and more. But whenever you don’t need the metrics immediately but want to keep them for future potential troubleshooting, you can leverage the newly launched Archived Metrics tier.
Archived Metrics is a cost-effective solution for storing less critical data while retaining accessibility for future troubleshooting. Priced nearly 90% lower than the real-time metrics tier, Archived Metrics ensures you never sacrifice insights for affordability. With Route Exceptions, effortlessly filter and reroute metrics data to the Real-Time tier, ensuring you have the right data at the right time.
4. A Concrete Use Case of Metrics Pipeline Management
Suppose you’re collecting transaction-level business metrics per customer. In this case, you’re likely ingesting data with high cardinality and volume, which ends up eating into your budget and results in platform performance latency. However, your business metrics might be more valuable in aggregate than in detail, meaning you could save money and improve your service reliability by optimizing your data volume.
Using Metrics Pipeline Management allows you to store high cardinality data at a 90% cheaper cost with Archived Metrics while aggregating others and keeping them at a service level for real-time monitoring. Now, not only can you drastically reduce your monitoring costs (even though you’re keeping all your data), but you’re also able to improve your query performance as the charts and detectors are operating on aggregated metrics. And thanks to the Route Exception capabilities, you’re still able to access granular customer-level data to pinpoint and resolve customer issues whenever needed.
Splunk's Metrics Pipeline Management is a flexible solution that can easily adapt to budget requirements and data needs. Now Splunk champions have more tools to control their monitoring costs, regardless of their observability size, and considerably improve the performance of their operations at scale.
Archived metrics is available today in US0 and US1 - AWS realms. Other regions will follow next. Learn more about Archived Metrics or try it out for 14 days for free with Splunk Observability Cloud! New to Observability? Check out our illustrated guide: How To Explain Observability to a Child.
Related Articles
About Splunk
The world’s leading organizations rely on Splunk, a Cisco company, to continuously strengthen digital resilience with our unified security and observability platform, powered by industry-leading AI.
Our customers trust Splunk’s award-winning security and observability solutions to secure and improve the reliability of their complex digital environments, at any scale.


