Coding Conundrums and the Rabbit Invasion: How to Avoid Disaster in Your Production Environment

Did you know that rabbits almost destroyed Australia? In the late 18th century, settlers in Australia had good intentions when they introduced rabbits to the continent. However, this seemingly innocuous decision set off a chain of events that nearly devastated Australia's ecosystem. The rapid multiplication of rabbits disrupted the balance of nature, causing widespread ecological problems.
Similarly, when your development team implements new features, adjusts configuration settings, or updates access controls in the application, these changes, although well-intentioned, can lead to unforeseen and significant consequences once deployed in a Production environment. Just as the rabbit overpopulation altered the Australian landscape, a poorly scrutinized feature or seemingly minor modification can reshape your application's environment. To prevent such disruptions, thorough testing and review of new code changes in lower environments are essential.
Enter Splunk Observability Cloud, a powerful tool that enables developers to proactively monitor and analyze changes in their application environment. With its suite of features, developers can gain valuable insights into their application's performance and stability thus safeguarding their digital ecosystem from unforeseen complications.
Preventing Production Disruptions: Proactive Development Strategies
Let's shift our focus to a more practical scenario: The team is on track to wrap up an exceptionally productive sprint, putting the final touches on innovative new features, when you're suddenly jolted by the sight of an alert signaling a sudden surge in errors within the application. The automatically generated Service Error Rate AutoDetector is highlighting a significant deviation from the error rate baseline of the preceding hour. How do you promptly identify the root cause and avert further disruptions?
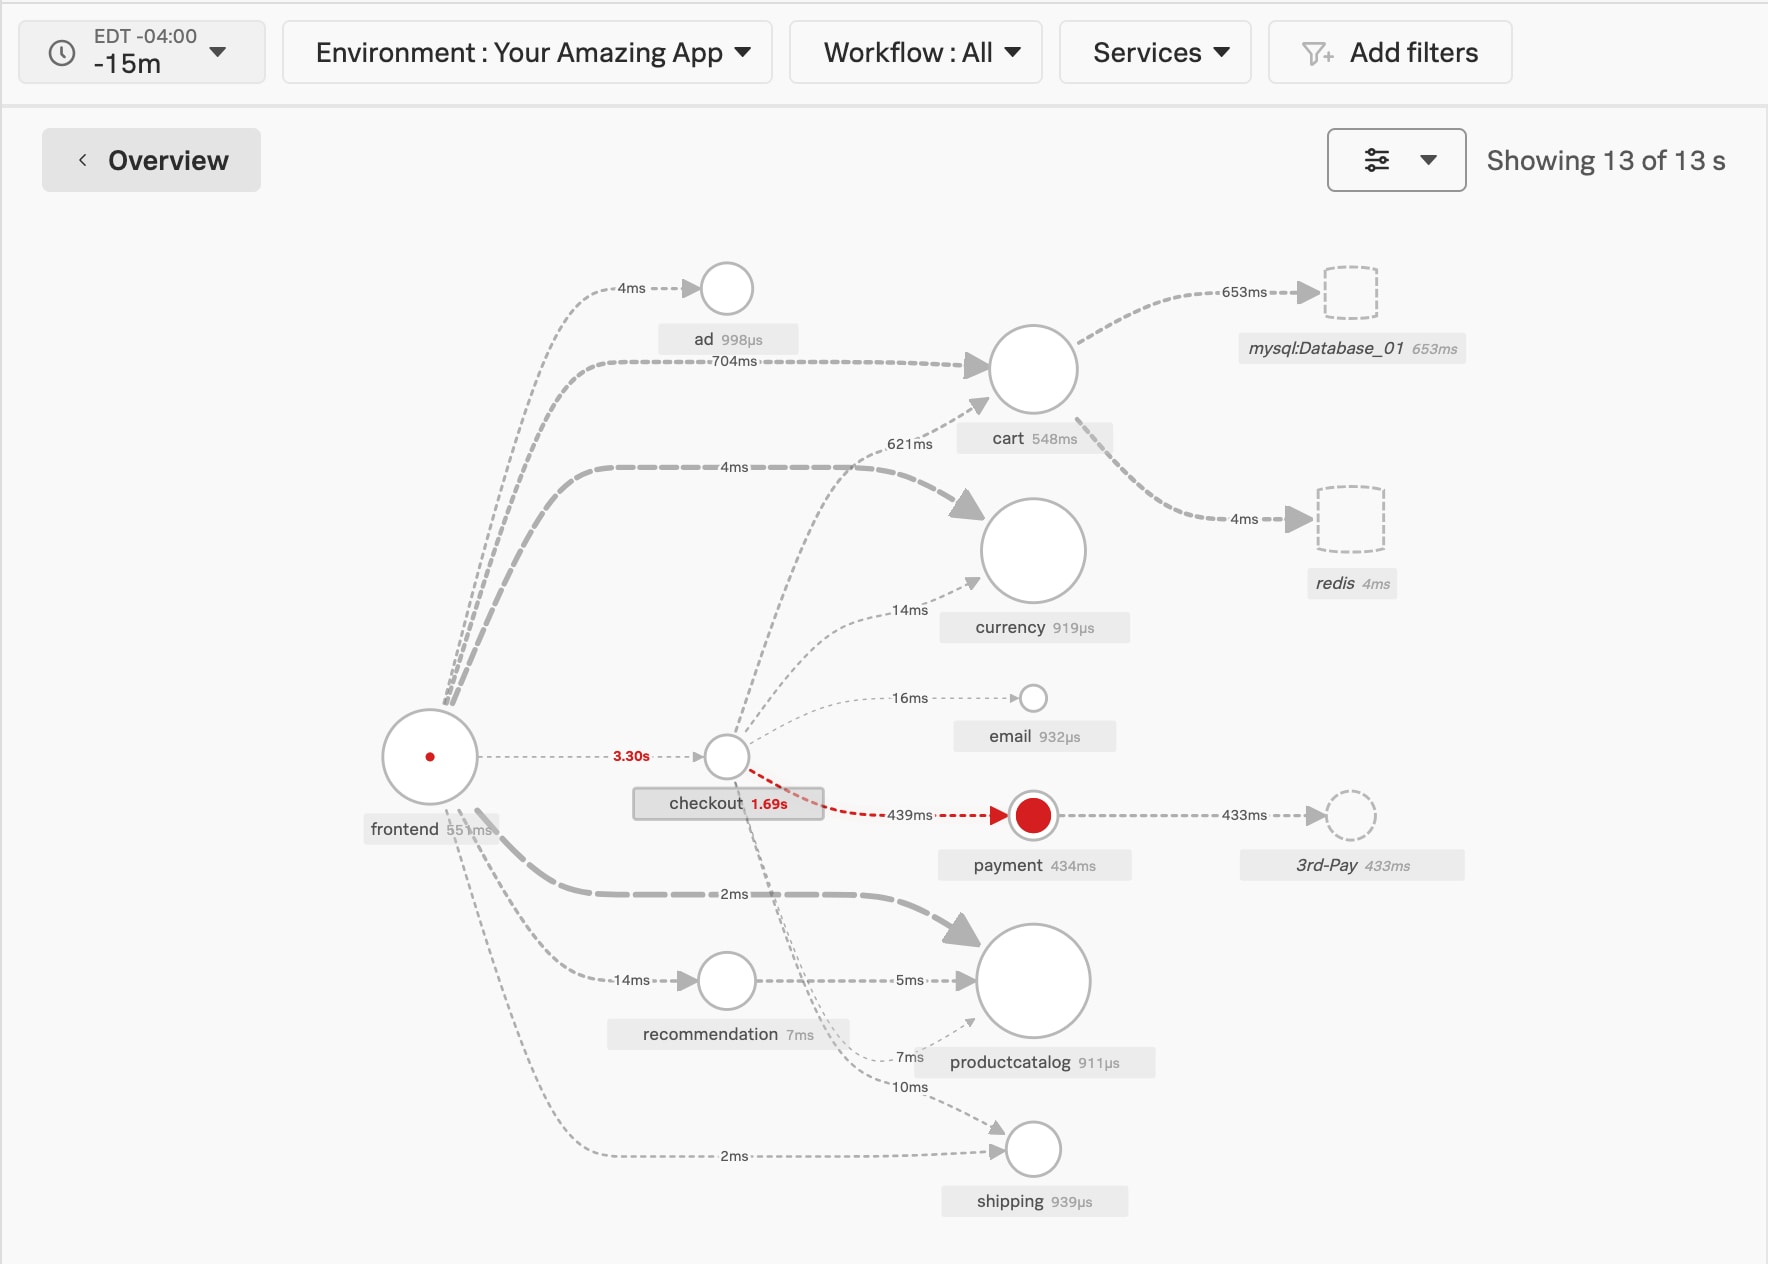
The alert indicates the issues are stemming from the Development environment, so you begin by narrowing your focus. With Splunk Observability Cloud, you have the flexibility to toggle between different environments like Development, User Acceptance Testing, Quality Assurance, and Production or view the health of environments collectively. Leveraging Splunk Application Performance Monitoring (APM)'s user-friendly Service Map visualization, you easily hone in on the payment service, launching your investigation with precision.
With a suspicion that some of the upcoming changes might be causing the disturbance, you utilize the Breakdown feature and filter by FeatureFlag, a custom tag added by the team to supplement the robust, out-of-the-box OpenTelemetry standardized metadata available in Splunk Observability Cloud.
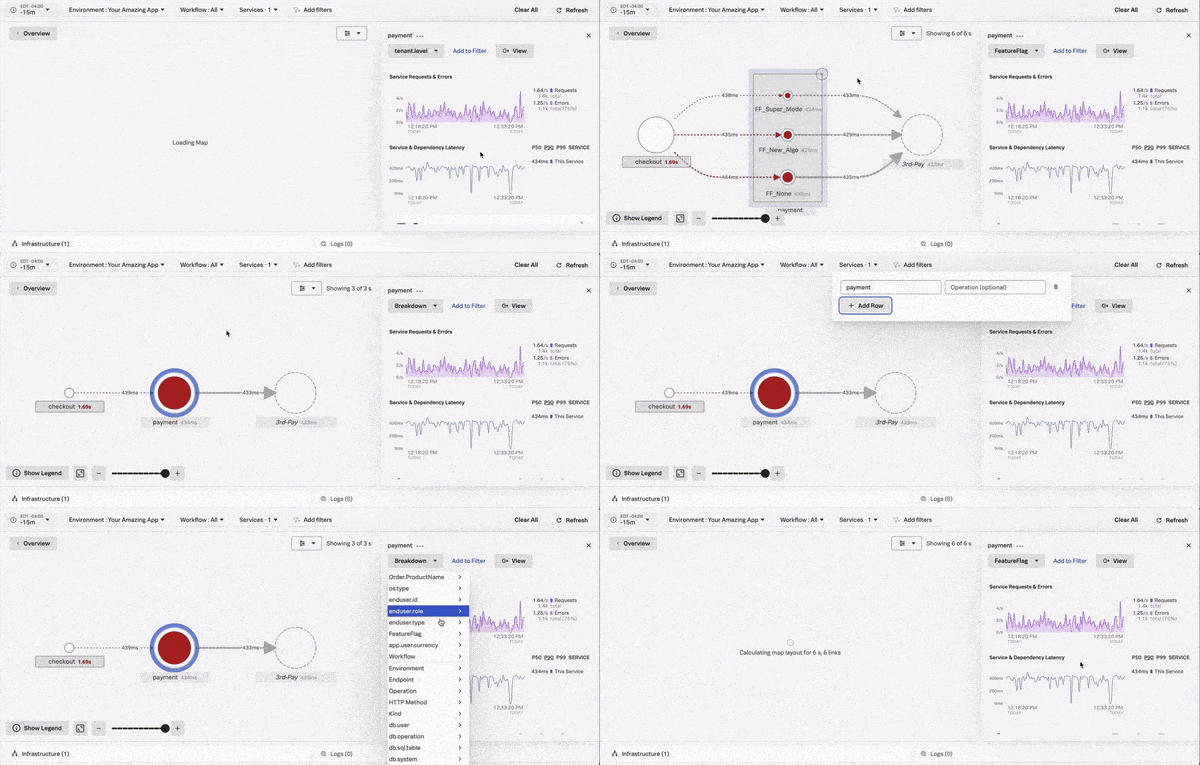
In this view, you observe that errors are not concentrated on one specific feature. Consequently, you can reasonably conclude that a new feature is unlikely the cause of the flurry of errors so you can move on to determining the true root cause.
Spotlight on Tags: Simplifying Data Organization
Tag Spotlight is a unique Splunk Observability Cloud feature leveraging indexed span tags that you can use to analyze the performance of your services and discover trends that contribute to high latency or error rates.

As you navigate from the Service Map to Tag Spotlight, Splunk Observability Cloud seamlessly integrates contextual data from the previous view. This automatic filtration ensures the investigation into the surge of errors remains unimpeded.
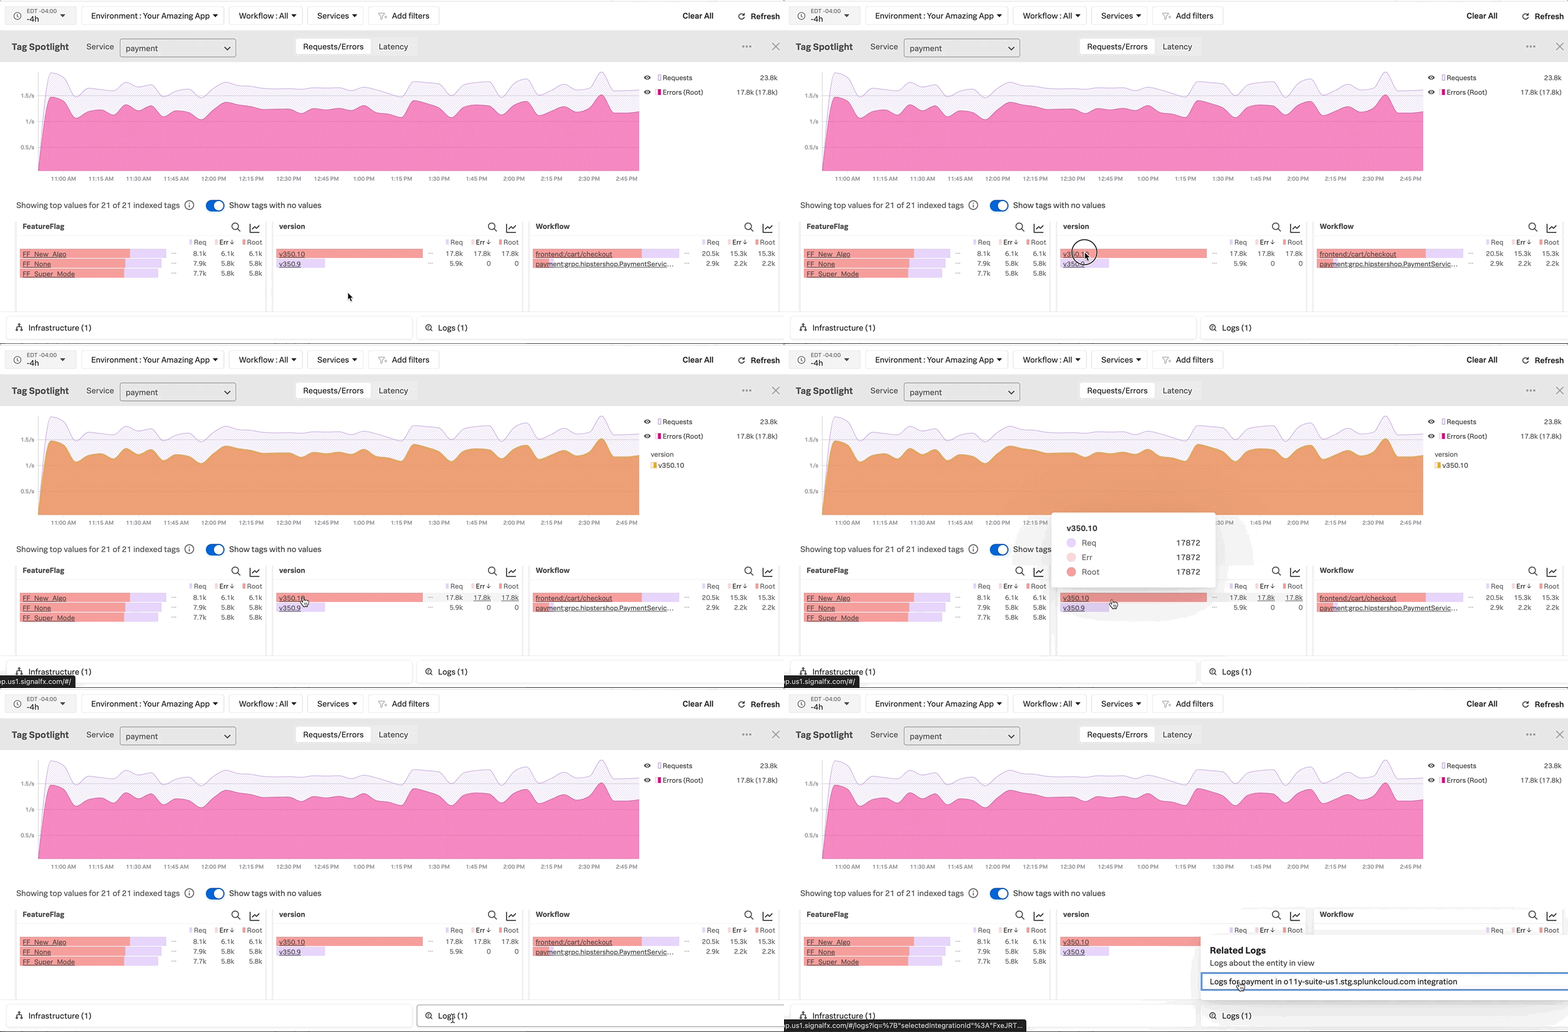
Upon analysis of Tag Spotlight, it becomes evident that every request to the latest version of the payment service (version 350.10) results in an error, signaling its unpreparedness for Production.
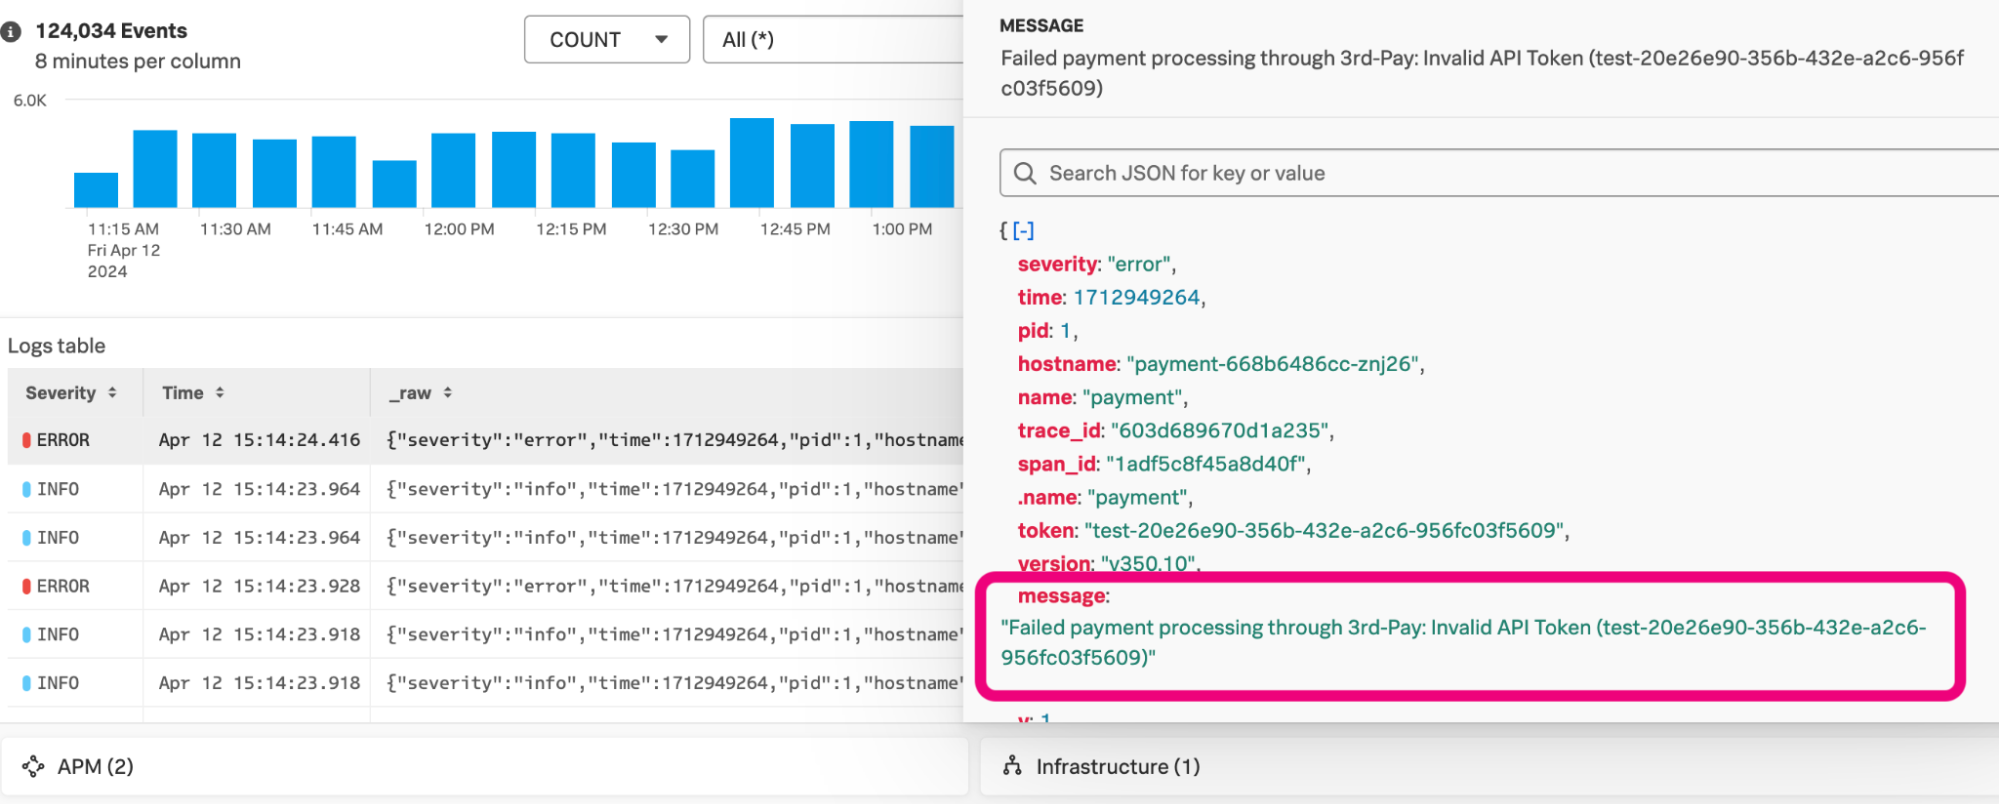
The practice of observability marks a welcome shift from solely relying on logs to encompassing metrics, traces, and more. Splunk's approach to observability recognizes the importance of harmonizing all these signals, and Splunk's Related Content feature facilitates a fluid transition to the logs, maintaining contextual information, where you definitively identify the source of the troubles as an invalid API token.
Without Splunk’s observability solution, there's a real risk of the invalid API token issue slipping into Production and manifesting at a terribly inopportune moment — precisely when a customer is on the brink of completing a purchase. Similarly, lacking clear observability measures, there's a temptation to chase after a new feature as the culprit behind the errors. This can lead you down a rabbit hole, diverting valuable time and attention away from more constructive and productive activities - nothing short of a total timesuck.
User-Friendly Tag Creation: Simplifying Data Organization
Those tags are super helpful, right? You'll be pleased to learn that accessing the intricacies of your application can often be done right from the comfort of the user interface. Splunk Observability Cloud provides an intuitive, user-friendly interface for indexing tags, allowing you to surface and organize important attributes of your application telemetry without the need for complex configuration.
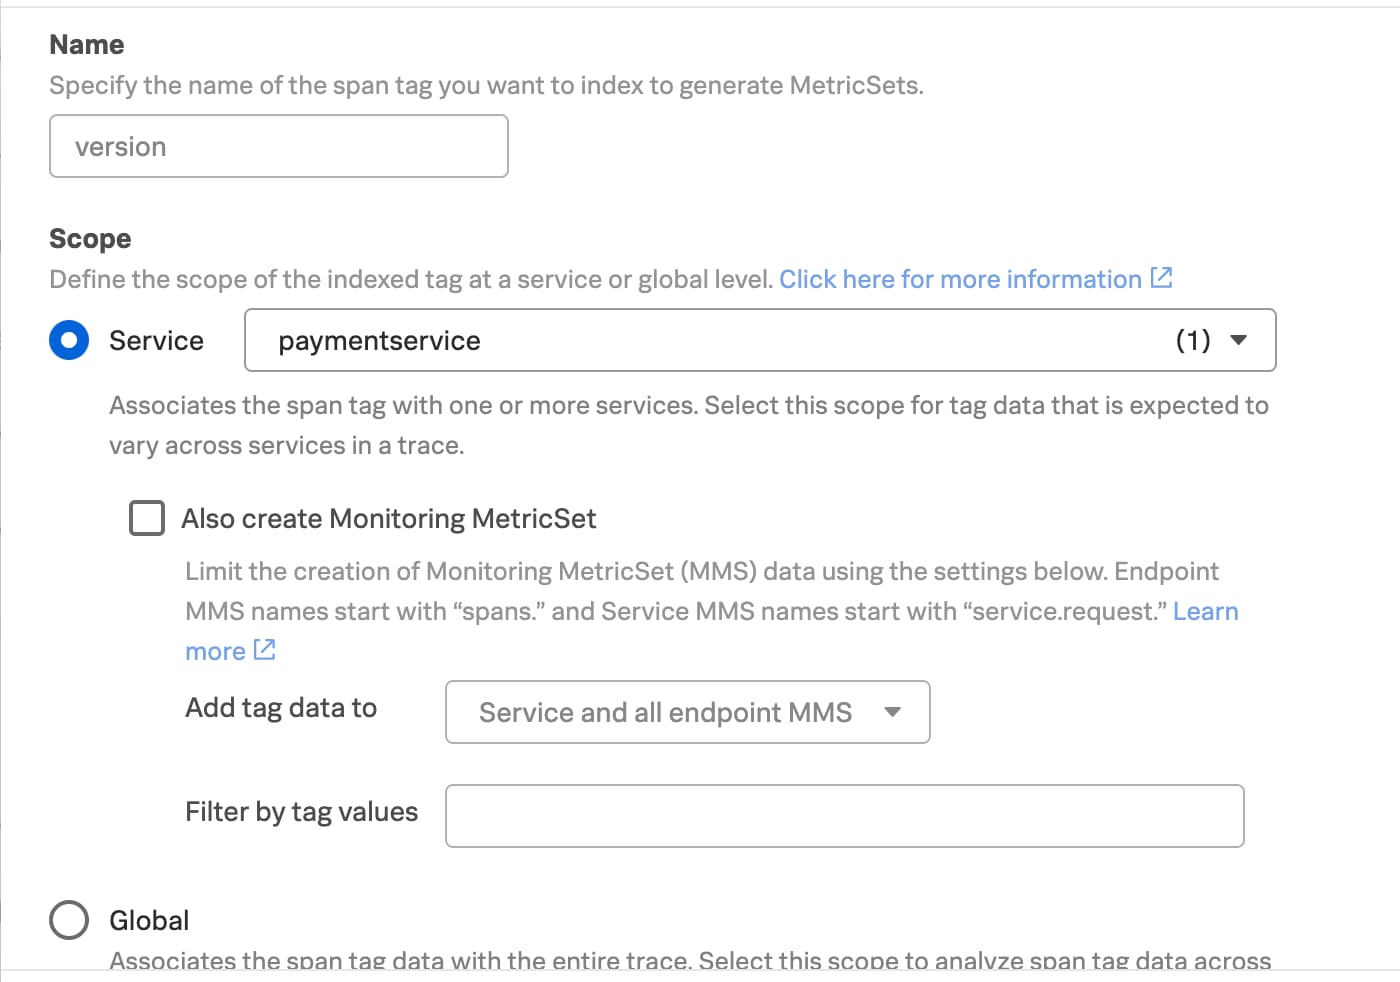
The user interface provides a clear method for defining the scope of tag data, allowing you to associate it with specific services or apply it globally across traces. At Splunk, we know that when it comes to time series metrics, effectively managing and comprehending metric cardinality is best practice. That's why Splunk APM enables you to run a cardinality assessment to understand how indexing tags will modify the breadth and depth of your metric data before applying the update. Once reviewed, you can activate the MetricSet to gain fresh insights into your application.
Recapping the scenario, the strategic use of tags combined with clean and intuitive visualizations for observability telemetry data proved pivotal. With additional support from AutoDetect detectors overseeing trace metrics, your team can successfully anticipate and track the impact of upcoming changes. This proactive approach ensures thorough vetting of modifications before deployment, guaranteeing seamless enhancement of the overall application and averting any adverse effects or unanticipated deviations.
Resilience in the Digital Wild: Fortifying Your Applications
Just as the unchecked proliferation of rabbits wreaked havoc on Australia's ecosystem, the introduction of untested features or modifications into a Production environment can similarly disrupt your application's stability. By leveraging tools like Splunk Observability Cloud to meticulously monitor and analyze changes in your environment, you can proactively identify and address potential issues before they escalate, fortifying and ensuring the resilience of your applications.
Ready to hop into enhanced application performance with Splunk Observability Cloud's APM? Get started with a free trial today and discover how Splunk can help you optimize your apps while demystifying application data. Gain real-time visibility and improve performance across your entire tech toolkit!
| < | Previously: How to Simplify Your Incident Response Workflow with Splunk On-Call |
Related Articles
About Splunk
The world’s leading organizations rely on Splunk, a Cisco company, to continuously strengthen digital resilience with our unified security and observability platform, powered by industry-leading AI.
Our customers trust Splunk’s award-winning security and observability solutions to secure and improve the reliability of their complex digital environments, at any scale.


